. 2024 Oct 23;44(43):e0137242024.
doi: 10.1523/JNEUROSCI.0137-24.2024.

PDE4B Missense Variant Increases Susceptibility to Post-traumatic Stress Disorder-Relevant Phenotypes in Mice

Affiliations

PDE4B Missense Variant Increases Susceptibility to Post-traumatic Stress Disorder-Relevant Phenotypes in Mice

Tatiana V Lipina et al. J Neurosci. .

Abstract

Large-scale genome-wide association studies (GWASs) have associated intronic variants in PDE4B, encoding cAMP-specific phosphodiesterase-4B (PDE4B), with increased risk for post-traumatic stress disorder (PTSD), as well as schizophrenia and substance use disorders that are often comorbid with it. However, the pathophysiological mechanisms of genetic risk involving PDE4B are poorly understood. To examine the effects of PDE4B variation on phenotypes with translational relevance to psychiatric disorders, we focused on PDE4B missense variant M220T, which is present in the human genome as rare coding variant rs775201287. When expressed in HEK-293 cells, PDE4B1-M220T exhibited an attenuated response to a forskolin-elicited increase in the intracellular cAMP concentration. In behavioral tests, homozygous Pde4b M220T male mice with a C57BL/6JJcl background exhibited increased reactivity to novel environments, startle hyperreactivity, prepulse inhibition deficits, altered cued fear conditioning, and enhanced spatial memory, accompanied by an increase in cAMP signaling pathway-regulated expression of BDNF in the hippocampus. In response to a traumatic event (10 tone-shock pairings), neuronal activity was decreased in the cortex but enhanced in the amygdala and hippocampus of Pde4b M220T mice. At 24 h post-trauma, Pde4b M220T mice exhibited increased startle hyperreactivity and decreased plasma corticosterone levels, similar to phenotypes exhibited by PTSD patients. Trauma-exposed Pde4b M220T mice also exhibited a slower decay in freezing at 15 and 30 d post-trauma, demonstrating enhanced persistence of traumatic memories, similar to that exhibited by PTSD patients. These findings provide substantive mouse model evidence linking PDE4B variation to PTSD-relevant phenotypes and thus highlight how genetic variation of PDE4B may contribute to PTSD risk.

Keywords: PDE4B; PTSD; cAMP; fear memory; schizophrenia; trauma.


Conflict of interest statement

The authors declare no competing financial interests.

Figures
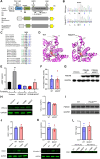
Figure 1.
Figure 1.
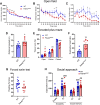
Functional consequences of PDE4BM220T variant. A, Schematic diagram depicting domain structure and functions of PDE4B isoforms. The serine residues phosphorylated by PKA (S133; activation), cyclin-dependent kinase 5 (Cdk5; S145; activation), AMP-activated protein kinase (AMPK; S319; activation), and extracellular signal-related kinase (ERK; S659; inhibition) are shown (Baillie et al., 2000; MacKenzie et al., 2002; Plattner et al., 2015; Johanns et al., 2016). Red vertical lines indicate M220T. Black horizontal lines indicate sites for PDE4B dimerization (residues 168–183, 217–235, and 314–316; Richter and Conti, 2002; Bolger et al., 2015; Cedervall et al., 2015), DISC1 binding (residues 212–245, 352–380, and 477–500; Murdoch et al., 2007), and β-amyloid binding (residues 312–313 and 327–328; Sin et al., 2024). B, Sanger sequence chromatograms showing the c.659T>C transition in Pde4b exon 8, which is predicted to convert residue 220 in PDE4B1 from ATG methionine (M) to ACG threonine (T). C, Top, Partial protein sequence alignment of mouse PDE4B1 and orthologs showing conservation in vertebrates of the M220 residue. Human PDE4B1 has a high degree of DNA (89%) and protein (97%) sequence homology with the mouse ortholog. Bottom, Partial protein sequence alignment of mouse PDE4B isoforms and paralogs showing that M220 is restricted to PDE4B1–4. PDE4B4 is not encoded by the human and orangutan genomes (Shepherd et al., 2003; Martin et al., 2023). Amino acid color code: black (nonpolar), green (uncharged polar), red (basic), blue (acidic). Residues disparate between mouse PDE4B1 and orthologs and paralogs have a gray background. D, Left, Structural model of mouse PDE4B1-WT. Right, Structural model of mouse PDE4B1-M220T variant showing cAMP binding pocket conformation altered by a β conformational bend around K282 (black). The conformation of the cAMP binding pocket is altered by the introduction of a β conformational bend around K282 and an internal interaction between E335 and Y358 is abolished. E, cAMP hydrolytic function of eGFP-tagged PDE4B1-WT transfected, eGFP-tagged PDE4B1-M220T transfected, and untransfected HEK-293T cells with (+) and without (−) forskolin treatment (10 μm; 30 min). The cAMP concentration is inversely related to cAMP hydrolysis. F, cAMP hydrolytic function of VSV-G-tagged PDE4B1-WT and M220T constructs expressed in HEK-293 cells (unpaired t test: t = 0.04; p = 0.97). Mean of four experiments. G, Unaltered PDE4B1 protein expression in eGFP-tagged PDE4B1-M220T versus PDE4B1-WT transfected HEK-293T cells. H, Unaltered PDE4B1 protein expression in VSV-G-tagged PDE4B1-M220T versus PDE4B1-WT transfected HEK-293 cells (unpaired t test: t = 2.26; p = 0.08). Mean of three experiments. I, Unaltered PDE4B protein expression in amygdala from Pde4bM220T versus WT mice. J, Unaltered endogenous DISC1 protein expression in VSV-G-tagged PDE4B1-M220T versus PDE4B1-WT transfected HEK-293 cells (unpaired t test: t = −0.66; p = 0.54). K, Unaltered endogenous β-arrestin-1/2 protein expression in VSV-G-tagged PDE4B1-M220T versus PDE4B1-WT transfected HEK-293 cells (unpaired t test: t = 0.57; p = 0.6). L, Unaltered PDE4B1-M220T binding to DISC1 demonstrated by coimmunoprecipitation of endogenous DISC1 in HEK-293 cells expressing VSV-G-tagged PDE4B1-M220T or PDE4B1-WT constructs (unpaired t test: t = −0.32; p = 0.76). VSV-G-tagged PDE4B1-Y358C was included as a positive control for decreased DISC1 binding (McGirr et al., 2016). Mean of three experiments. Data are plotted as mean ± SEM. #p < 0.05; ##p < 0.01 versus untreated within each genotype. PDE, phosphodiesterase; Untrans., untransfected.
Figure 2.
Figure 2.
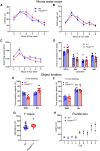
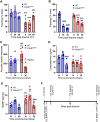
Behavior of Pde4bM220T mice in open field, EPM, forced swim, and social approach tests. A, OF: locomotor activity quantified as number of horizontal beam breaks in 5 min intervals. Pde4bM220T mice were more active during the first 20 min (RM ANOVA, time: F(11,297) = 82.2, p < 0.0001; genotype × time interaction: F(11,297) = 4.7, p < 0.0001). B, OF: rearing quantified as number of vertical beam breaks. Pde4bM220T mice reared less than WT mice at 30–40 min and 55–60 min (RM ANOVA, time: F(11,297) = 13.6, p < 0.0001; genotype × time interaction: F(11,297) = 2.9, p < 0.001). C, OF: fraction of time in the center versus the periphery in 5 min intervals (RM ANOVA, genotype: F(1,27) = 4.4, p < 0.05; time: F(11,297) = 5.6; p < 0.0001). D, EPM: distance traveled (m). E, EPM: percentage of time in the open arms (F(1,14) = 5.7; p < 0.05), closed arms (F(1,14) = 19.8; p < 0.001), and central square (F(1,14) = 10.7; p < 0.01). F, EPM: number of exploratory head dips. G, FST, percentage of time spent floating. H, Social approach test. Sociability: time (s) spent exploring an empty container versus a novel mouse (stranger 1; RM ANOVA, genotype: F(1,27) = 0.8, p > 0.05; stranger 1: F(1,27) = 17.7, p < 0.01). Social memory: time (s) spent exploring stranger 1 (previously explored mouse) versus a second novel mouse (stranger 2; RM ANOVA, genotype: F(1,27) = 2.5, p > 0.05; stranger 2: F(1,27) = 33.3, p < 0.001). Data are plotted as mean ± SEM. *p < 0.05; **p < 0.01; ***p < 0.001 versus WT. ##p < 0.01; ###p < 0.001 versus empty container or stranger 1 within each genotype. Empty, empty cylinder; S1, stranger 1; S2, stranger 2. Additional data are shown in Extended Data Figure 2-1 (EPM) and 2–2 (social approach).
Figure 3.
Figure 3.
Acoustic startle response and prepulse inhibition in Pde4bM220T mice. A, Amplitude of acoustic startle response (ASR) to a startle stimulus (110 dB, 40 ms; RM ANOVA, genotype: F(1,22) = 4.6; p < 0.05). B, Prepulse inhibition of the ASR expressed as the percent reduction in startle amplitude at prepulse levels of 72, 78, 82, and 86 dB (RM ANOVA, genotype: F(1,22) = 5.1, p < 0.05; prepulse: F(3,66) = 71.8, p < 0.0001). Data are plotted as mean ± SEM. *p < 0.05 versus WT. dB, decibels.
Figure 4.
Figure 4.
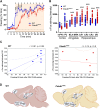
Hippocampus-dependent spatial memory in Pde4bM220T mice. A, MWM training trials: escape latency (s) at a block of four training trials with a visible platform (block V) and five blocks of four training trials with a submerged (hidden) platform in the southeast (SE) quadrant (blocks 1–5; RM ANOVA, genotype: F(1,16) = 1.89; p > 0.05; trial block: F(5,80) = 7.2, p < 0.001). B, MWM training trials: path length (m) at a block of four training trials with a visible platform (block V) and five blocks of four training trials with a submerged (hidden) platform in the southeast (SE) quadrant (blocks 1–5). C, MWM training trials: swimming speed (m/s) at each block of four training trials. D, MWM probe trial: percentage of time spent in each quadrant of the pool after 20 training trials to the SE target (T) quadrant (RM ANOVA, quadrant: F(3,48) = 41.1, p < 0.0001; genotype × quadrant interaction: F(3,48) = 3.5; p < 0.05). n = 8–14 mice per genotype. E, OLT (5 min training): percentage of time spent exploring nondisplaced (NDO) versus displaced (DO) objects after a 5 min training period (RM ANOVA, displaced object: F(1,14) = 6.2, p < 0.05; genotype × displaced object interaction: F(1,14) = 4.9, p < 0.01). F, OLT (15 min training): percentage of time spent exploring nondisplaced (NDO) versus displaced (DO) objects after a 15 min training period (RM ANOVA, displaced object: F(1,14) = 12.9, p < 0.001). G, Y-maze: percentage of alternation. H, Puzzle box: latency (s) to enter the dark compartment of the puzzle box (goal). Data are plotted as mean ± SEM. *p < 0.05 versus WT. ##p < 0.01; ###p < 0.001 versus NDO within each genotype. T, target quadrant. Additional data are shown in Extended Data Figure 4-1 (OLT).
Figure 5.
Figure 5.
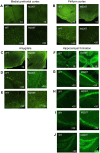
Contextual and cued fear conditioning in Pde4bM220T mice. A, Conditioning: percentage of time spent freezing during conditioning, when mice received two CS–US (tone–shock) pairings (arrowheads), in 30 s intervals (RM ANOVA, genotype: F(1,13) = 0.4, p > 0.05; time: F(10,130) = 6.7, p < 0.001; genotype × time interaction: F(10,130) = 0.5, p > 0.05). B, Contextual memory test, 24 h after conditioning: percentage of time spent freezing in 1 min intervals (RM ANOVA, genotype: F(1,17) = 0.4, p > 0.05; time: F(7,119) = 8.0, p < 0.001; genotype × time interaction: F(7,119) = 1.4, p > 0.05). C, Cued fear memory test, 48 h after conditioning: percentage of time spent freezing in 1 min intervals, with the 8 min auditory tone (gray box) presented at 3–11 min (RM ANOVA, genotype: F(1,19) = 0.7, p > 0.05; time: F(13,247) = 23.9, p < 0.001; genotype × time interaction: F(13,247) = 7.6, p < 0.05). D, Amplitude of fear-related calls (USV at 22–30 kHz; dB) during the last 3 min of the cued fear memory test. E, Number of fear-related calls. F, Duration (ms) of fear-related calls. Data are plotted as mean ± SEM. USV, ultrasonic vocalization. G, Correlation between amplitude of fear-related calls and percentage of freezing in the cued fear memory test. n = 6–7 mice per genotype. H, Hotplate: Latency (s) to withdraw paw from hotplate (52.5 ± 0.5°C). Data are plotted as mean ± SEM. *p < 0.05; **p < 0.01; ***p < 0.001 versus WT. dB, decibels; USV, ultrasonic vocalization.
Figure 6.
Figure 6.
Brain neuronal activity in trauma-exposed Pde4bM220T mice. A, Exposure to trauma: percentage of time spent freezing during conditioning, before and during (shaded) the administration of ten CS–US (tone–shock) pairings (arrowheads) at 1 min intervals (traumatic event; RM ANOVA, genotype: F(1,10) = 20.2, p < 0.001; time: F(24,240) = 68.1; p < 0.0001; genotype × time interaction: F(24,240) = 7.5, p < 0.0001). B, Genotypic difference in c-Fos staining (intensity of fluorescence) in the cortex (mPFC: F(1,52) = 18.5, p < 0.0001; PC: F(1,80) = 20.1, p < 0.01), amygdala (BLA: F(1,76) = 15.3, p < 0.0001; BMA: F(1,69) = 9.2, p < 0.01), and hippocampal formation (CA1: F(1,58) = 16.9, p < 0.0001; CA2: F(1,53) = 21.7, p < 0.0001; CA3: F(1,56) = 19.6, p < 0.0001; DG: F(1,45) = 33.7, p < 0.0001) in trauma-exposed mice at 90 min post-trauma. The area of each brain region examined is given in Extended Data Figure 6-1. C, Correlation between c-Fos staining in the DG and the percentage of freezing during 1 min after the 10th tone–shock pairing. n = 6–7 mice per genotype. D, Schematic diagrams depicting correlations between c-Fos staining in different brain regions in Pde4bM220T and WT mice at 90 min post-trauma. Solid lines, positive correlations; broken lines, negative correlations. Created with BioRender.com. Pearson's correlation coefficients (r) are given in Extended Data Figure 6-2. Data are plotted as mean ± SEM. *p < 0.05; **p < 0.01; ***p < 0.001 versus WT. BLA, basolateral amygdala; BMA, basomedial amygdala; CA1, cornu ammonis 1; CA2, cornu ammonis 2; CA3, cornu ammonis 3; DG, dentate gyrus; mPFC, medial prefrontal cortex; PC, piriform cortex.
Figure 7.
Figure 7.
Representative images of c-Fos-positive neurons in the cortex, amygdala, and hippocampal formation in trauma-exposed mice at 90 min post-trauma. A, Medial prefrontal cortex. B, Piriform cortex. C, Amygdala. D, Basolateral amygdala. E, Basomedial amygdala. F, Hippocampal formation. G, CA1. H, CA2. I, CA3. J, Dentate gyrus. × 4 and ×20 magnification.
Figure 8.
Figure 8.
Response to trauma in Pde4bM220T mice. A, Cued fear memory test at 6, 24, and 48 h post-trauma: percentage of time spent freezing (two-way ANOVA, genotype: F(1,33) = 46.8, p < 0.0001; genotype × time post-trauma interaction: F(2,33) = 12.4, p < 0.0001). ##p < 0.01 versus Pde4bM220T mice at 6 h post-trauma. B, Cued fear memory test at 3, 15, and 30 d post-trauma: percentage of time spent freezing (two-way ANOVA, genotype: F(1,36) = 17.7, p < 0.001; time post-trauma: F(2,36) = 318.4, p < 0.0001; genotype × time post-trauma interaction: F(2,36) = 46.1, p < 0.0001). ##p < 0.01; ###p < 0.001 versus 3 d post-trauma within each genotype. C, Amplitude of acoustic startle response to a startle stimulus (110 dB, 40 ms) at 1 and 30 d post-trauma (RM two-way ANOVA, ASR trial (1–3): F(2,72) = 15.8, p < 0.0001; time post-trauma: F(2,36) = 8.3, p < 0.001; genotype × time post-trauma interaction: F(2,36) = 13.1, p < 0.001). #p < 0.05; ##p < 0.01 versus first startle pulse on the test day within each genotype. The mean startle response of naive Pde4bM220T mice (266.3 ± 32.5; Fig. 3A) is indicated by a broken line. D, Plasma corticosterone levels (µg/ml) in naive (nontrauma exposed) mice and in trauma-exposed mice at 1 and 30 d post-trauma (two-way ANOVA, genotype: F(1,31) = 9.65, p < 0.01; time post-trauma: F(2,31) = 5.89, p < 0.01; genotype × time post-trauma interaction: F(2,31) = 5.09, p < 0.05). ***p < 0.001 versus WT. ###p < 0.001 versus naive mice within each genotype. E, Hippocampal BDNF levels (pg/mg total protein) in naive (nontrauma exposed) mice and in trauma-exposed mice at 1 and 30 d post-trauma (two-way ANOVA, genotype: F(1,33) = 21.2, p < 0.0001; time post-trauma: F(2,33) = 29.1, p < 0.0001; genotype × time post-trauma interaction: F(2,33) = 2.0, p = 0.14). #p < 0.05; ###p < 0.001 versus naive mice within each genotype. F, Timeline of cued fear memory testing of trauma-exposed mice. Top, Cued fear memory testing at 3 d (cohort 1), 15 d (cohort 2) and 30 d (cohort 3) post-trauma. Bottom, Ex vivo measurement of c-Fos at 90 min post-trauma and of BDNF and CORT 30 min after CS re-exposure at 1 and 30 d post-trauma. Data are plotted as mean ± SEM. *p < 0.05; **p < 0.01; ***p < 0.001 versus WT. BDNF, brain-derived neurotrophic factor; CORT, corticosterone; N, naive.

References

    1. American Psychiatric Association (2013) Diagnostic and statistical manual of mental disorders, Ed 5. Arlington, VA: American Psychiatric Association.
    1. Andero R, Ressler KJ (2012) Fear extinction and BDNF: translating animal models of PTSD to the clinic. Genes Brain Behav 11:503–512. 10.1111/j.1601-183X.2012.00801.x - DOI - PMC - PubMed
    1. Armstrong P, Güngör H, Anongjanya P, Tweedy C, Parkin E, Johnston J, Carr IM, Dawson N, Clapcote SJ (2024) Protective effect of PDE4B subtype-specific inhibition in an App knock-in mouse model for Alzheimer's disease. Neuropsychopharmacology 49:1559–1568. 10.1038/s41386-024-01852-z - DOI - PMC - PubMed
    1. Assini FL, Duzzioni M, Takahashi RN (2009) Object location memory in mice: pharmacological validation and further evidence of hippocampal CA1 participation. Behav Brain Res 204:206–211. 10.1016/j.bbr.2009.06.005 - DOI - PubMed
    1. Baillie GS, MacKenzie SJ, McPhee I, Houslay MD (2000) Sub-family selective actions in the ability of Erk2 MAP kinase to phosphorylate and regulate the activity of PDE4 cyclic AMP-specific phosphodiesterases. Br J Pharmacol 131:811–819. 10.1038/sj.bjp.0703636 - DOI - PMC - PubMed

Substances

LinkOut - more resources