

Behavioural stochastic resonance across the lifespan
- PMID: 39256251
- PMCID: PMC11525268
- DOI: 10.3758/s13415-024-01220-w
Behavioural stochastic resonance across the lifespan
Abstract
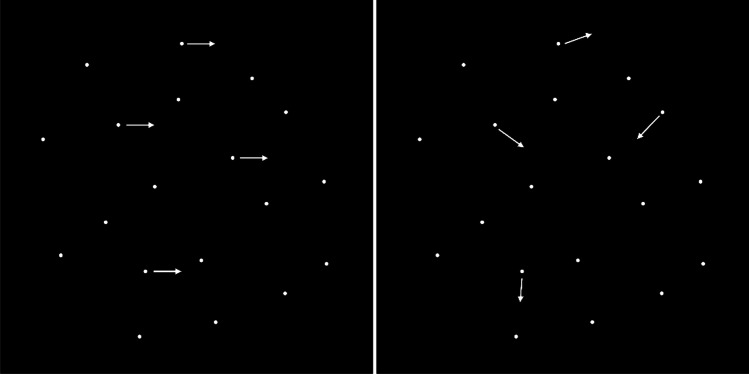
Stochastic resonance (SR) is the phenomenon wherein the introduction of a suitable level of noise enhances the detection of subthreshold signals in non linear systems. It manifests across various physical and biological systems, including the human brain. Psychophysical experiments have confirmed the behavioural impact of stochastic resonance on auditory, somatic, and visual perception. Aging renders the brain more susceptible to noise, possibly causing differences in the SR phenomenon between young and elderly individuals. This study investigates the impact of noise on motion detection accuracy throughout the lifespan, with 214 participants ranging in age from 18 to 82. Our objective was to determine the optimal noise level to induce an SR-like response in both young and old populations. Consistent with existing literature, our findings reveal a diminishing advantage with age, indicating that the efficacy of noise addition progressively diminishes. Additionally, as individuals age, peak performance is achieved with lower levels of noise. This study provides the first insight into how SR changes across the lifespan of healthy adults and establishes a foundation for understanding the pathological alterations in perceptual processes associated with aging.
Keywords: Ageing; Neural noise; Psychophysics; Stochastic resonance; Visual perception.
© 2024. The Author(s).
Conflict of interest statement
The authors have declared that no competing interests exist.
Figures


References
-
- Aihara, T., Kitajo, K., Nozaki, D., & Yamamoto, Y. (2008). Internal noise determines external stochastic resonance in visual perception. Vision Research,48(14), 1569–1573. 10.1016/j.visres.2008.04.022 - PubMed
-
- Aihara, T., Kitajo, K., Nozaki, D., & Yamamoto, Y. (2010). How does stochastic resonance work within the human brain? – Psychophysics of internal and external noise. Chemical Physics,375(2), 616–624. 10.1016/j.chemphys.2010.04.027
-
- Arnold, T. W. (2010). Uninformative Parameters and Model Selection Using Akaike’s Information Criterion. Journal of Wildlife Management,74(6), 1175–1178. 10.2193/2009-367
-
- Baracchini, G., Mišić, B., Setton, R., Mwilambwe-Tshilobo, L., Girn, M., Nomi, J. S., Uddin, L. Q., Turner, G. R., & Spreng, R. N. (2021). Inter-regional BOLD signal variability is an organizational feature of functional brain networks. NeuroImage,237, 118149. 10.1016/J.NEUROIMAGE.2021.118149 - PMC - PubMed
MeSH terms
LinkOut - more resources
Full Text Sources
Medical
Research Materials
