. 2024 Oct;162(1):75-92.
doi: 10.1007/s11120-024-01118-1. Epub 2024 Sep 10.

Optimizing photosynthetic light-harvesting under stars: simple and general antenna models

Affiliations

Optimizing photosynthetic light-harvesting under stars: simple and general antenna models

Samir Chitnavis et al. Photosynth Res. 2024 Oct.

Abstract

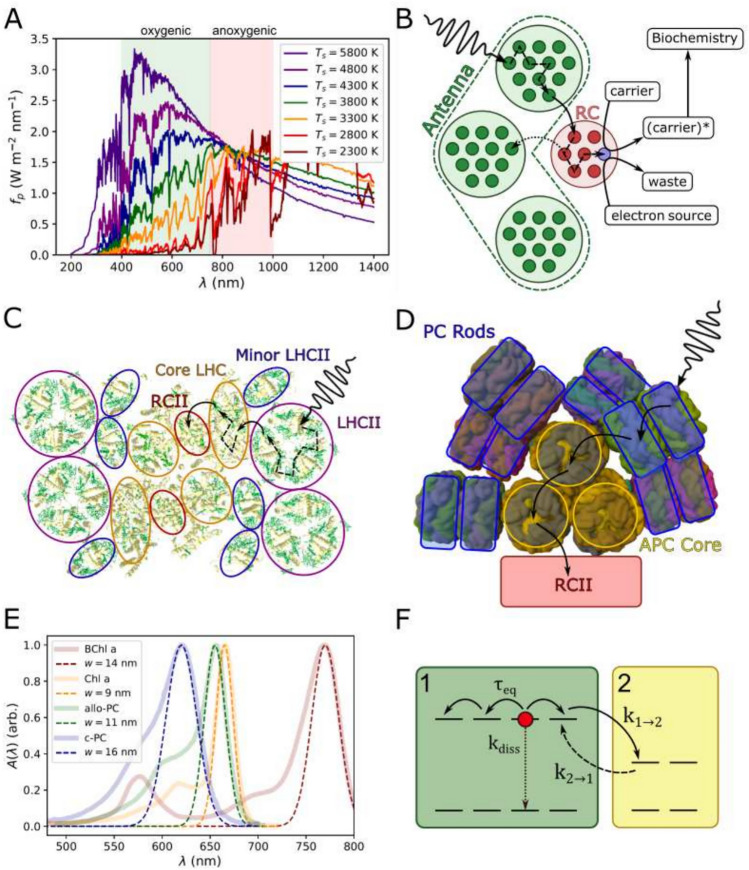
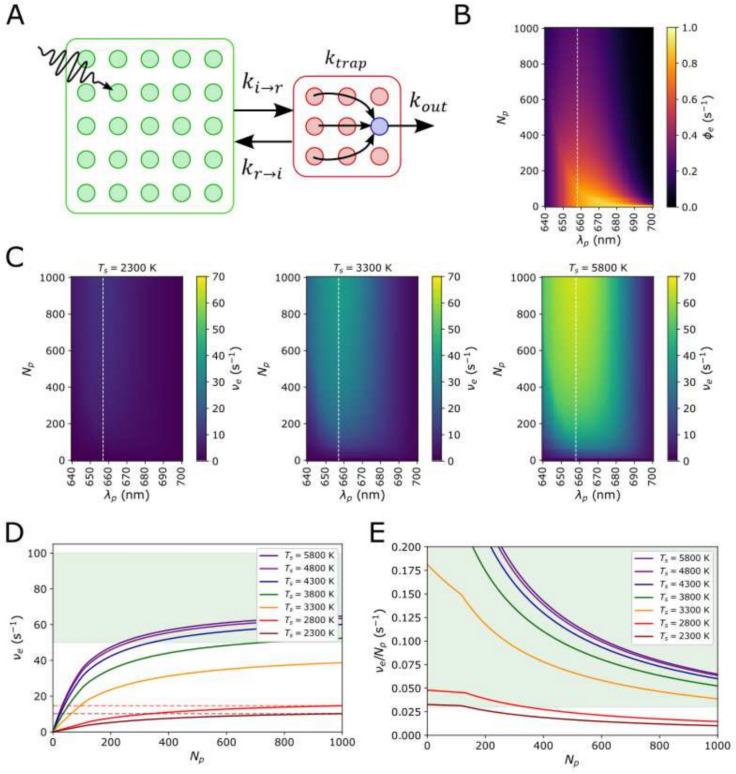
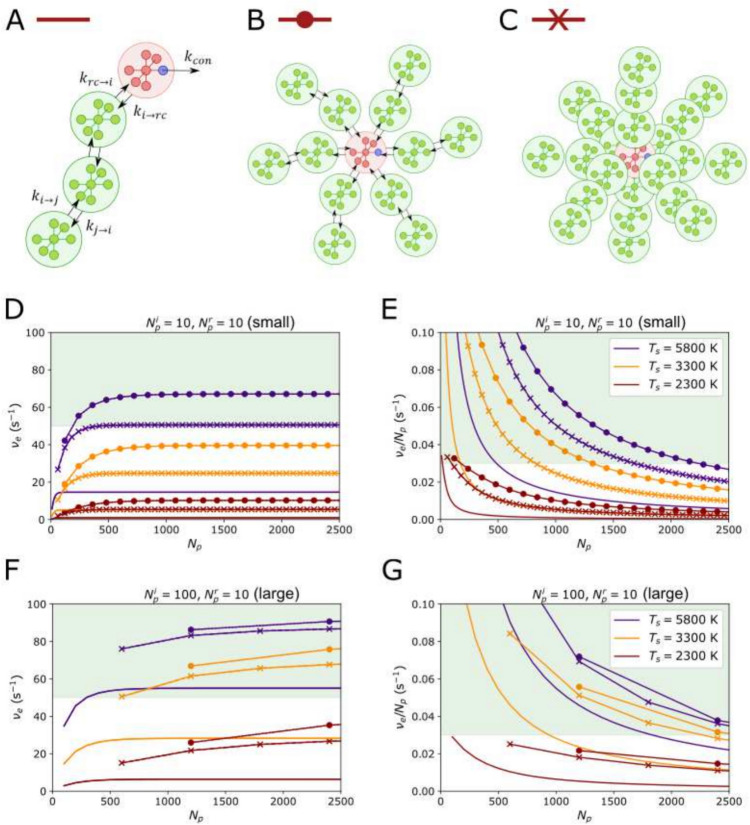
In the next 10-20 years, several observatories will aim to detect the signatures of oxygenic photosynthesis on exoplanets, though targets must be carefully selected. Most known potentially habitable exo-planets orbit cool M-dwarf stars, which have limited emission in the photosynthetically active region of the spectrum (PAR, 400 < λ < 700 nm) used by Earth's oxygenic photoautotrophs. Still, recent experiments have shown that model cyanobacteria, algae, and non-vascular plants grow comfortably under simulated M-dwarf light, though vascular plants struggle. Here, we hypothesize that this is partly due to the different ways they harvest light, reflecting some general rule that determines how photosynthetic antenna structures may evolve under different stars. We construct a simple thermodynamic model of an oxygenic antenna-reaction centre supercomplex and determine the optimum structure, size and absorption spectrum under light from several star types. For the hotter G (e.g. the Sun) and K-stars, a small modular antenna is optimal and qualitatively resembles the PSII-LHCII supercomplex of higher plants. For the cooler M-dwarfs, a very large antenna with a steep 'energy funnel' is required, resembling the cyanobacterial phycobilisome. For the coolest M-dwarfs an upper limit is reached, where increasing antenna size further is subject to steep diminishing returns in photosynthetic output. We conclude that G- and K-stars could support a range of niches for oxygenic photo-autotrophs, including high-light adapted canopy vegetation that may generate detectable bio-signatures. M-dwarfs may only be able to support low light-adapted organisms that have to invest considerable resources in maintaining a large antenna. This may negatively impact global coverage and therefore detectability.

Keywords: Antennae; Astrobiology; Cyanobacteria; Light-harvesting; Thermodynamic models.


Conflict of interest statement

There are no conflicts of interest to disclose.

Figures

Fig. 1
Fig. 1
A Incident spectral fluxes, fpλ;Ts,asp for a range of stellar temperatures, Ts. The green and red shaded boxes indicate the approximate absorption windows for oxygenic (photosynthetically active radiation, PAR) and anoxygenic photosynthesis respectively; the red and orange plots are representative of M-dwarf stars while the purple plot is representative of the Sun. B Schematic of the generalized photosystem in which a RC (red) is fed excitons by an antenna composed of multiple light-harvesting proteins (green). Energy rapidly equilibrates within an LHC subunit (dashed) arrows and then hops to another complex (solid arrows). Once on the RC it can reach the trap (blue) where the energy is used to oxidize an electron source and reduce an electron carrier. C A schematic of the PSII supercomplex from plants as it lies in the plane of the membrane (adapted from PDB: 5XNM (Su et al. 2017)). The antenna is composed of different chlorophyll-binding LHC sub-units (LHCII and minor variants plus the ‘core antenna’ complexes). The PSII RC (labelled RCII is shown in red). D schematic of the bilin-binding phycobilisome antenna of the cyanobacterium Synechococcus sp. PCC 7002, as viewed along the plane of the membrane (adapted from PDB: 7EXT (Zheng et al. 2021)). Phycocyanin (PC, blue) sub-units are stacked into branches or rods which radiate out from an antenna core of allophycocyanin (APC, yellow) sub-units. These are connected to essentially the same RCII complex found in plants. E. The lowest energy absorption bands of photosynthetic pigments Bacteriochlorophyll a (red), Chlorophyll a (orange), allophycocyanin (green) and c-phycocyanin (blue). The dashed lines represent Gaussian fits with widths in the range w=9-16 nm. Note that we do not fit the blue vibronic edge of each pigment, which is quite pronounced for c-PC. F. Schematic of energy hopping between two LHC sub-units (labelled 1 and 2). Here forward transfer, k12, is enthalpically favourable since it involves a reduction in excitation energy. However, it is entropically unfavourable since the excitation will have fewer pigments to sample in the smaller sub-unit 2
Fig. 2
Fig. 2
A A schematic of a simplified photosystem. An LHC sub-unit (shown in green) containing a variable number, Np, of identical pigments with a variable absorption peak, λp, coupled to an oxygenic RC with absorption peak λpr=680 nm (shown in red). Arrows indicate exciton hopping, kir; trapping, ktrap; and the reduction of the electron carrier, kout. B A heatmap of the absolute quantum efficiency of the antenna, ϕe(Np,λp). This is independent of light intensity and therefore identical for all Ts. The white dashed line indicates the antenna absorption peak, λpopt659 nm, that gives the maximum νe. C Heatmaps of νe(Np,Ts) for Ts=2300, 3300, and 5800 K. D νe(Np) calculated for λpopt659 nm for the full range of Ts. The green region indicates the region νeνemax/2 E The electron output per pigment, νe/Np as a function of Np (λpopt659 nm) for the full range of Ts. The green region indicates νe/Np>0.03 s-1, an approximate lower limit for oxygenic photosynthesis on Earth
Fig. 3
Fig. 3
A A schematic of a linear, modular photosystem. The RC is connected to a single (Nb=1) chain of ns identical antenna subunits which each contain Npi identical pigments with peak absorbance wavelength, λpi. B A ‘2D’ modular antenna with Nb=6 identical branches radiating out from a RC. C A ‘3D’ antenna consists of Nb=12 identical branches radiating out from the RC. The figure shows only 9 simply for clarity. D The electron output rate, νe, as a function of total number of pigments, Np, for an increasing increasing number of ‘small’ antenna subunits (Npi=Npr=10). We consider a linear (solid line), 2D (line and crosses) and 3D (line and dots) modular photosystem, for Ts=5800 (indigo), 3300 (orange), and 2300 K (maroon). Each point represents the addition of 1 antenna sub-unit to every branch in the system. The green region indicates the region νemax/2νemax. E The electron output rate per pigment, νe/Np, for the same combinations of photosystem structure and Ts. The green region indicates νe/Np>0.03 s-1. F The same as D. but for ‘large’ antenna sub-units (Npi=100, Npr=10). G Same as (E). but for large antenna sub-units
Fig. 4
Fig. 4
A Schematic of a funnel antenna in which different sub-units bind different pigment types and the arrangement of these different sub-units is highly conserved. The different colors signify that bluer pigments are bound further out from the RC. B An illustrative plot of the absorption profiles of a chain of 3 progressively shifted antenna sub-units connected to the RC. C Heat-maps of νeΔλp,Np for Ts=2800, 3300, and 5800 K, where Nb=6 and Npi=10Npr. Not shown are the same data for Nb=12 which shows exactly the same trend but a slightly higher maximum νe. The white dashed line indicates the most optimum Δλp. D Plots of νe(Np) for optimum Δλp. The labelling is the same as Fig. 3. The fade curves are for a modular antenna, repeated here for comparison. The green region indicates the region νemax/2nemax E νe/Np for the same structured antenna configurations. The green region indicates νe/Np>0.03 s-1
Fig. 5
Fig. 5
A The absorption spectrum (dark red line) of an antenna composed of a ring of 6 identical LHC sub-units, with an absorption maximum at λp=665 nm, compared to the Qy-Qx absorption band of PSII in plants (light red line, digitized from Laisk et al. 2014). Also shown is he spectral flux of fp(λ,5800K) (purple line) and the vertical dashed line indicates the position (λpr=680 nm) of the RC. Inset is a sketch of this antenna system. B The combined absorption spectrum (sharp orange line) of a funnel antenna with 12 branches each of 5 sub-units, and a progressive blue-shift of Δλp=8 nm. This is shown alongside the absorption spectrum of the phycobilisome (PBS) antenna from cyanobacteria Synechocystis sp. PCC 6803 (thick orange line, digitized from Lea-Smith et al. 2014). Also shown is the spectral flux of fp(λ,2300K) in absolute scale (solid red line) and stretched for clarity (dashed red line). Inset is a very rough sketch of this 3D antenna system surrounding the RC

Similar articles

Cited by

References

    1. Akhtar P, Caspy I, Nowakowski PJ et al (2021) Two-dimensional electronic spectroscopy of a minimal photosystem i complex reveals the rate of primary charge separation. J Am Chem Soc 143:14601–14612 - PubMed
    1. Anglada-Escudé G, Amado PJ, Barnes J, et al (2016) A terrestrial planet candidate in a temperate orbit around Proxima Centauri. Nature 536(7617):437–440. 10.1038/nature19106, arXiv:1609.03449 [astro-ph.EP] - PubMed
    1. Arecibo PU (2024) The Planetary Habitability Laboratory @ UPR Arecibo. https://phl.upr.edu/home
    1. Arnold L, Gillet S, Lardière O et al (2002) A test for the search for life on extrasolar planets* - looking for the terrestrial vegetation signature in the earthshine spectrum. A &A 392(1):231–237. 10.1051/0004-6361:20020933
    1. Arp TB, Kistner-Morris J, Aji V et al (2020) Quieting a noisy antenna reproduces photosynthetic light-harvesting spectra. Science 368(6498):1490–1495. 10.1126/science.aba6630 - PubMed

MeSH terms

Substances

LinkOut - more resources