. 2024 Sep 10;15(1):7383.
doi: 10.1038/s41467-024-51432-4.

Deep intravital brain tumor imaging enabled by tailored three-photon microscopy and analysis

Affiliations

Deep intravital brain tumor imaging enabled by tailored three-photon microscopy and analysis

Marc Cicero Schubert et al. Nat Commun. .

Abstract

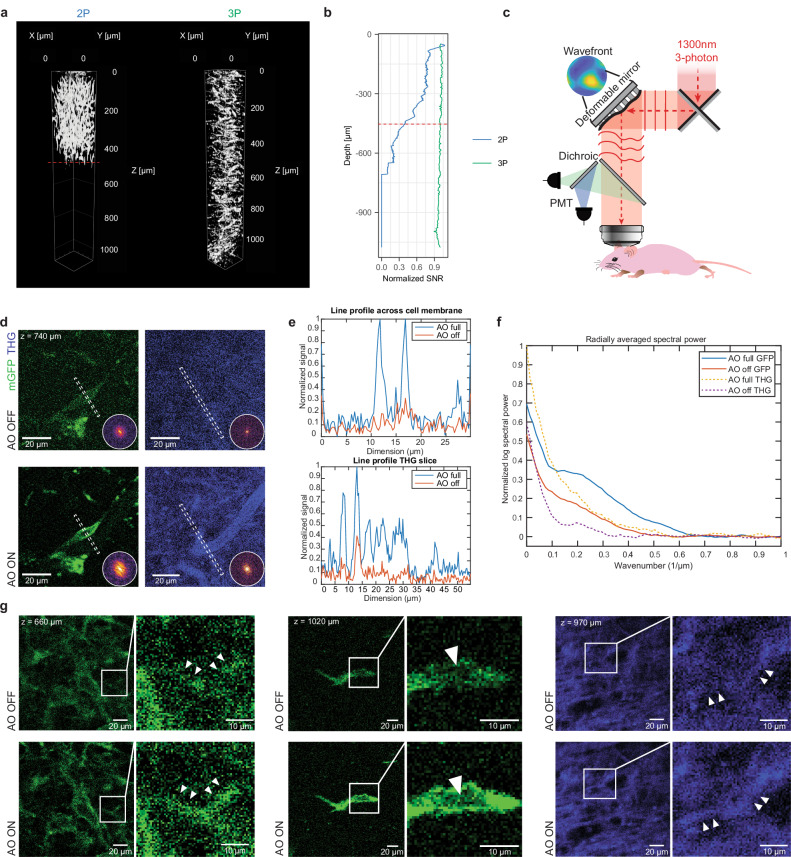
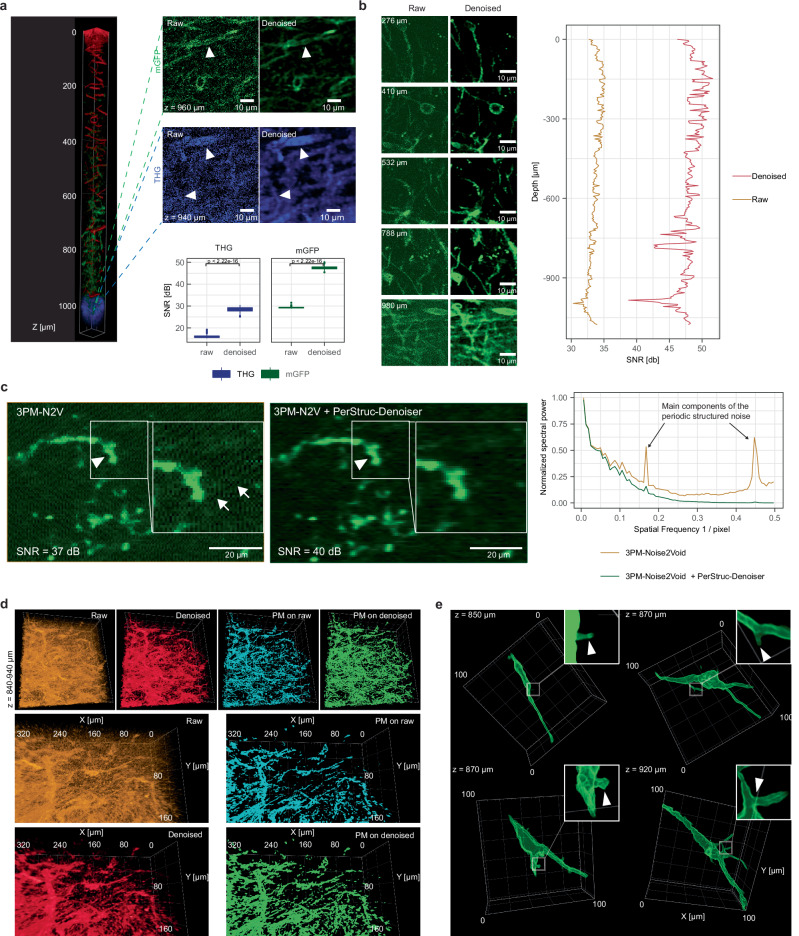
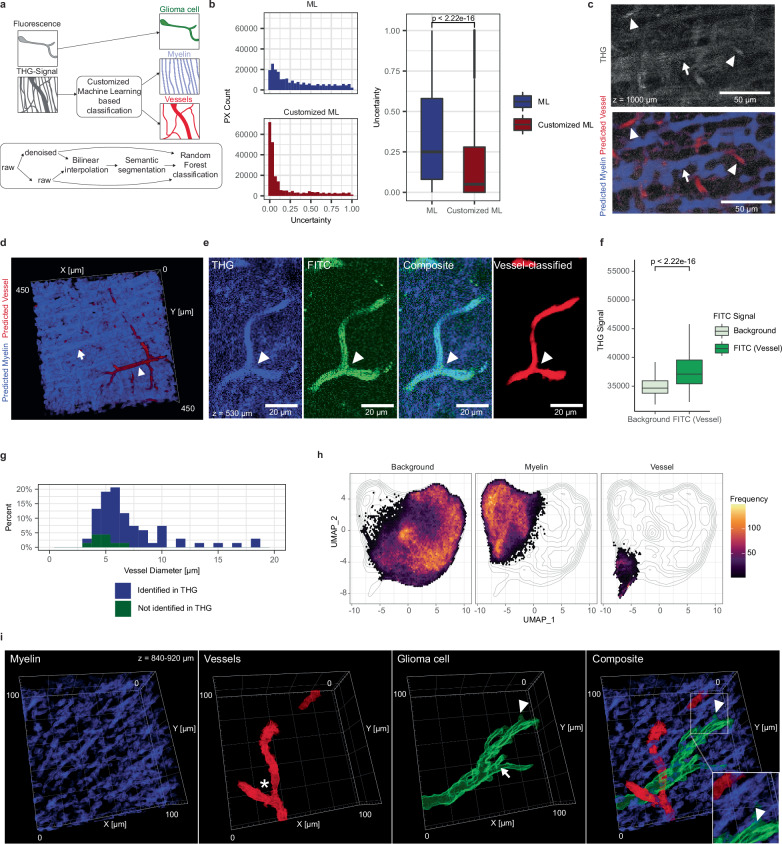
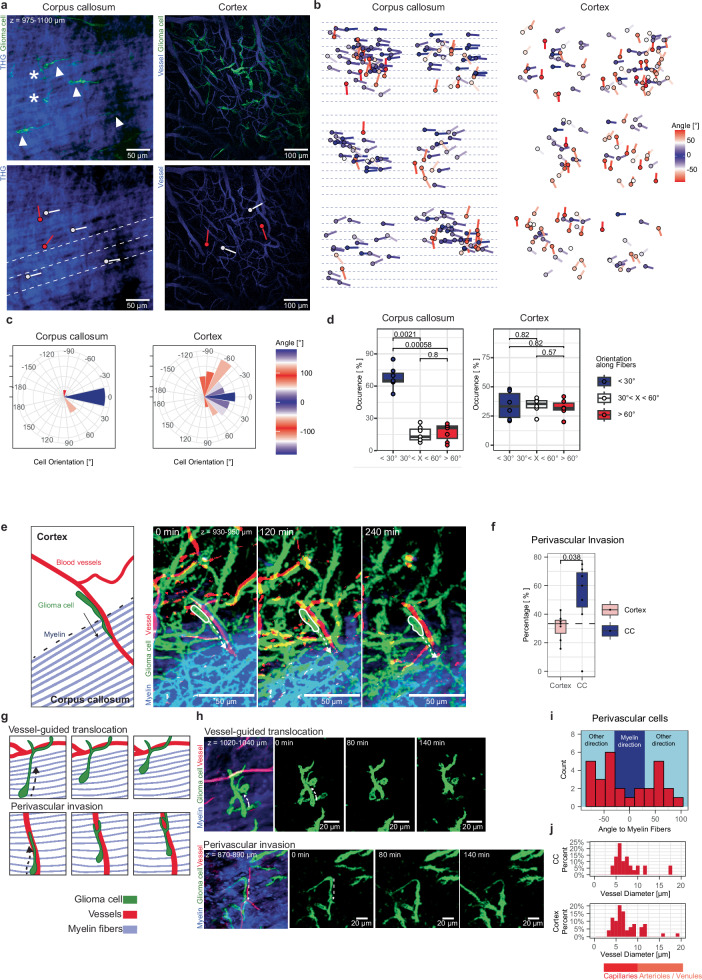
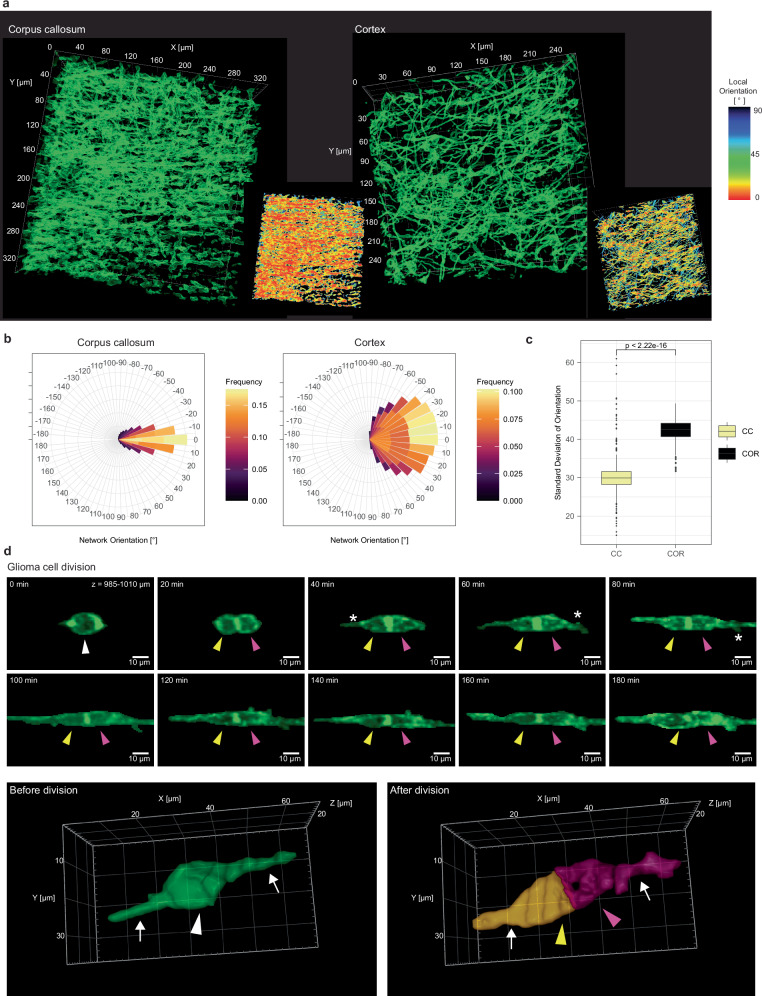
Intravital 2P-microscopy enables the longitudinal study of brain tumor biology in superficial mouse cortex layers. Intravital microscopy of the white matter, an important route of glioblastoma invasion and recurrence, has not been feasible, due to low signal-to-noise ratios and insufficient spatiotemporal resolution. Here, we present an intravital microscopy and artificial intelligence-based analysis workflow (Deep3P) that enables longitudinal deep imaging of glioblastoma up to a depth of 1.2 mm. We find that perivascular invasion is the preferred invasion route into the corpus callosum and uncover two vascular mechanisms of glioblastoma migration in the white matter. Furthermore, we observe morphological changes after white matter infiltration, a potential basis of an imaging biomarker during early glioblastoma colonization. Taken together, Deep3P allows for a non-invasive intravital investigation of brain tumor biology and its tumor microenvironment at subcortical depths explored, opening up opportunities for studying the neuroscience of brain tumors and other model systems.


Conflict of interest statement

F.W. and W.W. report the patent (WO2017020982A1) “Agents for use in the treatment of glioma.” F.W. is co-founder of DC Europa Ltd (a company trading under the name Divide & Conquer) that is developing new medicines for the treatment of glioma. Divide & Conquer also provides research funding to F.W.’s lab under a research collaboration agreement. The remaining authors declare no competing interests.

Figures

Fig. 1
Fig. 1. Rationale and combined experimental/analysis pipeline for deep brain tumor imaging.
a Left: Autopsy brain slice of a patient with IDH-WT glioblastoma. The corpus callosum (CC) is labeled with a dashed line. Arrowhead indicates main tumor mass; arrow indicates tumor infiltration in the CC as seen in the inset. Middle: Tumor infiltrated CC in S24 PDX mouse model. The CC is labeled with a dashed line, fluorescently labeled glioblastoma cells (GBMCs) are shown in green. Arrow indicates glioma infiltration of the CC. Right: Percentage of CC infiltration in human autopsies (n = 43 patients) and in PDX models (n = 23 PDX models). b Workflow of Deep3P. Upper left: Establishment of in vivo patient-derived glioma xenograft model. GBM cell lines are derived from patients and stably transduced with mGFP and injected into mice brain. Upper right: Combination of 2PM and 3PM to identify target regions for deep brain imaging. Bottom: Deep brain imaging in the CC and subsequent deep and machine learning based post-processing to allow simultaneous myelin, vessel and tumor analysis. Created with BioRender.com released under a Creative Commons Attribution-NonCommercial-NoDerivs 4.0 International license (https://creativecommons.org/licenses/by-nc-nd/4.0/deed.en).
Fig. 2
Fig. 2. AO-enhanced 3PM and AI-based denoising allows near-diffraction limited resolution at large image depths and high SNR imaging.
a 3D renderings showing 2PM and 3PM imaging down to approximately 1000 µm. Gamma values were adjusted for 3D visualization. b SNR of 2PM and 3PM along depths, normalized to the SNR at the brain surface. The dashed red line in (a, b) indicates the imaging depth at which biological structures cannot be clearly discerned anymore in 2PM in contrast to 3PM (approximately 450 µm). c Scheme of 3PM and adaptive optics setup. Modified from Fig. 1a in Ref. 22. d Exemplary GBMC imaged without (top left) and with (bottom left) AO optimization and the corresponding images on the THG channel (top and bottom right). The line indicates the line segment averaged over to produce the line profiles in (e), (n = 6 experiments with similar results) showing the effect of uncorrected optical aberration on the visibility of fine cellular structures. The inset on each panel shows the frequency domain power spectrum of the image, with the ring indicating 1 µm length scale. e Line profile comparisons for both mGFP and THG channels showing intensity enhancement. f The averaged radial profile of the frequency maps is shown, allowing easier estimation of the respective frequency cut-offs. g Exemplary 3PM images with and without AO optimization on the mGFP channel at different depths in deep cortex and CC (left and middle) and on the THG channel within the CC (right). Zoom-ins are shown on the right. Arrowheads show TMs (left), a shadow of a cell nucleus that is caused by the membrane-bound GFP labeling (middle), and a blood vessel (right) on AO on and off images. TMs, the cell nucleus, and the blood vessel are not clearly visible without AO (n = 6 experiments with similar results). Source data are provided as a Source Data file.
Fig. 3
Fig. 3. Denoising of AO-3PM and subsequent machine learning allows brain tumor imaging across the entire cortex and corpus callosum.
a Top left: 3D rendering of a stack going from the surface down to the CC. Red: blood vessels, blue: CC, green: GBMCs. Based on probability maps. Top right: Comparison of raw (left) and denoised (right) images within the CC (dashed lines on the left indicate imaging depth). Arrowheads in the mGFP image point to a GBMC soma that can be barely seen without denoising. Arrowheads in the THG signal point to fibrous structures that can be clearly identified after denoising. Bottom: signal-to-noise ratio (SNR) comparison of raw and denoised in THG and mGFP signal (two-sided Mann-Whitney test, n = 114 slices for each mGFP and THG signal, shown as median +/- quartile, whiskers: min/max within 1.5 IQR). b Left: Exemplary raw and denoised images of GBMCs at different depths. Right: SNR in raw and denoised images across entire image stack. (n = 6 experiments with similar results) c Comparison of the denoised 3PM-N2V image (left) and its version with additional application of the PerStruc-Denoiser (middle) showing the qualitative improvement corresponding to a 3 dB increase in SNR allowing a clearer identification of TMs (arrowhead). Arrows point to structured noise. Right: Averaged line power spectrum of the images depicting the PerStruc-Denoiser’s suppression of the main components of the periodic structured noise (see arrows pointing to its main components). d 3D renderings based on raw images, denoised images, probability maps based on raw images and probability maps based on denoised images. e Close-up 3D renderings of single GBMCs based on probability maps. The arrow heads on the zoom-ins point at small processes (top images and bottom left image) and a TM branching point (bottom right image). Gamma values were adjusted for 3D visualization in (a, d, e). Source data are provided as a Source Data file.
Fig. 4
Fig. 4. Machine learning-based multicolor imaging of glioblastoma, blood vessels and white matter tracts.
a Scheme for customized machine learning based classification of THG signal into myelin and vessel signal. b Distribution of uncertainty level with machine learning compared with customized machine learning (left) and statistical comparison of uncertainty levels (n = 239568 THG pixels, two-sided Mann–Whitney test, shown as median +/- quartile, whiskers: min/max within 1.5 IQR). c Exemplary image of THG signal without (top) and with (bottom) predicted labels of blood vessels and myelin fibers. Arrowheads indicate blood vessels; arrow indicates myelin fibers (n = 3 experiments with similar results). d 3D rendering within the CC, illustrating the results of the machine learning-based classification. Arrowhead indicates vessels, arrow indicates myelin fibers. e Validation of ML-classification for blood vessels with FITC as fluorescent dye colored in green. The arrowheads point at vessels (n = 3 experiments with similar results). f Comparison of high and low FITC signal with THG signal (n = 62244 pixels, two-sided Mann–Whitney test, shown as median +/- quartile, whiskers: min/max within 1.5 IQR). g Histogram of measured blood vessels based on their diameter and colored based on their identification from THG signal (blue: visible with FITC and in THG signal, green: visible only with FITC, n = 68 vessels). h UMAP based on pixel features that are different between background, myelin, and vessels based on the machine learning prediction (n = 100 features). Pixels are colored based on the local frequency of pixels in the dimensionality-reduced space (n = 239568 pixels). i Close-up 3D rendering of a single GBMC (green) and its surrounding microenvironment (vessel in red, myelin in blue). The asterisk points at a vessel branching points, the arrow at a TM branching point and the arrowhead at a glioblastoma small process. Gamma values were adjusted for 3D-visualization in (d, i). Source data are provided as a Source Data file.
Fig. 5
Fig. 5. Glioblastoma cell polarity and vascular invasion patterns into and in the corpus callosum.
a Top: Maximum intensity projections (MIP) of regional overviews of GBMCs in the CC and cortex. Arrowheads: exemplary cells parallel to the myelin fibers (angle <30°), asterisks: exemplary non-parallelly oriented GBMCs. Bottom left: THG signal only. Dashed: myelin fiber direction, white symbols: exemplary GBMCs aligned with white matter tracts, red symbols: exemplary non-parallelly orientated cells. Bottom right: red and white symbols represent exemplary GBMCs in the region shown above (vessel channel). b Directionality analysis of tumor cell regions in CC and cortex (n = 355 GBMCs, n = 12 experiments, n = 10 mice, 2 PDX models). Dashed: myelinated fiber direction within CC. c Rose plot of tumor cell directionality of regions in (a), in CC and cortex (n = 67 GBMCs, n = 2 experiments). d Comparison of predominant angle direction of cell polarity (n = 211 and n = 164 GBMCs in the CC and cortex, respectively, n = 13 experiments, n = 11 mice, 2 PDX models; two-sided Mann-Whitney, shown as median +/- quartile, whiskers: min/max within 1.5 IQR). e Schematic and MIP of a GBMC (soma encircled in white) using vessels to invade into the CC. Dashed: invasion direction along blood vessel. Vessels, tumor cells and myelinated fiber shown as probability maps. f Percentage of GBMCs showing perivascular invasion into the CC as compared to within the cortex (n = 206 GBMCs, n = 14 experiments, two-sided Mann-Whitney test, shown as median +/- quartile, whiskers: min/max within 1.5 IQR). g Schematic drawing and h example of tumor cells using vessel related invasion mechanisms. Dashed: invasion direction. Vessels and tumor cells shown as probability maps. CC signal was post-processed by denoising. i Histogram of angles between perivascular cells and myelin fiber orientation. (n = 29 GBMCs, n = 8 experiments, n = 6 mice, 2 PDX models). j Histogram of blood vessel diameter of perivascular cells in CC (n = 29 GBMCs, n = 8 experiments, n = 6 mice, 2 PDX models) and cortex (n = 54 GBMCs, n = 7 experiments, n = 7 mice). PDX models: S24 and T269. Source data provided as Source Data file.
Fig. 6
Fig. 6. TM dynamics and neural invasion mechanisms in the corpus callosum.
a Representative MIP time-lapse images showing TMs in the CC that use branching, protrusion, or retraction. Asterisks point at the GBMC somata, arrowheads point towards the tips of the TMs of interest. Dashed arrows: direction of the TM dynamic. b Distribution of TM dynamics in the CC and comparison with cortex using branching, protrusion or retraction (n = 163 cells from n = 14 datasets in 12 mice in 2 PDX models (S24 and T269)). c Representative MIP time-lapse images of invasion phenotypes in CC showing locomotion, translocation and branching migration. Dashed arrows: invasion direction. The straight line in the first translocation image indicates the stable location of the TM tip throughout all images. d Distribution of invasion phenotypes in the CC compared to the cortex (n = 99 invasive cells from n = 14 experiments in 13 mice, two-sided Mann-Whitney test, shown as median +/- quartile, whiskers: min/max within 1.5 IQR). e Speed comparison of invasion phenotypes in CC (n = 66 GBMCs from n = 7 experiments in 6 mice, two-sided Mann-Whitney test, shown as median +/- quartile, whiskers: min/max within 1.5 IQR). f Mean squared displacement is shown over time (n = 108 GBMCs, error bars indicate mean +/-s.e.m). Images were post-processed as probability maps and using the “smooth” function in ImageJ/Fiji in (a, c). Source data are provided as a Source Data file.
Fig. 7
Fig. 7. Tumor-tumor network formation and glioma cell proliferation in cortex and corpus callosum.
a Brain tumor networks in the CC (left) and in the cortex (right) shown as 3D renderings in green. CC and cortex imaging were performed with 3PM and 2PM, respectively. Each network is visualized as network orientation in the bottom right corner. The network is colored based on the local orientation. CC imaging depth: z = 840-950 µm. b Rose plot of overall orientation of the tumor cell network in the CC (n = 271985 local network orientation values from n = 6 brain tumor networks from n = 5 mice). c The standard deviation of tumor network orientation is compared in the CC to the cortex. (n = 692 slices from n = 6 brain tumor networks from n = 5 mice, Mann-Whitney test, shown as median +/- quartile, whiskers: min/max within 1.5 IQR). d Top: MIP time-lapse imaging of GBMC division in the CC. White arrowhead: GBMC before cell division. Yellow and purple arrowhead: Daughter GBMCs after cell division. The asterisk points at a newly grown TM after cell division. Post-processed with denoising and “clear outside” function in ImageJ/Fiji. Bottom: 3D rendering of another cell in the CC before and after cell division. The arrowheads point to the somata of the cell before division and the two daughter cells after division, the arrows point to the TMs (n = 18 cell divisions from n = 7 experiments in 6 mice in 2 PDX models (S24 and T269)). Gamma values were adjusted for 3D-visualization in (a, d). Source data are provided as a Source Data file.
Fig. 8
Fig. 8. White matter reactivity in the corpus callosum upon glioblastoma invasion and colonization.
a Representative MR images of two patients with IDH-wildtype glioma with affection of the CC (T1CE and ADC). b ROI-based quantification of apparent diffusion coefficient (ADC) on diffusion imaging (n = 8 glioma patients) in ipsi- and contralateral CC, (two-sided Mann-Whitney-Test, shown as median +/- quartile, whiskers: min/max within 1.5 IQR and data points). c Axial MR image showing fractional anisotropy map in a glioma-infiltrated mouse brain (left) showing the CC as a region of interest (red) which is transformed out of the tract (d). Right: Zoom in CC (PDX model: S24). d Tracts of the body of CC, extracted from respective DTI image stacks and transformed into ROIs. e Mean fractional anisotropy (FA), mean diffusivity (MD) and axial diffusivity (AD), in mice MRI scans at multiple time points in CC. (n = 42 MR acquisitions (26 days (n = 5), 33 days (n = 7), 60 days (n = 12) and 73 days (n = 13) after injection)). f Regions with and without tumor infiltration analyzed in the CC. mGFP and source THG signal post-processed with denoising. g Morphological parameter (circularity) of tumor-infiltrated holes and non-infiltrated holes (n = 27 cells from n = 3 experiments in 3 mice in 2 PDX models (S24 and T269), two-sided Mann-Whitney test, shown as median +/- quartile, whiskers: min/max within 1.5 IQR). h Left: CC fibers in tumor-infiltrated regions compared to non-infiltrated regions. Images post-processed with denoising. Right: The orientation plot of fibers is shown. i Comparison of orientation of brain tumor free tissue with tumor-infiltrated regions. (n = 29 sample regions from n = 8 mice (S24 and T269), two-sided Mann-Whitney test, shown as median +/- quartile, whiskers: min/max within 1.5 IQR). j White matter displacing (left) and non-displacing (right) GBMC somata and TMs. Arrowheads show tumor-infiltrated-holes. Asterisks show a soma and a TM and their location in the corresponding THG signal showing no displacement. Images post-processed with denoising. k Comparison of a portion of displacing TMs to displacing GBMC somata (n = 33 GBMC somata and n = 22 TMs from n = 4 mice in 2 PDX models (S24 and T269), two-sided Mann–Whitney test, shown as median +/- quartile, whiskers: min/max within 1.5 IQR). Source data provided as Source Data file.

References

    1. Drumm, M. R. et al. Extensive brainstem infiltration, not mass effect, is a common feature of end-stage cerebral glioblastomas. Neuro Oncol.22, 470–479 (2020). 10.1093/neuonc/noz216 - DOI - PMC - PubMed
    1. Sahm, F. et al. Addressing diffuse glioma as a systemic brain disease with single-cell analysis. Arch. Neurol.69, 523–526, (2012). 10.1001/archneurol.2011.2910 - DOI - PubMed
    1. Venkataramani, V. et al. Glioblastoma hijacks neuronal mechanisms for brain invasion. Cell185, 2899–2917 e2831 (2022). 10.1016/j.cell.2022.06.054 - DOI - PubMed
    1. Garofano, L. et al. Pathway-based classification of glioblastoma uncovers a mitochondrial subtype with therapeutic vulnerabilities. Nat. Cancer2, 141–156 (2021). 10.1038/s43018-020-00159-4 - DOI - PMC - PubMed
    1. Neftel, C. et al. An integrative model of cellular states, plasticity, and genetics for glioblastoma. Cell178, 835–849 e821 (2019). 10.1016/j.cell.2019.06.024 - DOI - PMC - PubMed

Publication types

LinkOut - more resources