. 2024 Sep 10;15(1):7914.
doi: 10.1038/s41467-024-52336-z.

A mouse protozoan boosts antigen-specific mucosal IgA responses in a specific lipid metabolism- and signaling-dependent manner

Affiliations

A mouse protozoan boosts antigen-specific mucosal IgA responses in a specific lipid metabolism- and signaling-dependent manner

Yanbo Kou et al. Nat Commun. .

Abstract

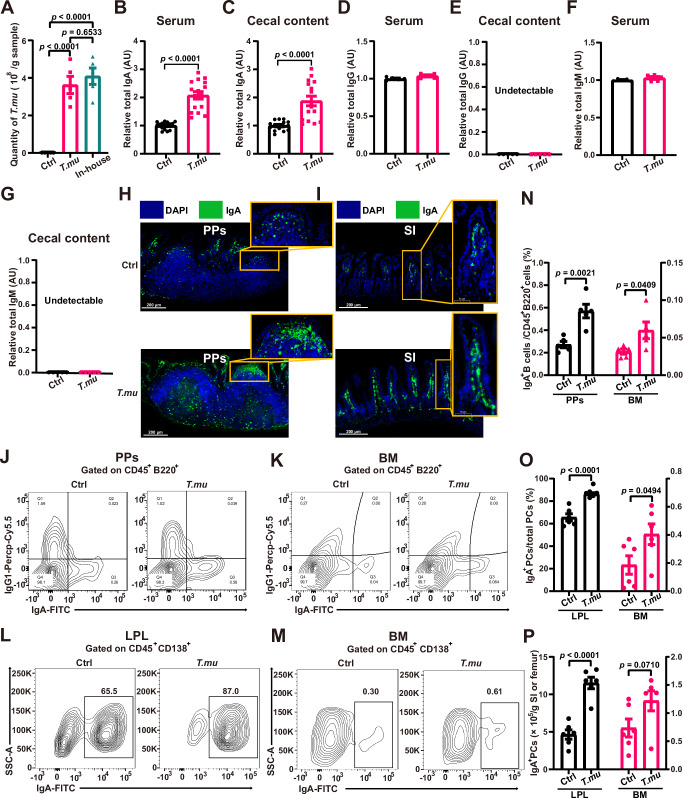
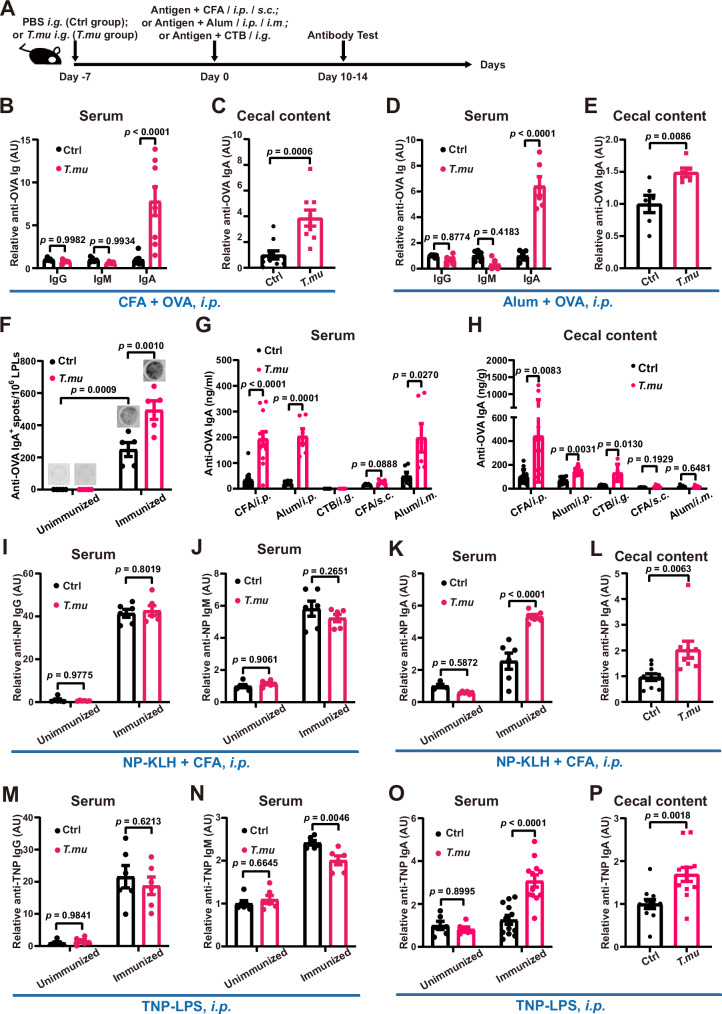
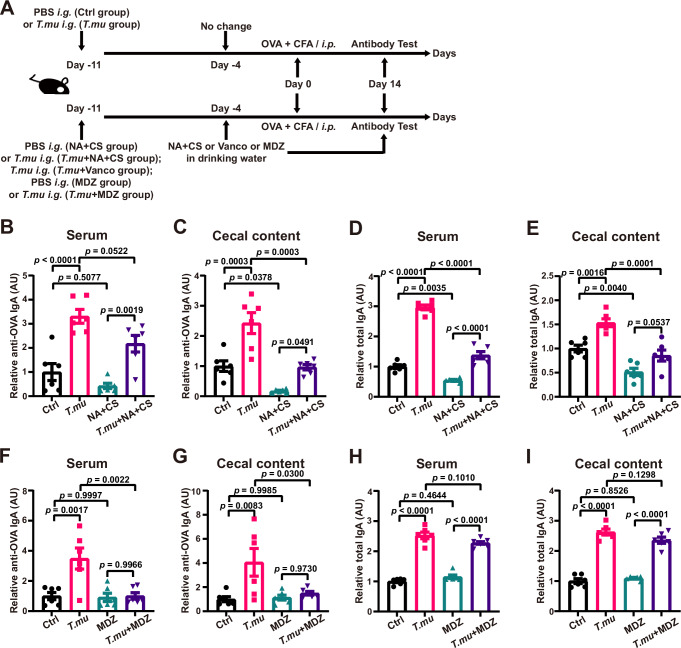
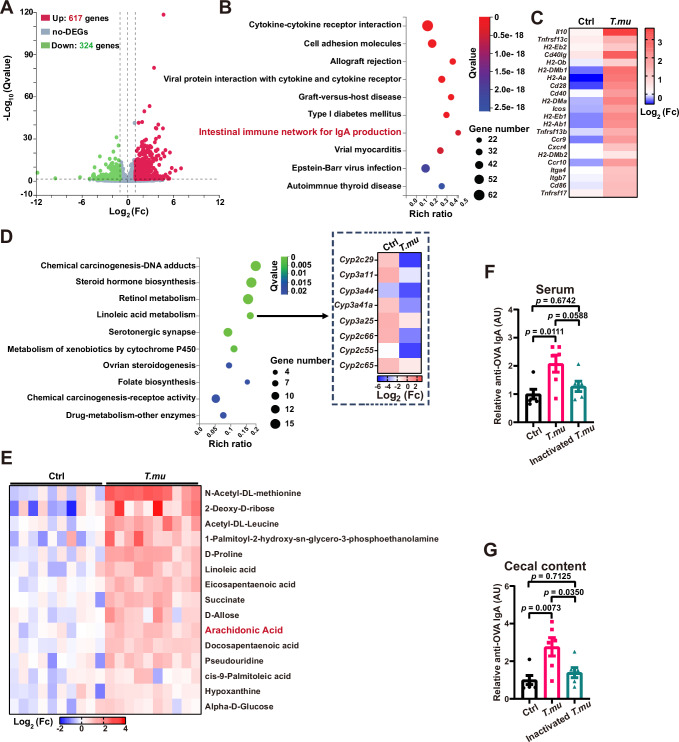
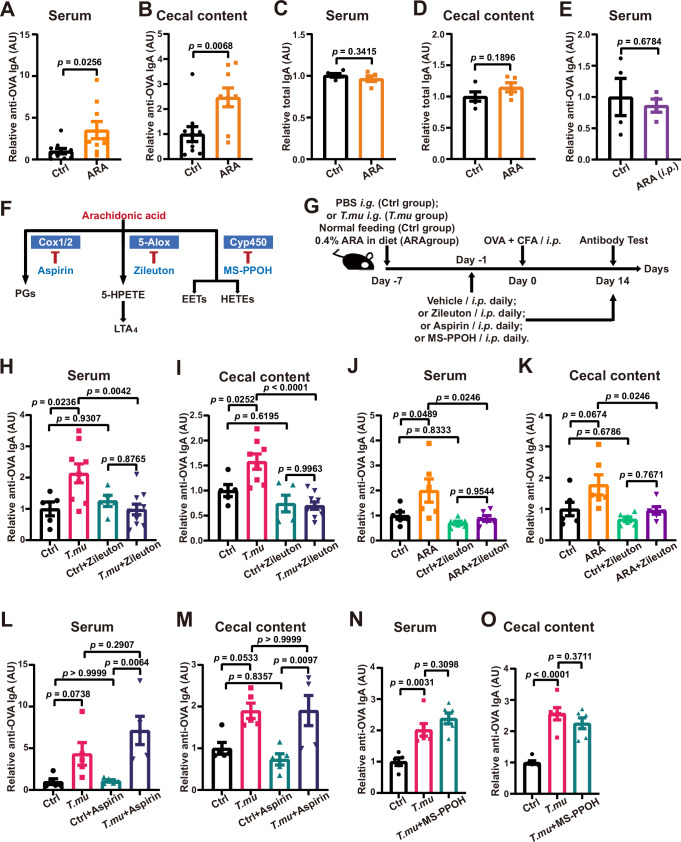
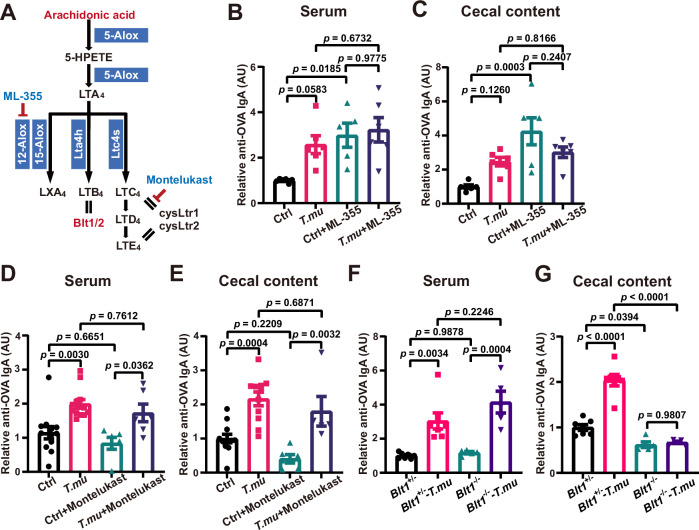
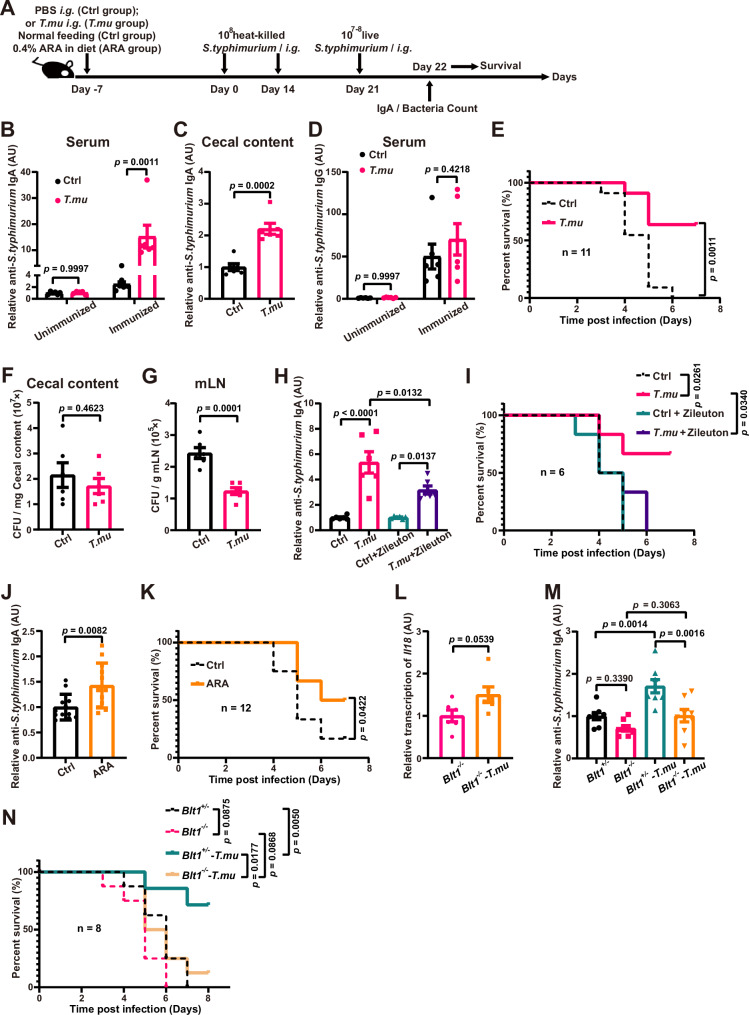
IgA antibodies play an important role in mucosal immunity. However, there is still no effective way to consistently boost mucosal IgA responses, and the factors influencing these responses are not fully understood. We observed that colonization with the murine intestinal symbiotic protozoan Tritrichomonas musculis (T.mu) boosted antigen-specific mucosal IgA responses in wild-type C57BL/6 mice. This enhancement was attributed to the accumulation of free arachidonic acid (ARA) in the intestinal lumen, which served as a signal to stimulate the production of antigen-specific mucosal IgA. When ARA was prevented from undergoing its downstream metabolic transformation using the 5-lipoxygenase inhibitor zileuton or by blocking its downstream biological signaling through genetic deletion of the Leukotriene B4 receptor 1 (Blt1), the T.mu-mediated enhancement of antigen-specific mucosal IgA production was suppressed. Moreover, both T.mu transfer and dietary supplementation of ARA augmented the efficacy of an oral vaccine against Salmonella infection, with this effect being dependent on Blt1. Our findings elucidate a tripartite circuit linking nutrients from the diet or intestinal microbiota, host lipid metabolism, and the mucosal humoral immune response.


Conflict of interest statement

The authors declare no competing interests.

Figures

Fig. 1
Fig. 1. T.mu colonization increased host total IgA levels.
T.mu isolated from our in-house B6 mice was used to inoculate VRL B6 mice via oral gavage (1 × 106 T.mu protozoa/mouse; referred to as the T.mu group). The control group was orally gavaged with an equal volume of PBS (referred to as the Ctrl group). A The number of T.mu protozoa in the cecal content 7 days post T.mu transfer was quantified using a hemocytometer (n = 5 mice/group). For comparison, the number of T.mu present in our in-house reared animals is also shown. B, C The relative total IgA levels present in serum (B) and cecal content (C) 7 days post T.mu transfer (n = 16 mice per group). DG The relative levels of total IgG (D, E) and IgM (F, G) in the serum and cecal content of the indicated animals (n = 5 mice/group). H Immunofluorescent staining of IgA (green) and DAPI (blue) in the Peyer’s Patches (PPs) of control and T.mu-colonized mice (n = 5 mice/group). Scale bar: 200 μm; inset = 50 µm. I Immunofluorescent staining of IgA (green) and DAPI (blue) in the distal part of the small intestine of the control and T.mu-colonized mice (n = 5 mice/group). DAPI stains the nuclei in the animal cells. Scale bar: 100 μm. JP Flow cytometry analysis of the IgA+B220+ B cell fractions among total CD45+B220+ B cells in the PPs (J, N) of the small intestine and bone marrow (BM) of the femur bone (K, N), and the IgA+CD138+ plasma cells among total CD45+CD138+ plasma cells in the lamina propria of the small intestine (LPL) (L, O, P) and BM (M, O, P) from the control and T.mu-colonized mice (n = 5 mice/group) in (J, K, N). n = 6 mice/group in (L, M, O, P). All data are shown as mean ± SEM. One-way ANOVA with Tukey’s post hoc test (A) or two-sided Student’s t-test (BG, NP) was performed. AU arbitrary unit. Source data are provided as a Source Data file.
Fig. 2
Fig. 2. T.mu colonization boosted antigen-specific IgA response.
A Schematic of the experimental setup. B, C The relative levels of serum (B) and cecal content (C) anti-OVA Igs after intraperitoneal immunization of the control and T.mu-colonized mice with OVA plus CFA for 14 days (n = 5 mice/group for IgG/IgM, n = 10 mice for IgA in Ctrl group and n = 9 mice in T.mu group). D, E The relative levels of anti-OVA Igs in serum (D) and cecal content (E) after intraperitoneal immunization of the control and T.mu-colonized mice with OVA plus Alum for 10 days (n = 6 mice/group). F The numbers of anti-OVA IgA+ plasma cells were determined by ELISPOT assay after intraperitoneal immunization of control and T.mu-colonized mice with OVA plus CFA for 14 days (n = 5 mice/group). G, H The concentrations of serum (G) and cecal content (H) anti-OVA IgA after the indicated route (i.p., intraperitoneal; i.g., intragastric; s.c., subcutaneous; i.m., intramuscular) of immunization of the control and T.mu-colonized mice with OVA plus CFA, Alum, or CTB (n = 12 mice/group for CFA i.p., n = 6 mice/group for Alum i.p. and i.m., n = 5 mice/group for CTB i.g. and CFA s.c.). IL The relative levels of serum (IK) and cecal content (L) anti-NP Igs after intraperitoneal immunization of the control and T.mu-colonized mice with the TD antigen NP-KLH plus CFA for 14 days (n = 6 mice/group) in (IK). n = 10 mice for Ctrl and 9 for T.mu group in (L). MP The relative levels of serum (MO) and cecal content (P) anti-TNP Igs after intraperitoneal immunization of the control and T.mu-colonized mice with the TI antigen TNP-LPS (n = 6 mice/group for IgG/IgM, n = 6 mice/group for unimmunized IgA and n = 12 mice/group for immunized IgA). All data are shown as mean ± SEM. Two-way ANOVA with Sidak’s multiple comparisons test (B, D, F, IK, and MO) or two-sided Student’s t-test (C, E, G, H, L, and P) were performed. AU arbitrary unit. Source data are provided as a Source Data file.
Fig. 3
Fig. 3. The role of T.mu and the gut bacterial microbiota in the T.mu-colonization-induced increase of antigen-specific IgA responses.
A Schematic of the experimental setup for T.mu colonization, antibiotics treatment, and antigen immunization. NA nalidixic acid, CS colistin sulfate, Vanco vancomycin, MDZ metronidazole. BE The relative levels of serum anti-OVA IgA (B), cecal content anti-OVA IgA (C), serum total IgA (D), and cecal content total IgA (E) of control (Ctrl) and T.mu-colonized mice with or without NA+CS treatments were determined 14 days after intraperitoneal immunization (n = 6 mice/group). FI The relative levels of serum anti-OVA IgA (F), cecal content anti-OVA IgA (G), serum total IgA (H), and cecal content total IgA (I) of the indicated mice treated or nontreated with MDZ were determined 14 days after immunization (n = 6 mice/group). All data are shown as mean ± SEM. One-way ANOVA with Tukey’s post hoc test (BI) was performed. AU arbitrary unit. Source data are provided as a Source Data file.
Fig. 4
Fig. 4. T.mu colonization induces a favorable intestinal niche for IgA production.
A Volcano plots depicting the differentially expressed genes (DEGs) in the small intestine of the T.mu-colonized mice compared to the control mice. Red = log2 fold change > 1, green = log2 fold change < −1. B KEGG pathway enrichment analysis based on all genes that were upregulated in the small intestine of T.mu-colonized mice. Top 10 KEGG pathways are shown based on enrichment score. C Heatmap depicting all the upregulated genes involved in regulating IgA production (fold change > 2). D KEGG pathway enrichment analysis based on all genes with down-regulated expression in the small intestine of T.mu-colonized mice. Top 10 KEGG pathways are shown based on enrichment score. Genes involved in linoleic acid metabolism were also listed (right panel) (n = 5 mice/group for AD). E Untargeted metabolomic analysis of the cecal content of control and T.mu-colonized mice. Heatmap depicting all the upregulated metabolites in T.mu-colonized mice compared to control mice. Arachidonic acid is highlighted in bold red (n = 10 mice/group). F, G Heat-inactivated T.mu (2 × 108 /mouse) was inoculated into VRL B6 mice once every other day via oral gavage. On day 7, mice were immunized with OVA plus CFA, intraperitoneally. The relative levels of serum (F) and cecal content (G) anti-OVA IgA were determined 14 days after immunization (n = 6 mice/group). All data are shown as mean ± SEM. One-way ANOVA with Tukey’s post hoc test (F, G) was performed. AU arbitrary unit. Source data are provided as a Source Data file.
Fig. 5
Fig. 5. Intestinal luminal arachidonic acid enhances antigen-specific IgA production.
AD Groups of VRL B6 mice were fed either with a control diet (Ctrl group) or an ARA-supplemented diet (ARA group) [0.4% (v/w)] for 7 days and then intraperitoneally immunized once with OVA mixed with CFA on day 7. The relative levels of serum and cecal content anti-OVA (A and B, n = 10 mice in the Ctrl group and 9 mice in the ARA group) and total (C and D, n = 5 mice/group) IgA were determined on day 21. E Groups of VRL B6 mice were treated daily with vehicle or ARA (20 mg /day) intraperitoneally. On day 7, mice were immunized once with OVA plus CFA. The relative levels of serum anti-OVA IgA were determined on day 21 (n = 4 mice/group). F Schematic of the three major arachidonic acid metabolic pathways. G Schematic of the experimental setup for T.mu colonization or dietary ARA supplementation, selective inhibitors administration, and antigen challenge. HK The effect of zileuton on the relative levels of serum (H, J) and cecal content (I, K) anti-OVA IgA 14 days post antigen challenge (n = 5 mice/group for Ctrl and Ctrl+Zileuton groups in (H) and (I), n = 9 mice for T.mu group and n = 10 mice for T.mu+Zileuton groups in (H) and (I). n = 6 mice/group in J and K). L, M The effect of aspirin on the relative levels of serum (L) and cecal content (M) anti-OVA IgA 14 days post antigen challenge (n = 5 mice/group). N, O The effect of MS-PPOH on the relative levels of serum (N) and cecal content (O) anti-OVA IgA 14 days post antigen challenge (n = 6 mice/group). All data are shown as mean ± SEM. Two-sided Student’s t-test (AE) or One-way ANOVA with Tukey’s post hoc test (HO) were performed. AU arbitrary unit. Source data are provided as a Source Data file.
Fig. 6
Fig. 6. T.mu colonization enhances mucosal antigen-specific IgA production in a Blt1-dependent manner.
A Schematic of arachidonic acid lipoxygenase (Lox) pathway. BE Groups of mice were administered once with either PBS (Ctrl) or T.mu via the oral route on day 0. From day 6 and thereafter, the mice were treated with vehicle, ML-355 (B, C), or Montelukast (D, E) once daily by oral gavage. On day 7, the mice were intraperitoneally challenged with OVA plus CFA. The relative levels of serum (B, D) and cecal content (C, E) anti-OVA IgA were determined on day 21 (n = 6 mice/group) in (B) and (C). n = 12 mice/group for Ctrl and T.mu groups in (D) and (E), and n = 6 mice/group for Ctrl+Montelukast and T.mu+Montelukast groups in (D) and (E). F, G Groups of Blt1−/− and the littermate Blt1+/− mice were orally administered once with either PBS or T.mu on day 0. On day 7, the mice were intraperitoneally challenged with OVA plus CFA. The relative levels of serum (F) and cecal content (G) anti-OVA IgA were determined on day 21 (n = 7 mice/group for Blt1+/− and Blt1+/−-T.mu groups, n = 5 mice/group for Blt1−/− and Blt1−/−-T.mu groups). Data are shown as mean ± SEM. One-way ANOVA with Tukey’s post hoc test (BG) was performed. AU arbitrary unit. Source data are provided as a Source Data file.
Fig. 7
Fig. 7. T.mu colonization enhanced the effectiveness of an oral vaccine against a mucosal pathogen.
A Schematic of the experimental setup for (AK). BD The relative levels of serum (B) and cecal content (C) IgA or serum IgG (D) 3 weeks after the introduction of the heat-inactivated S. Typhimurium vaccine (n = 6 mice/group). E Survival curve (n = 11 mice/group). F, G S. Typhimurium colony-forming units (CFU) in the cecal content (F) and mLN (G) 24 h post-infection (n = 6 mice/group). H, I The mice were treated intraperitoneally with vehicle or zileuton once daily from day 1. H The relative levels of serum IgA were determined 3 weeks after the first dose of vaccine. I Survival curve (n = 6 mice/group). J, K Groups of mice (n = 12 mice/group) were fed with either a control diet or an ARA-supplemented diet from day 7 and treated with heat-inactivated S. Typhimurium vaccine orally on day 0 and day 14, followed by live S. Typhimurium challenge. J The relative levels of serum IgA were determined 3 weeks after the first dose of vaccine. K Survival curve. LN Blt1−/− mice and the littermate controls (Blt1+/− mice) were colonized with T.mu, 1 week later were vaccinated with heat-inactivated S. Typhimurium, and two more weeks later injected the second dose of vaccine. 7 days after the second vaccination, mice were challenged with live S. Typhimurium. L The colonic transcription of Il18 two days after infection was determined by qRT-PCR (n = 6 mice/group). M The fecal anti-S. Typhimurium IgA titers 8 days after the second vaccination (n = 8 mice/group). N Survival curve (n = 8 mice/group). All data are shown as mean ± SEM. Log-rank (Mantel-Cox) test (E, I, K, and N), Two-way ANOVA with Sidak’s multiple comparisons test (B and D), or One-way ANOVA with Tukey’s post hoc test (H and M), or two-sided Student’s t-test (C, F, G, J and L) were performed. AU arbitrary unit. Source data are provided as a Source Data file.

Similar articles

Cited by

References

    1. Sterlin, D. et al. IgA dominates the early neutralizing antibody response to SARS-CoV-2. Sci. Transl. Med.13, eabd2223 (2021). 10.1126/scitranslmed.abd2223 - DOI - PMC - PubMed
    1. Wang, Z. et al. Enhanced SARS-CoV-2 neutralization by dimeric IgA. Sci. Transl. Med.13, eabf1555 (2021). 10.1126/scitranslmed.abf1555 - DOI - PMC - PubMed
    1. Liew, F. Y., Russell, S. M., Appleyard, G., Brand, C. M. & Beale, J. Cross-protection in mice infected with influenza A virus by the respiratory route is correlated with local IgA antibody rather than serum antibody or cytotoxic T cell reactivity. Eur. J. Immunol.14, 350–356 (1984). 10.1002/eji.1830140414 - DOI - PubMed
    1. Asahi-Ozaki, Y. et al. Secretory IgA antibodies provide cross-protection against infection with different strains of influenza B virus. J. Med. Virol.74, 328–335 (2004). 10.1002/jmv.20173 - DOI - PubMed
    1. Okuya, K. et al. Potential role of nonneutralizing IgA antibodies in cross-protective immunity against influenza A viruses of multiple hemagglutinin subtypes. J. Virol.94, e00408–20 (2020). 10.1128/JVI.00408-20 - DOI - PMC - PubMed

Publication types

LinkOut - more resources