. 2024 Sep 10;15(1):7908.
doi: 10.1038/s41467-024-52192-x.

Lethal Borna disease virus 1 infections of humans and animals - in-depth molecular epidemiology and phylogeography

Affiliations

Lethal Borna disease virus 1 infections of humans and animals - in-depth molecular epidemiology and phylogeography

Arnt Ebinger et al. Nat Commun. .

Abstract

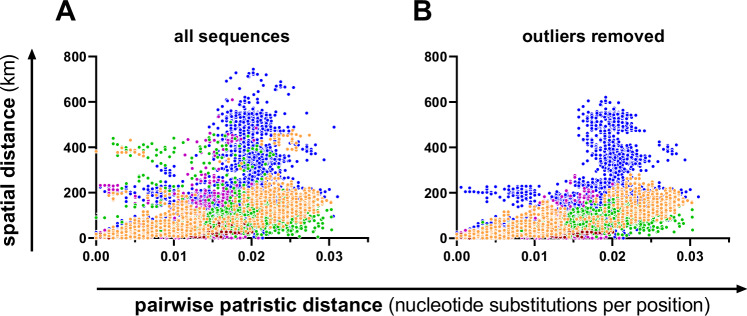
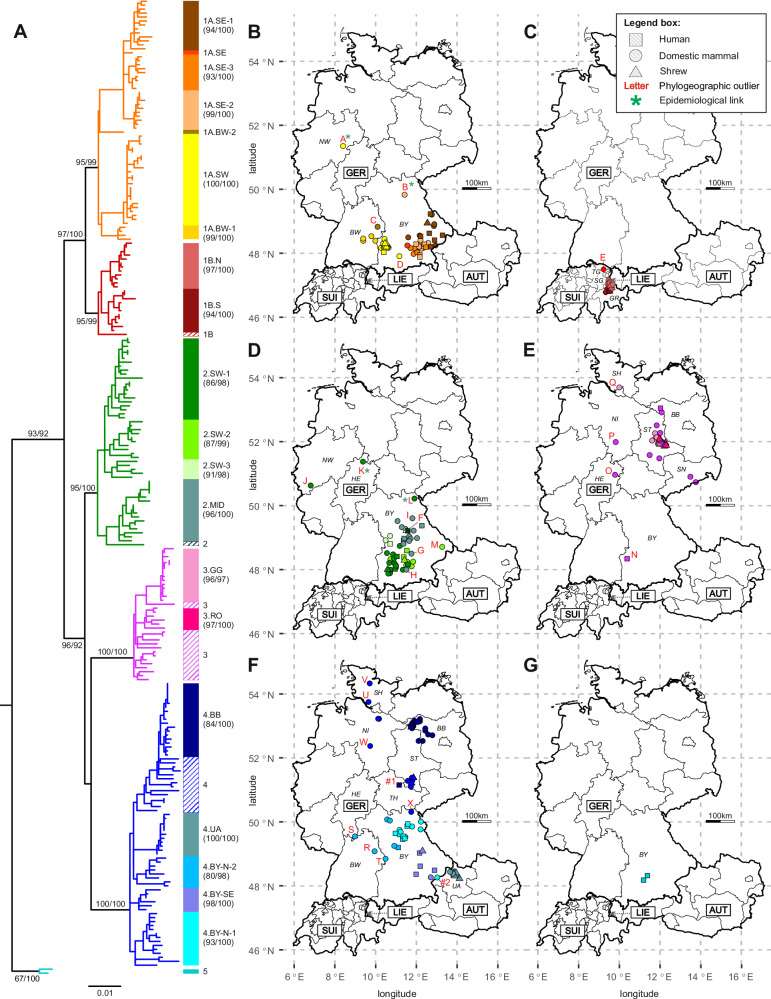
Borna disease virus 1 (BoDV-1) is the causative agent of Borna disease, a fatal neurologic disorder of domestic mammals and humans, resulting from spill-over infection from its natural reservoir host, the bicolored white-toothed shrew (Crocidura leucodon). The known BoDV-1-endemic area is remarkably restricted to parts of Germany, Austria, Switzerland and Liechtenstein. To gain comprehensive data on its occurrence, we analysed diagnostic material from suspected BoDV-1-induced encephalitis cases based on clinical and/or histopathological diagnosis. BoDV-1 infection was confirmed by RT-qPCR in 207 domestic mammals, 28 humans and seven wild shrews. Thereby, this study markedly raises the number of published laboratory-confirmed human BoDV-1 infections and provides a first comprehensive summary. Generation of 136 new BoDV-1 genome sequences from animals and humans facilitated an in-depth phylogeographic analysis, allowing for the definition of risk areas for zoonotic BoDV-1 transmission and facilitating the assessment of geographical infection sources. Consistent with the low mobility of its reservoir host, BoDV-1 sequences showed a remarkable geographic association, with individual phylogenetic clades occupying distinct areas. The closest genetic relatives of most human-derived BoDV-1 sequences were located at distances of less than 40 km, indicating that spill-over transmission from the natural reservoir usually occurs in the patient´s home region.


Conflict of interest statement

The authors declare no competing interests.

Figures

Fig. 1
Fig. 1. Geographic location of analysed cases and BoDV-1 sequences.
A Origin of suspected or confirmed cases of Borna disease from domestic mammals and humans and of BoDV-1-infected shrews submitted for analysis. Grey symbols represent cases confirmed by BoDV-1-specific RT-qPCR in this study. Yellow symbols represent cases without a positive RT-qPCR result. The federal states (Germany, Austria) and cantons (Switzerland) coloured in light grey represent the assumed endemic regions based on previously published work,,,,,. B Geographic locations of BoDV-1 sequences originating from this study (dark colours) or previously published cases (light colours). Colours represent phylogenetic BoDV-1 clusters and subclusters as determined in Figs. 2 and 3A and Supplementary Fig. 5. Grey symbols represent cases confirmed by BoDV-1-specific RT-qPCR in this study without available sequence. C Visualisation of endemic regions of BoDV-1 clusters and subclusters by Kernel Density Estimation (KDE). The analysis is based on 214 BoDV-1 sequences with available location. Sequences classified as phylogenetic outliers (no additional sequence with at least 98.6% nucleotide sequence identity within a maximal distance of 37.9 km) were excluded from the analysis. D Cluster-independent BoDV-1 endemic region visualised by KDE. Only sequences meeting the criteria described for panel C) were included. Germany (GER): BB Brandenburg, BE Berlin, BY Bavaria, BW Baden‐Wuerttemberg, HE Hesse, NI Lower Saxony, NW North Rhine-Westphalia, SH Schleswig-Holstein, SN Saxony, ST Saxony‐Anhalt, TH Thuringia; Switzerland (SUI): BE Bern, FR Fribourg, GE Geneva, GR Grisons, NW Nidwalden, SG St. Gall, TG Thurgau, ZH Zurich; Austria (AUT): UA Upper Austria, VA Vorarlberg; Liechtenstein (LIE).
Fig. 2
Fig. 2. Phylogenetic analysis of complete coding BoDV-1 genome sequences.
A maximum likelihood tree (model SYM + G4) was calculated for all 90 complete coding BoDV-1 sequences (genome positions 54 to 8822) of human and animal origin. Sequence BoDV-2 No/98 (AJ311524; not shown) was used to root the tree. Sequences generated during this study are depicted in bold. Statistical support is shown for major branches, using the format “SH-aLRT/ultrafast bootstrap”. Clusters 2 to 5 and subclusters 1A and 1B are indicated by coloured branches and bars. Germany (GER): BB Brandenburg, BY Bavaria, BW Baden‐Wuerttemberg, NI Lower Saxony, SH Schleswig-Holstein, SN Saxony, ST Saxony‐Anhalt; Switzerland (SUI): GR Grisons; Austria (AUT): UA Upper Austria. Phylogenetic tree in Newick format is provided in Supplementary Data 2.
Fig. 3
Fig. 3. Illustration of pairwise spatial versus phylogenetic distances.
Pairwise patristic distances were inferred from the maximum likelihood (ML) tree of N-X/P nucleotide sequences (Fig. 4A and Supplementary Fig. 5) and plotted against pairwise spatial distances. A Results of all 238 N-X/P nucleotide sequences with available locations. B Results of 214 N-X/P sequences after removal of the 24 sequences that were categorised as phylogeographic outliers using the following criteria: existence of no other BoDV-1 N-X/P sequence with ≥98.6% nucleotide sequence identity within a distance of ≤37.9 km. Colours represent the phylogenetic clusters 2 to 5 and subclusters 1A and 1B (see Fig. 2). Only pairwise comparisons within clusters or subclusters are depicted in this figure. A detailed presentation of the analysis is shown in Supplementary Fig. 8.
Fig. 4
Fig. 4. Detailed phylogeographic analysis of BoDV-1 clusters and subclusters.
A A maximum likelihood (model GTR + F + I + G4) tree was calculated for 246 partial BoDV-1 sequences (1,824 nucleotides, nt) of human and animal origin that are covering the complete N, X and P genes (genome positions 54 to 1877). Sequence BoDV-2 No/98 (AJ311524; not displayed) was used to root the tree. Statistical support is shown for main branches (including clusters, subclusters, and subclades), using the format “SH-aLRT/ultrafast bootstrap”. Clusters 2 to 5 and subclusters 1A and 1B are indicated by coloured branches. Subclades are indicated by coloured bars and corresponding text labels, with statistical support of subclades shown in brackets. BG Spatial distribution of subclusters 1 A (B) and 1B (C) and clusters 2 (D), 3 (E), 4 (F) and 5 (G). Colours of the symbols represent the phylogenetic subclades indicated in panel A). Human sequences are generally mapped no more precise than to the centre of the district of the patient´s residence. Red labels represent phylogeographic outliers (capital letters; Supplementary Table 3) or additional cases with potentially aberrant infection site (#1 and #2; Supplementary Table 4). Green asterisks indicate known epidemiologic links into the dispersal area of the respective subclade. Germany (GER): BB Brandenburg, BY Bavaria, BW Baden‐Wuerttemberg, HE Hesse, NI Lower Saxony, NW North Rhine-Westphalia, SH Schleswig-Holstein, SN Saxony, ST Saxony‐Anhalt, TH Thuringia; Switzerland (SUI): GR Grisons, SG St. Gall, TG Thurgau; Austria (AUT): UA Upper Austria; Liechtenstein (LIE). Subclade designations: GG Güterglück, MID Middle, N North, S South, RO Rosslau, SE Southeast, SW Southwest.
Fig. 5
Fig. 5. Geographic distance of human BoDV-1 sequences to their closest phylogenetic relatives.
The minimal distance to the most closely related BoDV-1 nucleotide (nt) sequence was identified for all human BoDV-1 sequences with available geographic information (n = 39) based on patristic distances calculated from the maximum likelihood (ML) tree of 246 N-X/P nt sequences (Supplementary Fig. 5). Sequences without available location as well as non-human sequences classified as phylogeographic outliers (Supplementary Table 3) were excluded from the analysis. For each human sequence, the minimal spatial distance was calculated to all sequences with a patristic distance of up to 1.2-fold the patristic distance to the phylogenetically closest relative. Colours of the dots represent phylogenetic clusters and subclusters as defined in Fig. 2. Red capital letters indicate human cases identified as phylogeographic outliers (Supplementary Table 3). Sequence Z21_0139 (labelled as #1) is suspected to have an aberrant infection site due to its close genetic relation to animal sequences in more than 200 km distance (Supplementary Table 4). Broken horizontal lines represent the 90th percentile (39.8 km) and the median (15.6 km) of the presented dataset. The black line represents the linear regression of genetic and geographic distance. Slope and goodness of fit (R2) of the regression line are provided.

References

    1. Dürrwald, R., Nowotny, N., Beer, M. & Kuhn JH. Clinical Virology (eds Richman D. D., Whitley R. J., Hayden F. G.). 4th edn. (American Society for Microbiology, 2016).
    1. Richt, J. A. & Rott, R. Borna disease virus: a mystery as an emerging zoonotic pathogen. Vet. J.161, 24–40 (2001). 10.1053/tvjl.2000.0533 - DOI - PubMed
    1. Staeheli, P., Sauder, C., Hausmann, J., Ehrensperger, F. & Schwemmle, M. Epidemiology of Borna disease virus. J. Gen. Virol.81, 2123–2135 (2000). 10.1099/0022-1317-81-9-2123 - DOI - PubMed
    1. Weissenböck, H. et al. Infections of horses and shrews with bornaviruses in Upper Austria: a novel endemic area of Borna disease. Emerg. Microbes Infect.6, e52 (2017). 10.1038/emi.2017.36 - DOI - PMC - PubMed
    1. Rubbenstroth, D. et al. ICTV virus taxonomy profile: Bornaviridae. J. Gen. Virol.102, 001613 (2021). 10.1099/jgv.0.001613 - DOI - PMC - PubMed

Publication types

MeSH terms