. 2024 Sep 10;15(1):7928.
doi: 10.1038/s41467-024-52139-2.

Genomic and immune heterogeneity of multiple synchronous lung adenocarcinoma at different developmental stages

Affiliations

Genomic and immune heterogeneity of multiple synchronous lung adenocarcinoma at different developmental stages

Yue Zhao et al. Nat Commun. .

Abstract

Multiple synchronous lung cancers (MSLCs) constitute a unique subtype of lung cancer. To explore the genomic and immune heterogeneity across different pathological stages of MSLCs, we analyse 16 MSLCs from 8 patients using single-cell RNA-seq, single-cell TCR sequencing, and bulk whole-exome sequencing. Our investigation indicates clonally independent tumours with convergent evolution driven by shared driver mutations. However, tumours from the same individual exhibit few shared mutations, indicating independent origins. During the transition from pre-invasive to invasive adenocarcinoma, we observe a shift in T cell phenotypes characterized by increased Treg cells and exhausted CD8+ T cells, accompanied by diminished cytotoxicity. Additionally, invasive adenocarcinomas exhibit greater neoantigen abundance and a more diverse TCR repertoire, indicating heightened heterogeneity. In summary, despite having a common genetic background and environmental exposure, our study emphasizes the individuality of MSLCs at different stages, highlighting their unique genomic and immune characteristics.


Conflict of interest statement

The authors declare the following competing interests: K.L. has the following disclosures (all outside of the submitted work): patent on indel burden and CPI response pending, patent on ctDNA minimal residual disease calling methods; speaker fees from Roche tissue diagnostics and Ellipses pharma; research funding from CRUK TDL/Ono/LifeArc alliance and Genesis Therapeutics; and consulting roles with Monopteros Therapeutics, Kynos Therapeutics and Tempus Labs, Inc. M.A. is supported by the City of London Centre Clinical Academic Training Programme (Year 3, SEBSTF-2021\100007). All the other authors declare no competing interests.

Figures
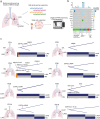
Fig. 1
Fig. 1. Study design and mutation landscape of 8 multiple synchronous lung cancer (MSLC) patients.
a Study design. 8 multiple synchronous lung cancer (MSLC) patients were included in this study. Samples were surgically resected and were sent for bulk whole-exome sequencing (WES), single-cell RNA sequencing and single-cell TCR sequencing. b Mutations in major driver genes and tumour suppressor genes of sequenced tumours. c Intertumour heterogeneity of each MSLC patient based on mutations detected. For each individual patient, tumour location was shown on the left. A heatmap shows the mutations different tumours harboured. Maroon, mutations that were shared by the two tumours in the same patient; yellow, parallel evolution events; blue, mutations that were private in either tumour in the same patient. A phylogenetic tree was constructed for each patient demonstrating the intertumour heterogeneity. AIS adenocarcinoma in situ, MIA minimally invasive adenocarcinoma, LUAD lung adenocarcinoma. Source data are provided as a Source Data file. Figure 1/panels a and c, created with BioRender.com, released under a Creative Commons Attribution-NonCommercial-NoDerivs 4.0 International license. https://creativecommons.org/licenses/by-nc-nd/4.0/deed.en.
Fig. 2
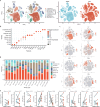
Fig. 2. Single cell landscape of multiple synchronous lung cancer (MSLC) patients.
a t-distributed stochastic neighbour embedding (t-SNE) plot of 92,032 sequenced cells. Grouping based on annotated cell types and pathology were shown on the left and right, respectively. b Expression of canonical marker genes of epithelial cells, endothelial cells, immune cells and fibroblasts; (c) t-SNE plots showing expression levels of canonical marker genes of identified cell types, with the gradient of colouring representing expression levels; (d) Bar plots showing the percentages of each annotated cell type in each individual tumour; (e) Comparison of frequency of each annotated cell type between adenocarcinoma in situ (AIS)/minimally invasive adenocarcinoma (MIA) and invasive lung adenocarcinoma (LUAD). 6 AIS/MIA and 6 LUAD samples were used to derive the two-sided paired comparisons. AIS adenocarcinoma in situ, MIA minimally invasive adenocarcinoma, LUAD lung adenocarcinoma. Source data are provided as a Source Data file.
Fig. 3
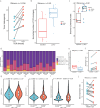
Fig. 3. Single cell copy number variation (CNV) analysis of multiple synchronous lung cancer (MSLC) patients.
a Heatmap showing the copy number variation profiles of MSLC patients. InferCNV was used to call CNV events using single-cell RNA-seq data. Colour bar indicates the proportion of cells having the CNV event. b Clonality trees were reconstructed based on CNV profiles of each tumour. Branches were scaled according to percentage of cells harbouring specific CNVs in each inferred subclone. c Comparison of CNV burden between AIS/MIA and LUAD samples, as measured by weighted genomic instability index (wGII). 6 AIS/MIA and 10 LUAD samples were used to derive the two-sided comparison. d Comparison of genomic distance between AIS/MIA and LUAD using Euclidean metrics. For each patient, intra-patient genomic distance was calculated between AIS/MIA and LUAD in the same patient (self), while inter-patient genomic distances were calculated between AIS/MIA and each LUAD in the other patients (other). 6 AIS/MIA and 10 LUAD samples were used to derive the two-sided comparison. AIS adenocarcinoma in situ, MIA minimally invasive adenocarcinoma, LUAD lung adenocarcinoma. For boxplots in this figure, the centre of the boxes indicated the median value and upper and lower bounds of the boxes indicated the 25th and 75th percentile of data. The box covers the interquartile interval and represents the area where 50% of the data were found. Whiskers went from the minimum of data to the lower bounds of the box and the upper bounds of the box to the maximum of data. The whiskers were restricted to a maximum of 1.5 times the interquartile range (IQR) and data points outside this range were considered outliers. Source data are provided as a Source Data file.
Fig. 4
Fig. 4. Clustering and comparison of T cells.
a t-SNE plot showing 35,367 T cells were further clustered and annotated into 9 subgroups. b Expression of canonical marker genes that were used to identify different subgroups of T cells. c Comparison of frequency of each T cell subgroup between AIS/MIA and LUAD samples. 6 AIS/MIA and 6 LUAD samples were used to derive the two-sided paired comparisons. d Comparison of frequency of exhausted CD8+ T cells and regulatory T cells (Treg cells) using flow cytometry. 5 MIA and 7 LUAD samples were used to derive the comparison, and two-sided Student’s t test was performed. Data were presented as mean values ± SD. e Comparison of cytotoxicity score in CD8+ T cells using single-cell RNA-seq data between AIS/MIA and LUAD samples. 3597 cells from the AIS/MIA group and 3993 cells from the LUAD group were used to derive the two-sided comparison. f Comparison of MANA score in CD8+ T cells using single-cell RNA-seq data between AIS/MIA and LUAD samples. 3597 cells from the AIS/MIA group and 3993 cells from the LUAD group were used to derive the two-sided comparison. AIS adenocarcinoma in situ, MIA minimally invasive adenocarcinoma, LUAD lung adenocarcinoma. For boxplots in this figure, the centre of the boxes indicated the median value and upper and lower bounds of the boxes indicated the 25th and 75th percentile of data. The box covers the interquartile interval and represents the area where 50% of the data were found. Whiskers went from the minimum of data to the lower bounds of the box and the upper bounds of the box to the maximum of data. The whiskers were restricted to a maximum of 1.5 times the interquartile range (IQR) and data points outside this range were considered outliers. Source data are provided as a Source Data file.
Fig. 5
Fig. 5. T cell receptor (TCR) repertoire and neoantigen prediction of multiple synchronous lung cancer (MSLC) patients.
a Comparison of tumour heterogeneity between patients with different levels of TCR diversity. 8 samples with lower TCR diversity and 8 samples with higher TCR diversity were used to derive the two-sided comparison. b Comparison of number of TCR clonotypes between AIS/MIA and LUAD samples. 6 AIS/MIA and 10 LUAD samples were used to derive the two-sided comparison. c Comparison of TCR diversity between AIS/MIA and LUAD sample, as measured by Shannon’s Diversity Index. 6 AIS/MIA and 10 LUAD samples were used to derive the two-sided comparison. d Proportion of occupied clonal space specific clonotypes across all samples. e Comparison of number of neoantigen specific TCRs between AIS/MIA and LUAD samples. 6 AIS/MIA and 10 LUAD samples were used to derive the two-sided comparison. f Comparison of number of predicted neoantigens between AIS/MIA and LUAD samples. 5 AIS/MIA and 5 LUAD samples were used to derive the paired two-sided comparison. g Comparison of MANA score between CD8+ T cells containing non-neoantigen committed and neoantigen committed TCRs. Two-sided Wilcoxon’s rank-sum test was used. h Comparison of exhaustion score between CD8+ T cells containing non-neoantigen committed and neoantigen committed TCRs. Two-sided Wilcoxon’s rank-sum test was used. i Comparison of immune checkpoint score between CD8+ T cells containing non-neoantigen committed and neoantigen committed TCRs. Two-sided Wilcoxon’s rank-sum test was used. j Comparison of the expression of genes with silent and non-silent mutations. For boxplots in this figure, the centre of the boxes indicated the median value and upper and lower bounds of the boxes indicated the 25th and 75th percentile of data. The box covers the interquartile interval and represents the area where 50% of the data were found. Whiskers went from the minimum of data to the lower bounds of the box and the upper bounds of the box to the maximum of data. The whiskers were restricted to a maximum of 1.5 times the interquartile range (IQR) and data points outside this range were considered outliers. AIS, adenocarcinoma in situ; MIA, minimally invasive adenocarcinoma; LUAD, lung adenocarcinoma; TCR, T cell receptor; MANA, mutation-associated neoantigens. Source data are provided as a Source Data file.
Fig. 6
Fig. 6. Clustering and comparison of myeloid cells and natural killer (NK) cells.
a t-SNE plot showing 10,763 myeloid cells were further clustered and annotatd into 10 subgroups. b Comparison of frequency of anti-inflammatory macrophages (top-left), proliferating macrophages (bottom-left), conventional dendritic cell (top-right) and non-classical CD16+ monocytes (bottom-right) between AIS/MIA and LUAD samples. 6 AIS/MIA and 6 LUAD samples were used to derive the paired two-sided comparisons. c t-SNE plot showing 6590 NK cells were further clustered into 2 subgroups. d Comparison of frequency of CD56dimCD16+ NK cells between AIS/MIA and LUAD samples. 6 AIS/MIA and 6 LUAD samples were used to derive the paired two-sided comparison. e Comparison of frequency of CD56dim NK cells using flow cytometry on 5 MIA and 7 LUAD samples, and two-sided Student’s t test was performed. Data are presented as mean values ± SD. AIS adenocarcinoma in situ, MIA minimally invasive adenocarcinoma, LUAD lung adenocarcinoma, NK natural killer. Source data are provided as a Source Data file.

References

    1. Sung, H. et al. Global cancer statistics 2020: GLOBOCAN estimates of incidence and mortality worldwide for 36 cancers in 185 countries. CA Cancer J. Clin.71, 209–249 (2021). 10.3322/caac.21660 - DOI - PubMed
    1. Chen, W. et al. Cancer statistics in China, 2015. CA Cancer J. Clin.66, 115–132 (2016). 10.3322/caac.21338 - DOI - PubMed
    1. Mok, T. S. et al. Gefitinib or carboplatin-paclitaxel in pulmonary adenocarcinoma. N. Engl. J. Med.361, 947–957 (2009). 10.1056/NEJMoa0810699 - DOI - PubMed
    1. Mok, T. S. et al. Osimertinib or platinum-pemetrexed in EGFR T790M-positive lung cancer. N. Engl. J. Med.376, 629–640 (2017). 10.1056/NEJMoa1612674 - DOI - PMC - PubMed
    1. Solomon, B. J. et al. First-line crizotinib versus chemotherapy in ALK-positive lung cancer. N. Engl. J. Med.371, 2167–2177 (2014). 10.1056/NEJMoa1408440 - DOI - PubMed

Publication types

MeSH terms

Substances