. 2024 Sep 10;11(1):986.
doi: 10.1038/s41597-024-03751-w.

An East Antarctic, sub-annual resolution water isotope record from the Mount Brown South Ice core

Affiliations

An East Antarctic, sub-annual resolution water isotope record from the Mount Brown South Ice core

Vasileios Gkinis et al. Sci Data. .

Abstract

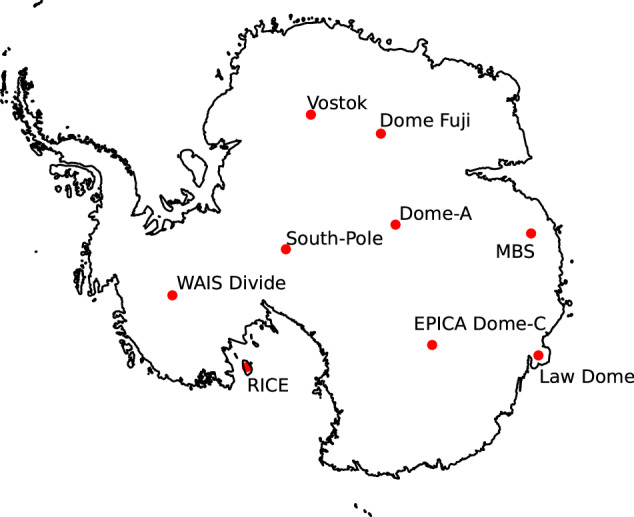
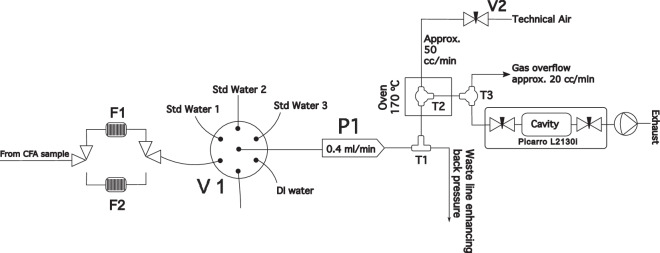
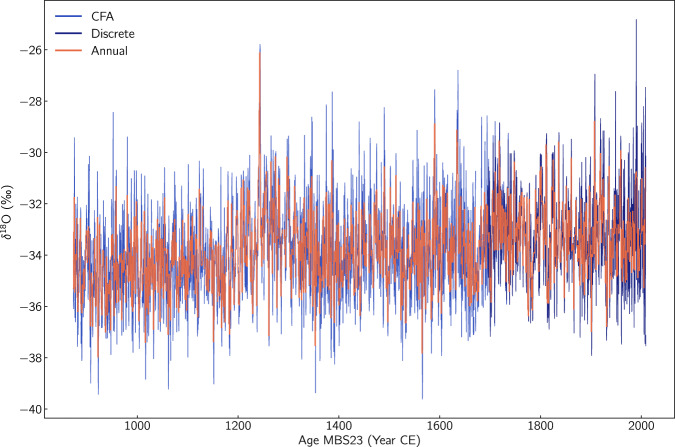
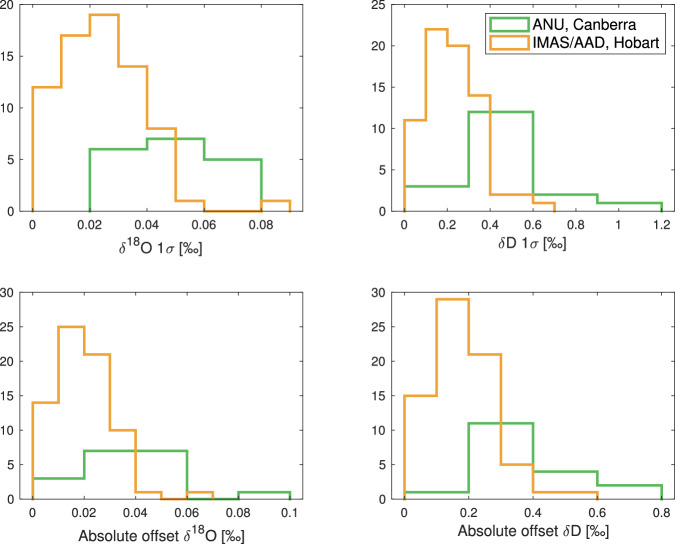
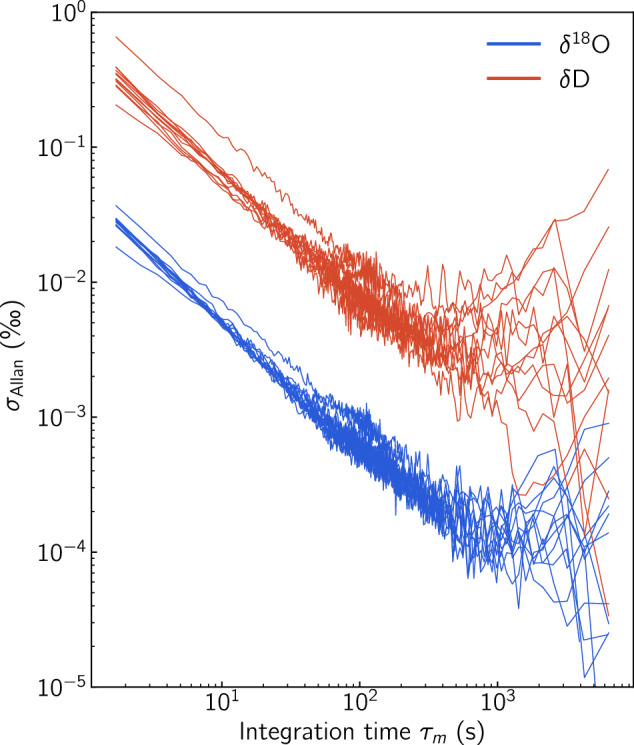
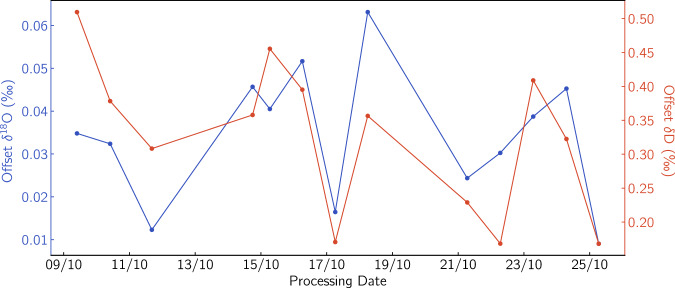
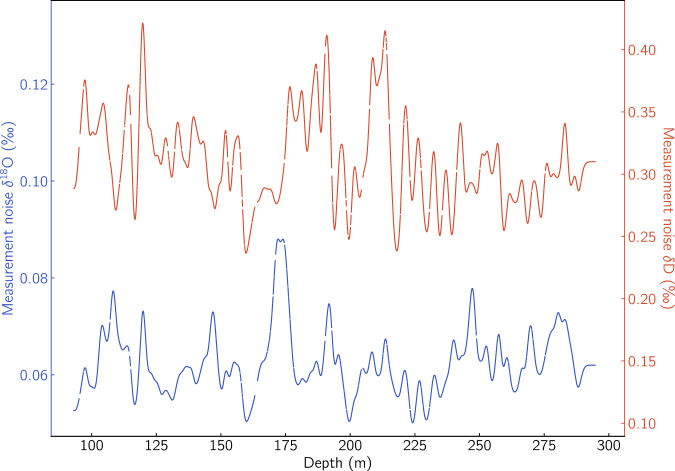
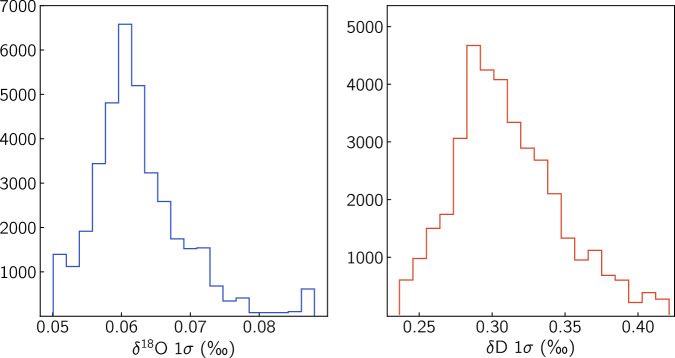
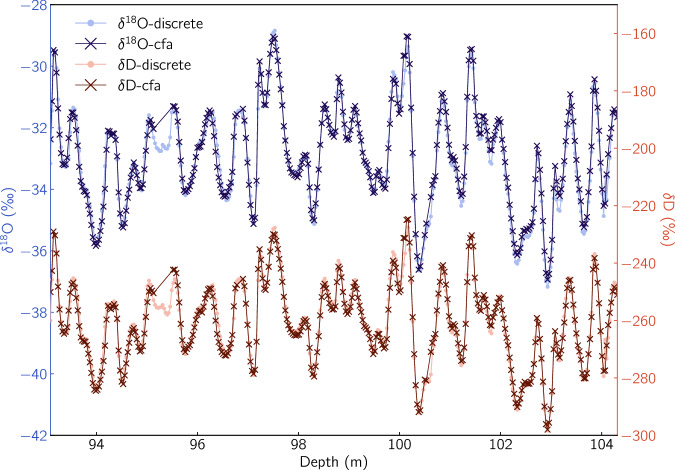
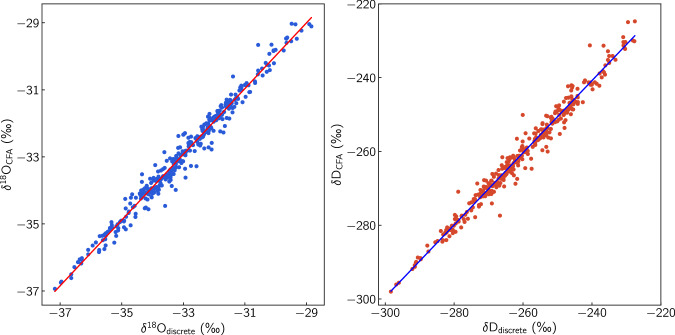
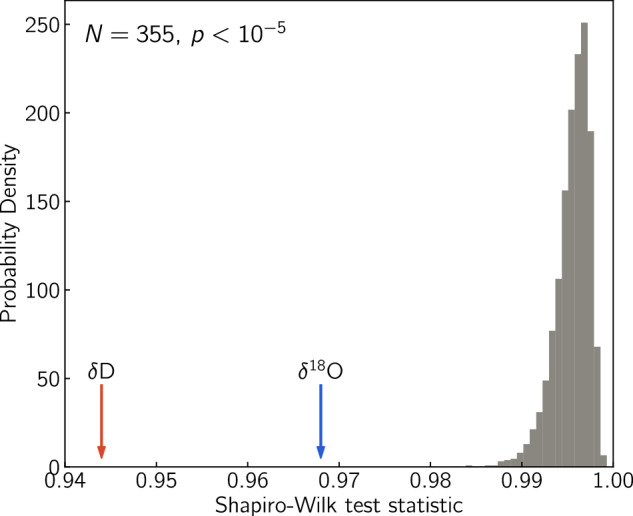
We report high resolution measurements of the stable water isotope ratios (δ18O, δD) from the Mount Brown South ice core (MBS, 69.11° S 86.31° E). The record covers the period 873 - 2009 CE with sub-annual temporal resolution. Preliminary analyses of surface cores have shown the Mount Brown South site has relatively high annual snowfall accumulation (0.3 metres ice equivalent) with a seasonal bias toward lower snowfall during austral summer. Precipitation at the site is frequently related to intense, short term synoptic scale events from the mid-latitudes of the southern Indian Ocean. Higher snowfall regimes are associated with easterly winds, while lower snowfall regimes are associated with south-easterly winds. Isotope ratios are measured with Infra-Red Cavity Ring Down Spectroscopy, calibrated on the VSMOW/SLAP scale and reported on the MBS2023 time scale interpolated accordingly. We provide estimates for measurement precision and internal accuracy for δ18O and δD.


Conflict of interest statement

The authors declare no competing interests.

Figures

Fig. 1
Fig. 1
Map of Antarctica and location of prominent ice core drilling sites.
Fig. 2
Fig. 2
Cross section of the MBS ice core showing the cutting scheme of the ice core samples.
Fig. 3
Fig. 3
Block diagram of the water isotope analysis part of the CFA system. For a complete description of the system’s components, the reader is referred to Section Methods.
Fig. 4
Fig. 4
Analysis production during the MBS CFA campaign spanning 13 working days (09/10/2019 - 25/10/2019).
Fig. 5
Fig. 5
Example of the sequence of events during an analysis day of the MBS CFA campaign. We plot the raw δD signal (left axis) and the water concentration levels in the laser spectrometers optical cavity during a period of 24 hours on the 22nd of October. The pale red, blue and yellow areas of the plot mark the IDLE, VSMOW-SLAP calibration and ice core run phases of the day. The pale green areas correspond to the time when the isotope system was on IDLE mode while the chemical analysis part of the CFA system was being calibrated.
Fig. 6
Fig. 6
δD of Run 224. The run contains the ice core bags 224-232 and spans ≈9 m. The smoothed derivative of the δD signal (blue curve) is used for the identification of the beginning and the end of the run. With solid black, we plot the run length signal as measured with the wire optical encoder and with the dashed line we show the length signal corrected for the logged internal breaks.
Fig. 7
Fig. 7
The Mount Brown South water isotope record (δ18O) as a function of time using the MBS2023 age scale.
Fig. 8
Fig. 8
Histograms of the precision (1-σ) and mean absolute offset of “check” standards for analytical run at the ANU, Canberra (green, L2140-i, N = 94) and IMAS/AAD, Hobart (orange, L2130-i, N = 400).
Fig. 9
Fig. 9
Allan standard deviation as a function of integration time for δ18O and δD. The metrics are based on the overnight Idle sections in the period 10/10/2019-25/10/2019.
Fig. 10
Fig. 10
Internal accuracy for the “check” local standard “NEEM” as estimated during the VSMOW-SLAP calibration at the beginning of each analysis day. For δ18O: 0.034 ± 0.015 ‰, and for δD: 0.32 ± 0.11‰.
Fig. 11
Fig. 11
Measurement noise of the δ18O and δD signals as a function of ice core depth estimated from the noise component of the power spectral density of the isotope signals.
Fig. 12
Fig. 12
Histograms of the CFA measurement noise in Fig. 11. δ18O: 0.063 ± 0.008 ‰, δD: 0.311 ± 0.036‰.
Fig. 13
Fig. 13
A visual comparison between the discrete and the CFA datasets for δ18O and δD. The CFA data are averaged on the resolution of the discrete sampling.
Fig. 14
Fig. 14
Correlation between the discrete and CFA averaged datasets for δ18O and δD. The correlation concerns the depth range 93-104 in which both techniques were used for the isotope analysis and is equal to 0.989 and 0.988 for δ18O and δD respectively.
Fig. 15
Fig. 15
Shapiro-Wilk normality test for the residuals between the CFA and discrete data for δ18O and δD datasets for the depth range 93-104 m. The red and blue arrow signify the value of the Shapiro-Wilk statistic for the δD and δ18O residuals respectively. The gray distribution demonstrates the results of the Monte Carlo simulation using 10000 realisations of a series with N = 355 drawn from a normal distribution. The p-value for both the δD and the δ18O residuals is <10−5 signifying that it is very unlikely that the residuals between the discrete and the CFA data series are normally distributed.

References

    1. EPICA Community Members. Eight glacial cycles from an Antarctic ice core. Nature429, 623–628, 10.1038/nature02599 (2004). 10.1038/nature02599 - DOI - PubMed
    1. EPICA Community Members. One-to-one coupling of glacial climate variability in Greenland and Antarctica. Nature444, 195–198, 10.1038/nature05301 (2006). 10.1038/nature05301 - DOI - PubMed
    1. WAIS Divide Project Members. Onset of deglacial warming in West Antarctica driven by local orbital forcing. Nature500, 440–446, 10.1038/nature12376 (2013). 10.1038/nature12376 - DOI - PubMed
    1. Van Ommen, T. D., Morgan, V. & Curran, M. A. J. Deglacial and Holocene changes in accumulation at Law Dome, East Antarctica. Annals of Glaciology39, 359–365, 10.3189/172756404781814221 (2004).10.3189/172756404781814221 - DOI
    1. Roberts, J. et al. A 2000-year annual record of snow accumulation rates for Law Dome, East Antarctica. Clim. Past11, 697–707, 10.5194/cp-11-697-2015 (2015).10.5194/cp-11-697-2015 - DOI