. 2024 Sep 10;14(1):21073.
doi: 10.1038/s41598-024-71879-1.

Selectivity analysis of diaminopyrimidine-based inhibitors of MTHFD1, MTHFD2 and MTHFD2L

Affiliations

Selectivity analysis of diaminopyrimidine-based inhibitors of MTHFD1, MTHFD2 and MTHFD2L

Vibhu Jha et al. Sci Rep. .

Abstract

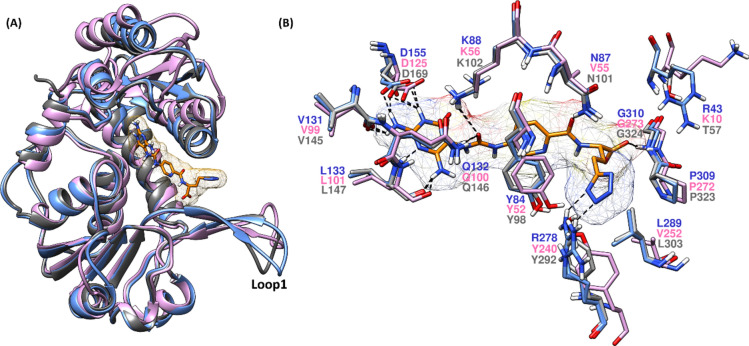
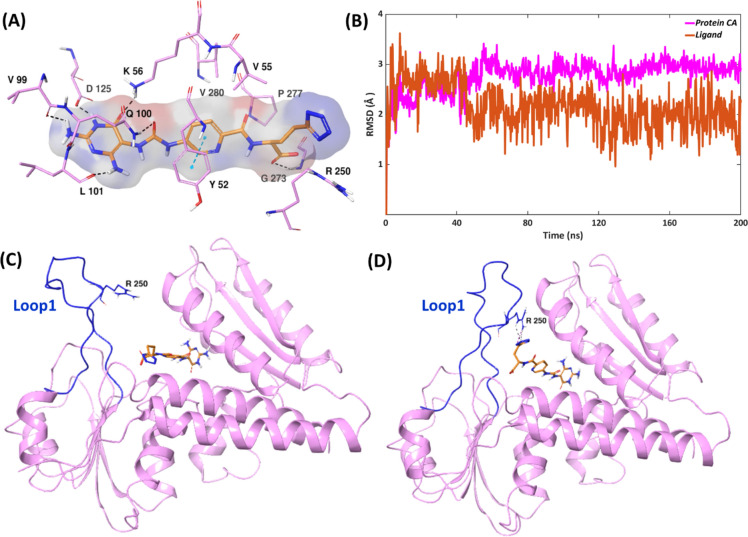
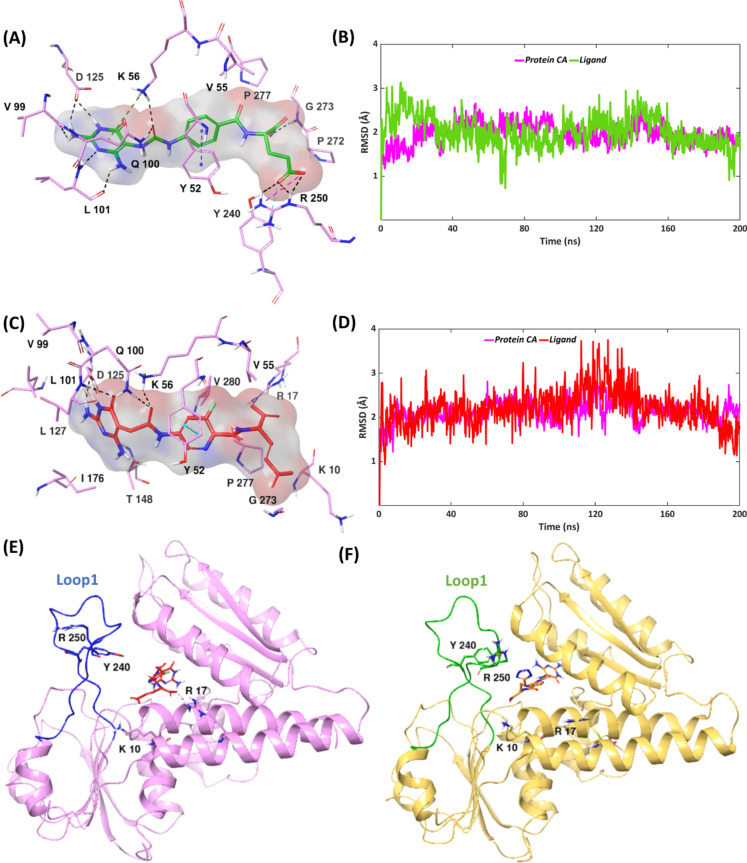
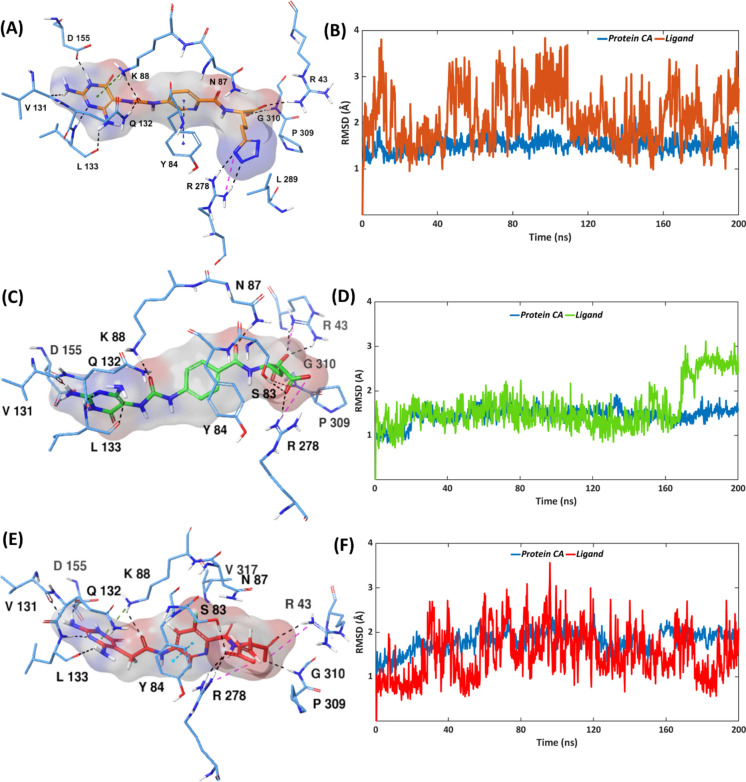
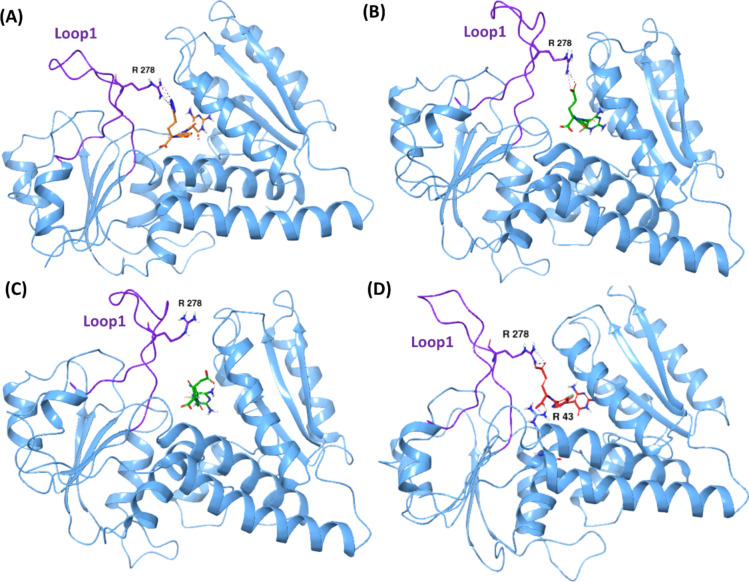
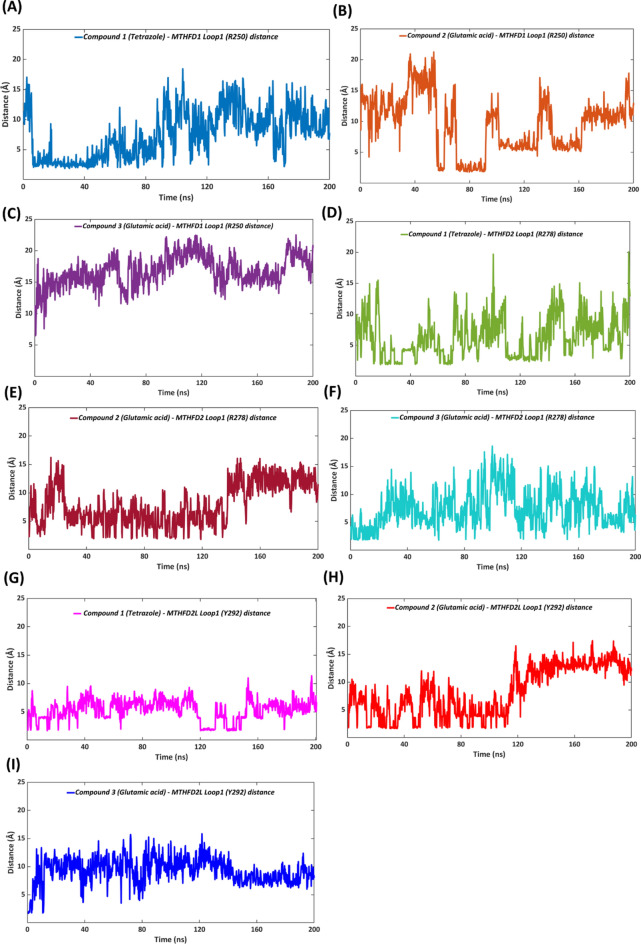
The mitochondrial enzyme methylenetetrahydrofolate dehydrogenase (MTHFD2) is involved in purine and thymidine synthesis via 1C metabolism. MTHFD2 is exclusively overexpressed in cancer cells but absent in most healthy adult human tissues. However, the two close homologs of MTHFD2 known as MTHFD1 and MTHFD2L are expressed in healthy adult human tissues and share a great structural resemblance to MTHFD2 with 54% and 89% sequence similarity, respectively. It is therefore notably challenging to find selective inhibitors of MTHFD2 due to the structural similarity, in particular protein binding site similarity with MTHFD1 and MTHFD2L. Tricyclic coumarin-based compounds (substrate site binders) and xanthine derivatives (allosteric site binders) are the only selective inhibitors of MTHFD2 reported till date. Nanomolar potent diaminopyrimidine-based inhibitors of MTHFD2 have been reported recently, however, they also demonstrate significant inhibitory activities against MTHFD1 and MTHFD2L. In this study, we have employed extensive computational modeling involving molecular docking and molecular dynamics simulations in order to investigate the binding modes and key interactions of diaminopyrimidine-based inhibitors at the substrate binding sites of MTHFD1, MTHFD2 and MTHFD2L, and compare with the tricyclic coumarin-based selective MTHFD2 inhibitor. The outcomes of our study provide significant insights into desirable and undesirable structural elements for rational structure-based design of new and selective inhibitors of MTHFD2 against cancer.

Keywords: Conformational changes; Diaminopyrimidine-based inhibitors; Molecular docking; Molecular dynamics simulation; Substrate binding site.


Conflict of interest statement

The authors declare no competing interests.

Figures

Fig. 1
Fig. 1
(A) Diaminopyrimidine-based non-selective inhibitors of MTHFD2 that bind to the substrate site (compounds 1–3, studied in this work). (B) Tricyclic coumarin-based selective inhibitors of MTHFD2 that bind to the substrate binding site (compounds 4–6). (C) Xanthine-based selective inhibitors of MTHFD2 that bind to the allosteric site (compound 7–9).
Fig. 2
Fig. 2
(A) Superposed X-ray structures of MTHFD1 (PDB code: 6ECQ, monomer A, pink ribbons), MTHFD2 (PDB code: 6S4A, monomer A, blue ribbons) and MTHFD2L (PDB code: 7QEI, monomer A, grey ribbons). Diaminopyrimidine-based inhibitor 1 (orange) is co-crystallized in the substrate binding site in 6S4A. (B) Substrate binding site residues superposed and labelled (MTHFD1—pink, MTHFD2—blue, MTHFD2L—grey), with compound 1 shown in orange.
Fig. 3
Fig. 3
(A) Representative MD structure of the MTHFD1—compound 1 complex (inhibitor in orange, protein residues in pink). (B) RMSD analysis of the MTHFD1—compound 1 complex (ligand in orange, protein α-carbons in pink) during the 200 ns simulation. Ribbon view of the MD structures of MTHFD1—compound 1 complex: (C) at 0 ns, (D) at 15 ns. MTHFD1 ribbons in pink, loop 1 in dark blue and 1 in orange.
Fig. 4
Fig. 4
Representative MD structures of (A) MTHFD1—compound 2 complex (inhibitor in green, protein residues in pink). (C) MTHFD1—compound 3 complex (inhibitor in red, protein residues in pink). RMSD analysis of (B) MTHFD1—compound 2 complex (ligand in green, protein α-carbons in pink). (D) MTHFD1—compound 3 complex (ligand in red, protein α-carbons in pink) during the 200 ns MD simulation. (E) Representative MD structure of the MTHFD1—compound 3 complex. MTHFD1 protein ribbons are shown in pink, loop 1 in dark blue and 3 in red. Compound 3 is in close proximity to Lys10 and Arg17 of the substrate binding site, but far from Tyr240 and Arg250 of loop 1. (F) Representative MD structure of the MTHFD1—compound 1 complex. MTHFD1 protein ribbons are shown in golden, loop 1 in green and 1 in orange. Compound 1 is in close proximity to Tyr240 and Arg250 of loop 1, but far from Lys10 and Arg17 of the substrate binding site.
Fig. 5
Fig. 5
Representative MD structures of (A) MTHFD2—compound 1 complex (inhibitor in orange, protein residues in blue). (C) MTHFD2—compound 2 complex (inhibitor in green, protein residues in blue). (E) MTHFD2—compound 3 complex (inhibitor in red, protein residues in blue). RMSD analysis of (B) MTHFD2—compound 1 complex (ligand in orange, protein α-carbons in blue). (D) MTHFD2—compound 2 complex (ligand in green, protein α-carbons in blue). (F) MTHFD2—compound 3 complex (ligand in red, protein α-carbons in blue) during the 200 ns simulation.
Fig. 6
Fig. 6
(A) Representative MD structure of the MTHFD2—compound 1 complex, showing H-bond with Arg278. (B) MD snapshot of the MTHFD2—compound 2 complex at 136 ns, showing H-bond with Arg278. (C) MD snapshot of the MTHFD2—compound 2 complex at 175 ns, showing no H-bond with Arg278. (D) Representative MD structure of the MTHFD2—compound 3 complex, showing H-bond with Arg43 and Arg278. MTHFD2 ribbons are shown in blue, loop 1 in purple, compound 1 in orange, 2 in green and 3 in red.
Fig. 7
Fig. 7
Representative MD structures of (A) MTHFD2L—compound 1 complex (inhibitor in orange, protein residues in grey). (C) MTHFD2L—compound 2 complex (inhibitor in green, protein residues in grey). (E) MTHFD2L—compound 3 complex (inhibitor in red, protein residues in grey). RMSD analysis of (B) MTHFD2L—compound 1 complex (ligand in orange, protein α-carbons in grey). (D) MTHFD2L—compound 2 complex (ligand in green, protein α-carbons in grey). (F) MTHFD2L—compound 3 complex (ligand in red, protein α-carbons in grey) during the 200 ns simulation.
Fig. 8
Fig. 8
Distance of the tetrazole unit of 1 with: (A) Arg250 of MTHFD1 loop 1 (blue), (D) Arg278 of MTHFD2 loop 1 (green), and (G) Tyr292 of MTHFD2L loop 1 (magenta) over the course of 200 ns MD simulation. Distance of the glutamic acid unit of 2 with: (B) Arg250 of MTHFD1 loop 1 (orange), (E) Arg278 of MTHD2 loop 1 (brown), and (H) Tyr292 of MTHFD2L loop 1 (red). Distance of the glutamic acid unit of 3 with: (C) Arg250 of MTHFD1 loop 1 (violet), (F) Arg278 of MTHD2 loop 1 (cyan), and (I) Tyr292 of MTHFD2L loop 1 (dark blue).
Fig. 9
Fig. 9
(A) Ribbon view: X-ray structure of MTHFD2 in complex with diaminopyrimidine-based inhibitor 1 (protein ribbons in blue, loop 1 in dark blue, compound 1 in orange, PDB code: 6S4A), superposed with the X-ray structure of MTHFD2 in complex with tricyclic coumarin-based inhibitor 5 (protein ribbons in purple, loop 1 in red, compound 5 in light green, PDB code: 6KG2). (B) Binding site view: compound 1 in orange, 5 in light green and the MTHFD2 residues (6S4A) in blue.

References

    1. Gustafsson, R. et al. Crystal structure of the emerging cancer target MTHFD2 in complex with a substrate-based inhibitor. Cancer Res.77, 937–948 (2017). 10.1158/0008-5472.CAN-16-1476 - DOI - PubMed
    1. Liu, F. et al. Increased MTHFD2 expression is associated with poor prognosis in breast cancer. Tumor Biol.35, 8685–8690 (2014).10.1007/s13277-014-2111-x - DOI - PubMed
    1. Ju, H.-Q. et al. Modulation of redox homeostasis by inhibition of MTHFD2 in colorectal cancer: Mechanisms and therapeutic implications. J. Natl. Cancer Inst.111, 584–596 (2019). 10.1093/jnci/djy160 - DOI - PMC - PubMed
    1. Pikman, Y. et al. Targeting MTHFD2 in acute myeloid leukemia. J. Exp. Med.213, 1285–1306 (2016). 10.1084/jem.20151574 - DOI - PMC - PubMed
    1. Bonagas, N. et al. Pharmacological targeting of MTHFD2 suppresses acute myeloid leukemia by inducing thymidine depletion and replication stress. Nat. Cancer3, 156–172 (2022). 10.1038/s43018-022-00331-y - DOI - PMC - PubMed

MeSH terms

LinkOut - more resources