. 2024 Sep 10;4(1):175.
doi: 10.1038/s43856-024-00605-9.

Lipidomic biomarkers in plasma correlate with disease severity in adrenoleukodystrophy

Affiliations

Lipidomic biomarkers in plasma correlate with disease severity in adrenoleukodystrophy

Yorrick R J Jaspers et al. Commun Med (Lond). .

Abstract

Background: X-linked adrenoleukodystrophy (ALD) is a neurometabolic disorder caused by pathogenic variants in ABCD1 resulting very long-chain fatty acids (VLCFA) accumulation in plasma and tissues. Males can present with various clinical manifestations, including adrenal insufficiency, spinal cord disease, and leukodystrophy. Female patients typically develop spinal cord disease and peripheral neuropathy. Predicting the clinical outcome of an individual patient remains impossible due to the lack of genotype-phenotype correlation and predictive biomarkers.

Methods: The availability of a large prospective cohort of well-characterized patients and associated biobank samples allowed us to investigate the relationship between lipidome and disease severity in ALD. We performed a lipidomic analysis of plasma samples from 24 healthy controls, 92 male and 65 female ALD patients.

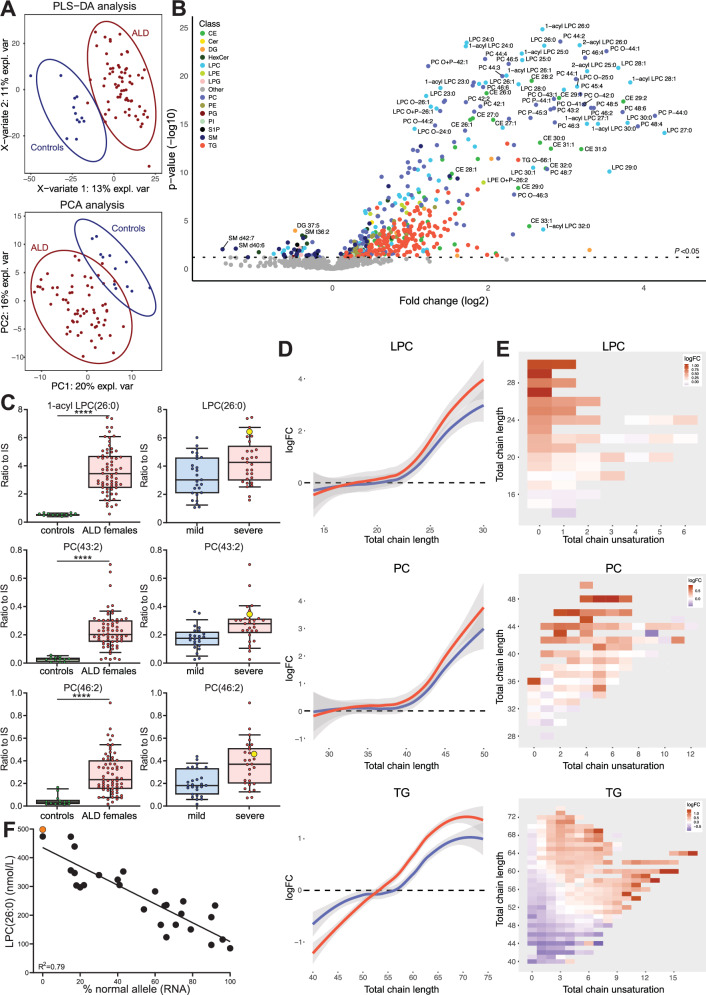
Results: Here we show that VLCFA are incorporated into different lipid classes, including lysophosphatidylcholines, phosphatidylcholines, triglycerides, and sphingomyelins. Our results show a strong association between higher levels of VLCFA-containing lipids and the presence of leukodystrophy, adrenal insufficiency, and severe spinal cord disease in male ALD patients. In female ALD patients, VLCFA-lipid levels correlate with X-inactivation patterns in blood mononuclear cells, and higher levels are associated with more severe disease manifestations. Finally, hematopoietic stem cell transplantation significantly reduces, but does not normalize, plasma C26:0-lysophosphatidylcholine levels in male ALD patients. Our findings are supported by the concordance of C26:0-lysophosphatidylcholine and total VLCFA analysis with the lipidomics results.

Conclusions: This study reveals the profound impact of ALD on the lipidome and provides potential biomarkers for predicting clinical outcomes in ALD patients.

Plain language summary

X-linked adrenoleukodystrophy (ALD) affects the brain, spinal cord, and adrenal glands. ALD is caused by too many very long-chain fatty acids (VLCFAs) in the body. We don’t know how ALD progresses in individual patients. We have analyzed blood samples from male and female ALD patients. We found that certain changes in fatty acid (or lipid) composition are associated with more severe symptoms. Our findings may lead to new ways to predict which symptoms are likely to change over time and to monitor the effectiveness of treatment. This research increases our understanding of ALD and may improve patient care in the future.


Conflict of interest statement

The authors declare no competing interests.

Figures

Fig. 1
Fig. 1. Lipidomics analysis of male ALD patients versus controls.
Lipidomics analysis of plasma samples from 92 male ALD patients and 12 healthy male controls. A Partial least squares discriminant analysis (PLS-DA) and principal component analysis (PCA) analysis. B Volcano plot of lipid levels. The vertical axis shows the p-value (−log10) from Welch’s t-tests between ALD and controls, and the horizontal axis shows the fold change (log2) between ALD and controls. Colored dots are lipids with a p-value < 0.05. C Box plots (whiskers are determined using Tukey) of elevated lipids in ALD compared to controls. D Trend lines showing log fold change (logFC) and total chain length of lysophosphatidylcholine (LPC), phosphatidylcholine (PC), and triglyceride (TG) lipids in ALD compared to controls. E Heatmap showing log fold change, total chain unsaturation, and chain length for LPC, PC, and TG. Welch’s t-test or Mann–Whitney U test was used to determine significant differences between groups (****P ≤ 0.0001).
Fig. 2
Fig. 2. Correlation of the lipidome with the presence of cerebral ALD.
Lipidomics analysis of plasma samples from patients with cerebral ALD (CALD) (n = 24) and patients without CALD (noCALD) (all ages, n = 68). A Volcano plot of lipid levels. The vertical axis shows the p-value (−log10) from Welch’s t-tests between CALD (n = 24) and noCALD (all ages, n = 68), and the horizontal axis the fold change (log2) between CALD and noCALD (all ages). Colored dots are lipids with a p-value < 0.05. B Box plots (whiskers are determined using Tukey) of elevated lipid levels in CALD compared to noCALD (all ages), and noCALD >55 years (n = 21) are shown. Yellow dots on the graph represent patients who were sampled both before and after the onset of CALD (n = 3). C Trend lines showing log fold change (logFC) and total chain length of lysophosphatidylchloline (LPC), phosphatidylcholine (PC), and triglyceride (TG) lipids comparing patient groups with controls (CALD: red, noCALD all ages: blue, noCALD >55: green). D Heatmap showing the log fold change, total chain unsaturation, and chain length for LPC, PC, and TG when CALD is compared to noCALD (all ages). Welch’s t-test or Mann–Whitney U test was used to determine significant differences between groups (**P ≤ 0.01; ***P ≤ 0.001), (****P ≤ 0.0001).
Fig. 3
Fig. 3. Correlation of the lipidome with the presence of adrenal insufficiency.
Lipidomics analysis of plasma samples from patients with adrenal insufficiency (AI) (n = 50) and patients without AI (NoAI) (all ages, n = 42). A Volcano plot of lipid levels. The vertical axis shows the p-value (−log10) from Welch’s t-tests between AI and NoAI, and the horizontal axis shows the fold change (log2) between AI and noAI (all ages). Colored dots are lipids with a p-value of <0.05. B Box plots (whiskers are determined using Tukey) of elevated lipid levels in AI compared to noAI (all ages), and noAI >55 years (n = 20) are shown. C Trend lines showing log fold change (logFC) and total chain length of LPC, PC, and TG lipids when comparing patient groups to controls (AI: red, noAI all ages: blue, noAI >55: green). D Heatmap showing log fold change, total chain unsaturation, and chain length for lysophosphatidylcholine (LPC), phosphatidylcholine (PC), and triglyceride (TG) when AI is compared to noAI (all ages). Welch’s t-test or Mann–Whitney U test was used to determine significant differences between groups (***P ≤ 0.001), (****P ≤ 0.0001).
Fig. 4
Fig. 4. Correlation of the lipidome with the presence of severe spinal cord disease.
Lipidomics analysis of plasma samples from patients with mild (EDSS≤6) spinal cord disease aged >55 years (n = 17) and severe (EDSS>6) spinal cord disease (n = 15) patients. A Volcano plot of lipid levels. The vertical axis shows the p-value (−log10) from Welch’s t-tests between mild and severe patients, and the horizontal axis shows the fold change (log2) between mild and severe patients. Colored dots are lipids with a p-value of <0.05. B Box plots (whiskers are determined using Tukey) of elevated lipid levels in severe compared to mild are illustrated. C Trend lines showing log fold change (logFC) and total chain length of lysophosphatidylcholine (LPC), phosphatidylcholine (PC), and triglyceride (TG) lipids when comparing patient groups to controls (severe: red, mild: green). D Heatmap showing log fold change, total chain unsaturation, and chain length for LPC, PC, and TG when severe is compared to mild. Welch’s t-test or Mann–Whitney U test was used to determine significant differences between groups (*P ≤ 0.05).
Fig. 5
Fig. 5. Lipidomics analysis of female ALD patients versus controls.
Lipidomics analysis of plasma samples from 65 female ALD patients and 12 healthy female controls. A Partial least squares discriminant analysis (PLS-DA) and principal component analysis (PCA) analysis. B Volcano plot of lipid levels. The vertical axis shows the p-value (−log10) from Welch’s t-tests between female ALD patients and controls, and the horizontal axis shows the fold change (log2) between female ALD patients and controls. Colored dots are lipids with a p-value < 0.05. C Box plots (whiskers are determined using Tukey) of lipids that are elevated in female ALD patients compared to controls and are associated with spinal cord disease severity. D Trend lines illustrating the log fold change (logFC) and total chain length of lysophosphatidylcholine (LPC), phosphatidylcholine (PC), and triglyceride (TG) lipids when patient groups are compared to controls (severe: red, mild: blue). E Heatmap showing the log fold change, total chain unsaturation, and chain length for LPC, PC, and TG when the severe group was compared to the mild group. F Linear correlation between plasma LPC(26:0) levels and the X-inactivation in female ALD patients (n = 28, Pearson correlation coefficient: 0.79). Orange dot represents the female patient with cerebral ALD. Welch’s t-test or Mann–Whitney U test was used to determine significant differences between groups (**P ≤ 0.01; ****P ≤ 0.0001).
Fig. 6
Fig. 6. Targeted analysis of LPC(26:0) and C26:0 in plasma.
A Box plots (whiskers are determined using Tukey) of plasma C26:0-lysophosphatidylcholine (LPC(26:0)) concentrations for different patient groups (male ALD patients n = 112, female ALD patients n = 66). Male patients with cerebral ALD (CALD) (n = 25), patients without CALD (noCALD) (all ages, n = 71), noCALD >55 years (n = 21), patients with adrenal insufficiency (AI) (n = 53) and patients without AI (NoAI) (all ages, n = 43), noAI >55 years (n = 20), patients with mild (EDSS≤6) spinal cord disease aged >55 years (n = 17) and patients with severe (EDSS > 6) spinal cord disease (n = 15). Female patients with mild (EDSS ≤ 6) spinal cord disease aged >55 years (n = 27) and patients with severe (EDSS>6) spinal cord disease (n = 29). Yellow dots represent female patients (n = 2) with cerebral ALD. B Plasma LPC(26:0) concentration and age of 1090 controls. C Box plots (whiskers are determined using Tukey) of plasma LPC(26:0) concentration of 12 male CALD patients who underwent hematopoietic stem cell transplantation (HCT) at baseline and at different time points after the procedure. Each color represents a different patient. D Plasma C26:0 concentrations for different patient groups. The yellow dot represents the female patient with cerebral ALD. E Linear correlation between plasma LPC(26:0) and C26:0 concentrations (Spearman rank correlation coefficient of 0.7). Welch’s t-test or Mann–Whitney U test was used to determine significant differences between groups (*P ≤ 0.05; **P ≤ 0.01; ***P ≤ 0.001; ****P ≤ 0.0001).

References

    1. Hubbard, W. C. et al. Newborn screening for X-linked adrenoleukodystrophy (X-ALD): validation of a combined liquid chromatography-tandem mass spectrometric (LC-MS/MS) method. Mol. Genet. Metab.97, 212–220 (2009). 10.1016/j.ymgme.2009.03.010 - DOI - PubMed
    1. Mallack, E. J., Gao, K., Engelen, M. & Kemp, S. Structure and function of the ABCD1 variant database: 20 years, 940 pathogenic variants, and 3400 cases of adrenoleukodystrophy. Cells11, 283 (2022). 10.3390/cells11020283 - DOI - PMC - PubMed
    1. Mosser, J. et al. Putative X-linked adrenoleukodystrophy gene shares unexpected homology with ABC transporters. Nature361, 726–730 (1993). 10.1038/361726a0 - DOI - PubMed
    1. Singh, I., Moser, A. E., Moser, H. W. & Kishimoto, Y. Adrenoleukodystrophy: impaired oxidation of very long chain fatty acids in white blood cells, cultured skin fibroblasts, and amniocytes. Pediatr. Res.18, 286–290 (1984). 10.1203/00006450-198403000-00016 - DOI - PubMed
    1. Kemp, S. & Wanders, R. Biochemical aspects of X-linked adrenoleukodystrophy. Brain Pathol.20, 831–837 (2010). 10.1111/j.1750-3639.2010.00391.x - DOI - PMC - PubMed

LinkOut - more resources