. 2024 Sep 10;14(1):21154.
doi: 10.1038/s41598-024-72088-6.

Endurance exercise-induced histone methylation modification involved in skeletal muscle fiber type transition and mitochondrial biogenesis

Affiliations

Endurance exercise-induced histone methylation modification involved in skeletal muscle fiber type transition and mitochondrial biogenesis

Jialin Li et al. Sci Rep. .

Abstract

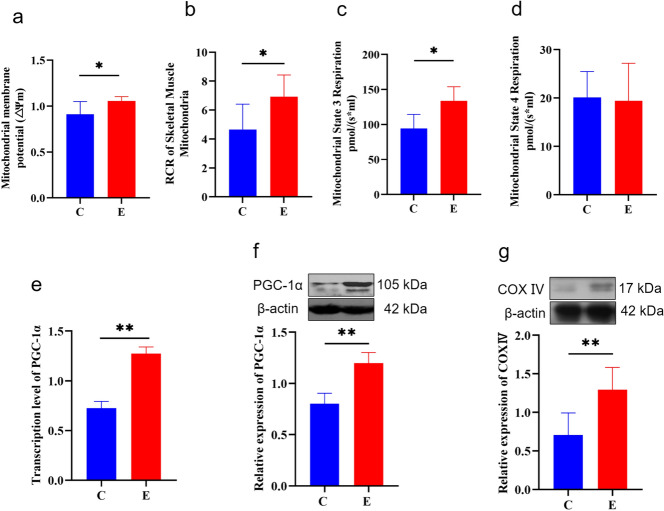
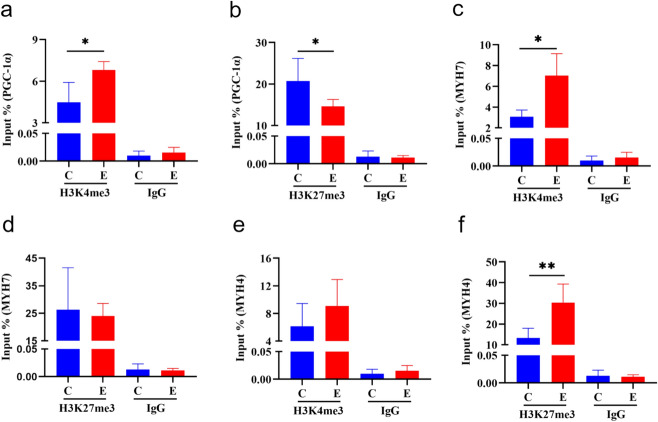
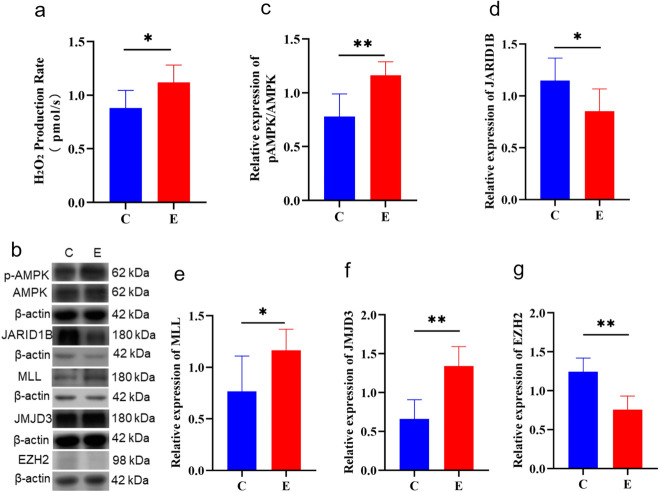
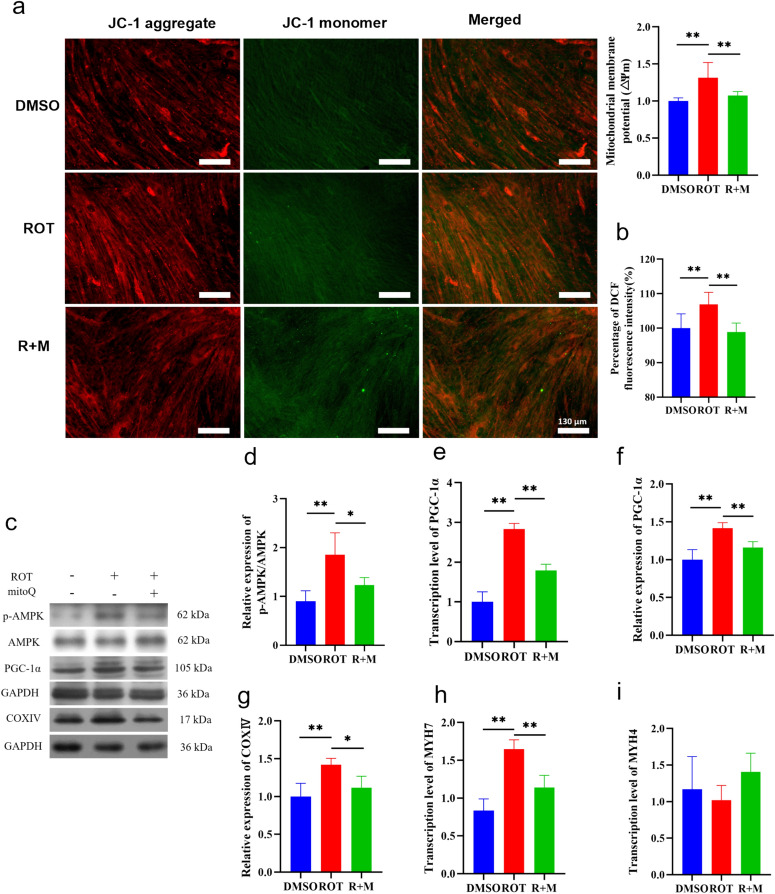
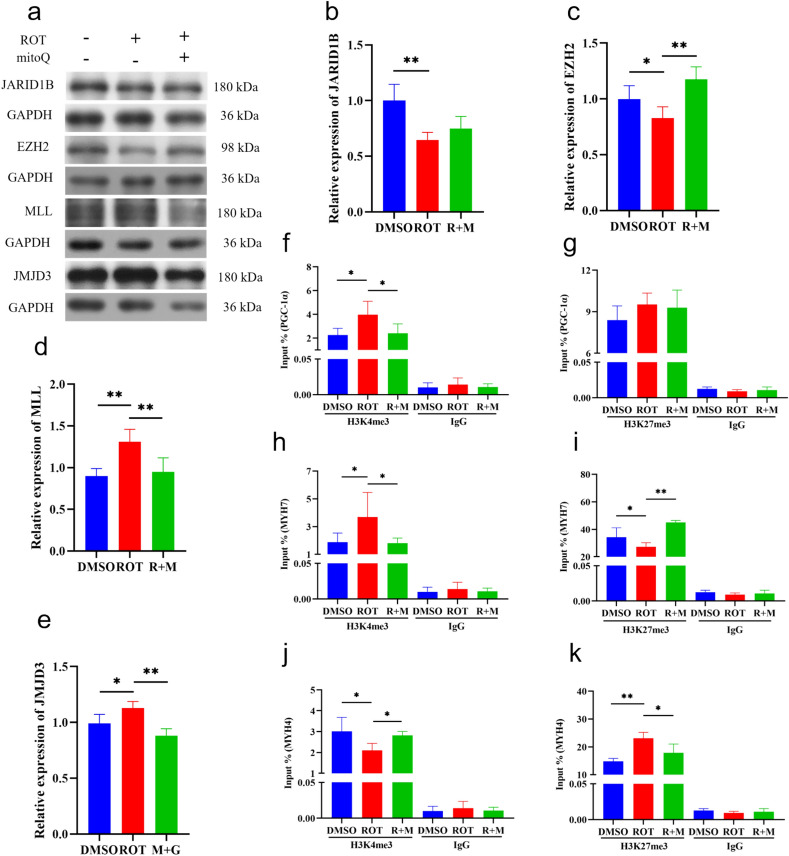
Skeletal muscle is a highly heterogeneous tissue, and its contractile proteins are composed of different isoforms, forming various types of muscle fiber, each of which has its own metabolic characteristics. It has been demonstrated that endurance exercise induces the transition of muscle fibers from fast-twitch to slow-twitch muscle fiber type. Herein, we discover a novel epigenetic mechanism for muscle contractile property tightly coupled to its metabolic capacity during muscle fiber type transition with exercise training. Our results show that an 8-week endurance exercise induces histone methylation remodeling of PGC-1α and myosin heavy chain (MHC) isoforms in the rat gastrocnemius muscle, accompanied by increased mitochondrial biogenesis and an elevated ratio of slow-twitch to fast-twitch fibers. Furthermore, to verify the roles of reactive oxygen species (ROS) and AMPK in exercise-regulated epigenetic modifications and muscle fiber type transitions, mouse C2C12 myotubes were used. It was shown that rotenone activates ROS/AMPK pathway and histone methylation enzymes, which then promote mitochondrial biogenesis and MHC slow isoform expression. Mitoquinone (MitoQ) partially blocking rotenone-treated model confirms the role of ROS in coupling mitochondrial biogenesis with muscle fiber type. In conclusion, endurance exercise couples mitochondrial biogenesis with MHC slow isoform by remodeling histone methylation, which in turn promotes the transition of fast-twitch to slow-twitch muscle fibers. The ROS/AMPK pathway may be involved in the regulation of histone methylation enzymes by endurance exercise.

Keywords: AMPK; Endurance exercise; Histone methylation; Mitochondrial biogenesis; ROS; Skeletal muscle fiber type.


Conflict of interest statement

The authors declare no competing interests.

Figures

Fig. 1
Fig. 1
C2C12 myotube differentiation process. Cell morphology and growth status were observed under a microscope. As differentiation progressed, C2C12 myotubes gradually fused and differentiated into myotubes. On day 1, there was minimal change in cell morphology. By day 2, a few myotubes were observed, and their numbers increased progressively. By day 4, a substantial number of well-aligned myotubes were evident. Therefore, interventions were initiated on day 4. Scale bar: 180 μm.
Fig. 2
Fig. 2
Endurance exercise induces slow-twitch-to-fast-twitch muscle fiber transition. (a) MYH7 and MYH4 immunofluorescence; representative images are shown. Anti-MYH7 was detected by red fluorescence (indicated by white arrows), whereas anti-MYH4 was detected by green fluorescence (indicated by yellow arrows). 4’,6-diamidino-2-phenylindole (DAPI)-stained nuclei. Scale bar: 130 μm. (b) Endurance exercise-induced changes in MYH7 gene mRNA content (RT‒qPCR) in gastrocnemius muscle (the blue bar represents C group, and the red bar represent E group) (n = 4). (d) Endurance exercise-induced changes in MYH4 gene mRNA content (RT‒qPCR) in gastrocnemius muscle (the blue bar represents C group, and the red bar represent E group) (n = 4). (c) Endurance exercise-induced changes in MYH7 protein expression (Western blotting) in gastrocnemius muscle (the blue bar represents C group, and the red bar represent E group) (n = 6). (e). Endurance exercise-induced changes in MYH4 protein expression (Western blotting) in gastrocnemius muscle (the blue bar represents C group, and the red bar represent E group) (n = 6). Data information: All values represent the mean ± SD. The p value was determined using a two-tailed unpaired Student’s t test. *p < 0.05, **p < 0.01.
Fig. 3
Fig. 3
Endurance exercise increases mitochondrial biogenesis. (a) The mitochondrial membrane potential (MMP) was measured using a fluorescent probe, JC-1. The ratio of red (JC-1 polymer) to green (JC-1 monomer) fluorescence was calculated (n = 6). (bd) Mitochondrial respiratory function of isolated mitochondria from gastrocnemius muscle. Basal (State 4) respiration (d) was measured first with glutamate (5 mM) and malate (2 mM). ADP (5 mM) was added to determine oxidative phosphorylation capacity (State 3) (c). The respiratory control ratio (RCR) (c) was the ratio of State 3 to State 4 respiration rate (the blue bar represents C group, and the red bar represent E group) (n = 6). (e) Endurance exercise-induced changes in PGC-1α mRNA expression (qRT‒PCR) in gastrocnemius muscle (the blue bar represents C group, and the red bar represent E group) (n = 4). (f). Endurance exercise-induced changes in PGC-1α and protein expression (Western blotting) in gastrocnemius muscle (the blue bar represents C group, and the red bar represent E group) (n = 6). (g) Endurance exercise-induced changes in COX IV protein expression (Western blotting) in gastrocnemius muscle (n = 6). Data information: All values represent the mean ± SD. The p value was determined using a two-tailed unpaired Student’s t test. *p < 0.05, **p < 0.01.
Fig. 4
Fig. 4
Endurance exercise-induced changes in histone methylation. (a) ChIP-qPCR assay showing the enrichment levels of H3K4me3 on the PGC-1α gene promoter in the gastrocnemius muscles of C group (blue bar) and E group (red bar). (b) ChIP-qPCR assay showing the enrichment levels of H3K27me3 on the PGC-1α gene promoter in the gastrocnemius muscles of C group (blue bar) and E group (red bar). (c) ChIP-qPCR assay showing the enrichment levels of H3K4me3 on the MYH7 gene promoter in the gastrocnemius muscles of C group (blue bar) and E group (red bar). (d) ChIP-qPCR assay showing the enrichment levels of H3K27me3 on the MYH7 gene promoter in the gastrocnemius muscles of C group (blue bar) and E group (red bar). (e) ChIP-qPCR assay showing the enrichment levels of H3K4me3 on the MYH4 gene promoter in the gastrocnemius muscles of C group (blue bar) and E group (red bar). (f) ChIP-qPCR assay showing the enrichment levels of H3K27me3 on the MYH4 gene promoter in the gastrocnemius muscles of C group (blue bar) and E group (red bar). Data information: All values represent the mean ± SD. The p value was determined using a two-tailed unpaired Student’s t test. *p < 0.05, **p < 0.01.
Fig. 5
Fig. 5
Endurance exercise activates the ROS/AMPK pathway to regulate histone methylase expression. (a) Endurance exercise-induced changes in the mitochondrial ROS generation rate in gastrocnemius muscle as measured by Amplex Ultra Red assay (the blue bar represents C group, and the red bar represent E group) (n = 6). (b, c) Endurance exercise-induced changes in p-AMPKThr172/AMPK protein expression (Western blotting) in gastrocnemius muscle (the blue bar represents C group, and the red bar represent E group) (n = 6). (d) Endurance exercise-induced changes in JARID1B protein expression (Western blotting) in gastrocnemius muscle (the blue bar represents C group, and the red bar represent E group) (n = 6). (e) Endurance exercise-induced changes in MLL protein expression (Western blotting) in gastrocnemius muscle (the blue bar represents C group, and the red bar represent E group) (n = 6). (f) Endurance exercise-induced changes in JMJD3 protein expression (Western blotting) in gastrocnemius muscle (the blue bar represents C group, and the red bar represent E group) (n = 6). (g) Endurance exercise-induced changes in EZH2 protein expression (Western blotting) in gastrocnemius muscle (the blue bar represents C group, and the red bar represent E group) (n = 6). Data information: All values represent the mean ± SD. The p value was determined using a two-tailed unpaired Student’s t test. *p < 0.05, **p < 0.01.
Fig. 6
Fig. 6
Rotenone activates the ROS/AMPK pathway to enhance mitochondrial biogenesis and increase MHC slow isoform expression. (a) Rotenone or rotenone + MitoQ combined treatment induced changes in mitochondrial membrane potential in C2C12 myotubes . JC-1 labels mitochondria with a high membrane potential in red (JC-1 aggregates) and mitochondria with a low membrane potential in green (JC-1 monomers). Scale bar: 60 μm (b) Rotenone or rotenone + mitoquinone (MitoQ) combined treatment induced changes in ROS levels in C2C12 myotubes (the blue bar represents DMSO group, the red bar represents ROT group, and the green bar represent R + M group) (n = 7). (c, d, f, g) Rotenone or rotenone + MitoQ combined treatment induced changes in p-AMPKThr172/AMPK/PGC-1α/COX IV protein expression (Western blotting) in C2C12 myotubes (n = 4). (c, d) Rotenone or rotenone + mitoquinone combined treatment induced changes in p-AMPKThr172/AMPK protein expression (Western blotting) in C2C12 myotubes (the blue bar represents DMSO group, the red bar represents ROT group, and the green bar represent R + M group) (n = 4). (e) Rotenone or rotenone + mitoquinone combined treatment induced changes in PGC-1α gene mRNA content (qRT‒PCR) in C2C12 myotubes (the blue bar represents DMSO group, the red bar represents ROT group, and the green bar represent R + M group) (n = 4). (f) Rotenone or rotenone + mitoquinone combined treatment induced changes in p- PGC-1α protein expression (Western blotting) in C2C12 myotubes (the blue bar represents DMSO group, the red bar represents ROT group, and the green bar represent R + M group) (n = 4). (g) Rotenone or rotenone + mitoquinone combined treatment induced changes in COX IV protein expression (Western blotting) in C2C12 myotubes (the blue bar represents DMSO group, the red bar represents ROT group, and the green bar represent R + M group) (n = 4). (h) Rotenone or rotenone + MitoQ combined treatment induced changes in MYH7 gene mRNA content (qRT‒PCR) in C2C12 myotubes (the blue bar represents DMSO group, the red bar represents ROT group, and the green bar represent R + M group) (n = 4). (i) Rotenone or rotenone + MitoQ combined treatment induced changes in MYH4 gene mRNA content (qRT‒PCR) in C2C12 myotubes (the blue bar represents DMSO group, the red bar represents ROT group, and the green bar represent R + M group) (n = 4). Data information: All values represent the mean ± SD. The p value was determined using one-way ANOVA coupled to Fisher’s least-significant difference (LSD) post hoc test. *p < 0.05, **p < 0.01.
Fig. 7
Fig. 7
Rotenone regulates histone methylation by modulating the corresponding catalytic enzymes. (a,b) Rotenone or rotenone + mitoquinone combined treatment induced changes in JARID1B protein expression (Western blotting) in C2C12 myotubes (the blue bar represents DMSO group, the red bar represents ROT group, and the green bar represent R + M group) (n = 4). (c) Rotenone or rotenone + mitoquinone combined treatment induced changes in MLL protein expression (Western blotting) in C2C12 myotubes (the blue bar represents DMSO group, the red bar represents ROT group, and the green bar represent R + M group) (n = 4). (d) Rotenone or rotenone + mitoquinone combined treatment induced changes in EZH2 protein expression (western blotting) in C2C12 myotubes (the blue bar represents DMSO group, the red bar represents ROT group, and the green bar represent R + M group) (n = 4). e. Rotenone or rotenone + mitoquinone combined treatment induced changes in JMJD3 protein expression (Western blotting) in C2C12 myotubes (the blue bar represents DMSO group, the red bar represents ROT group, and the green bar represent R + M group) (n = 4). (f) ChIP-qPCR assay showing the enrichment levels of H3K4me3 at the PGC-1α gene promoter in cells treated with DMSO (blue bars), ROT (red bars), and R + M (green). (g) ChIP-qPCR assay showing the enrichment levels of H3K27me3 at the PGC-1α gene promoter in cells treated with DMSO (blue bars), ROT (red bars), and R + M (green). (h) ChIP-qPCR assay showing the enrichment levels of H3K4me3 at the MYH7 gene promoter in cells treated with DMSO (blue bars), ROT (red bars), and R + M (green). (i) ChIP-qPCR assay showing the enrichment levels of H3K27me3 at the MYH7 gene promoter in cells treated with DMSO (blue bars), ROT (red bars), and R + M (green). (j) ChIP-qPCR assay showing the enrichment levels of H3K4me3 at the MYH4 gene promoter in cells treated with DMSO (blue bars), ROT (red bars), and R + M (green). )(k) ChIP-qPCR assay showing the enrichment levels of H3K27me3 at the MYH4 gene promoter in cells treated with DMSO (blue bars), ROT (red bars), and R + M (green). Data information: All values represent the mean ± SD. The p value in a–f was determined using a two-tailed unpaired Student’s t test; the value in G–L was determined using one-way ANOVA coupled to Fisher’s least-significant difference (LSD) post hoc test. *p < 0.05, **p < 0.01.
Fig. 8
Fig. 8
A model of endurance exercise-induced muscle fiber type transition. The schematic depicts that the ROS/AMPK pathway mediates endurance exercise remodeling histone methylation to couple mitochondrial biogenesis and the expression of MHC slow isoform. ROS: reactive oxygen species; AMPK: AMP-activated protein kinase; JARID1B: jumonji AT-rich interactive domain 1B; MLL: mixed lineage leukemia; JMJD3: jumonji domain containing-3; EZH2: enhancer of zeste homolog 2; H3K4me3: histone-3 lysine-4 trimethylation; H3K27me3: histone-3 lysine-27 trimethylation; PGC-1α: peroxisome proliferator-activated receptor γ coactivators 1α; MYH7: myosin heavy chain 7.

References

    1. Schiaffino, S. & Reggiani, C. Fiber types in mammalian skeletal muscles. Physiol. Rev.91, 1447–1531. 10.1152/physrev.00031.2010 (2011). 10.1152/physrev.00031.2010 - DOI - PubMed
    1. Crupi, A. N. et al. Oxidative muscles have better mitochondrial homeostasis than glycolytic muscles throughout life and maintain mitochondrial function during aging. Aging (Albany NY)10, 3327–3352. 10.18632/aging.101643 (2018). 10.18632/aging.101643 - DOI - PMC - PubMed
    1. Lin, J. et al. Transcriptional co-activator PGC-1 alpha drives the formation of slow-twitch muscle fibres. Nature418, 797–801. 10.1038/nature00904 (2002). 10.1038/nature00904 - DOI - PubMed
    1. Mishra, P., Varuzhanyan, G., Pham, A. H. & Chan, D. C. Mitochondrial dynamics is a distinguishing feature of skeletal muscle fiber types and regulates organellar compartmentalization. Cell Metab.22, 1033–1044. 10.1016/j.cmet.2015.09.027 (2015). 10.1016/j.cmet.2015.09.027 - DOI - PMC - PubMed
    1. Rahman, F. A. & Quadrilatero, J. Emerging role of mitophagy in myoblast differentiation and skeletal muscle remodeling. Semin. Cell Dev. Biol.10.1016/j.semcdb.2021.11.026 (2021). 10.1016/j.semcdb.2021.11.026 - DOI - PubMed

MeSH terms

Substances

LinkOut - more resources