

Ultrasound based radiomics model for assessment of placental function in pregnancies with preeclampsia
- PMID: 39256496
- PMCID: PMC11387498
- DOI: 10.1038/s41598-024-72046-2
Ultrasound based radiomics model for assessment of placental function in pregnancies with preeclampsia
Erratum in
-
Author Correction: Ultrasound based radiomics model for assessment of placental function in pregnancies with preeclampsia.Sci Rep. 2024 Dec 16;14(1):30517. doi: 10.1038/s41598-024-81772-6. Sci Rep. 2024. PMID: 39681597 Free PMC article. No abstract available.
Abstract
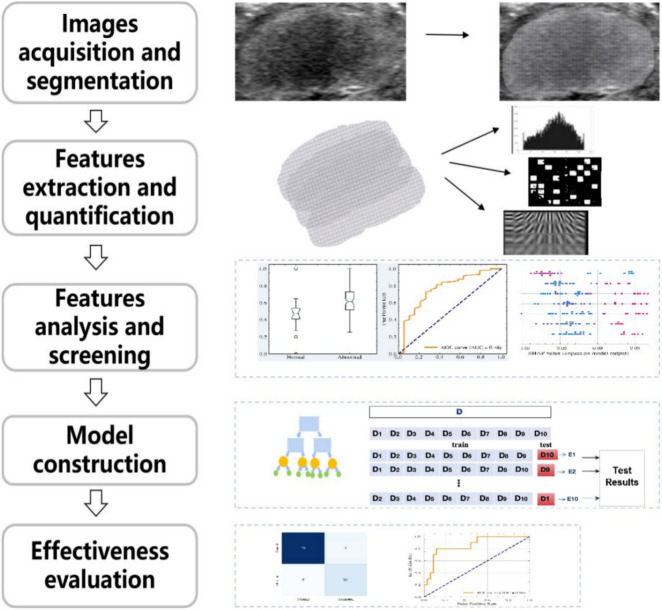
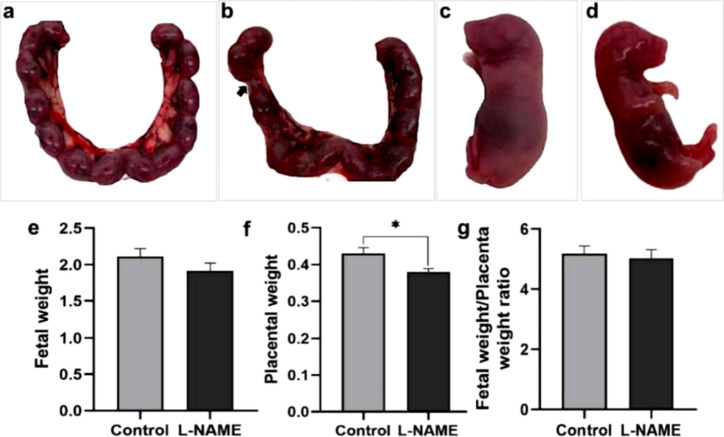
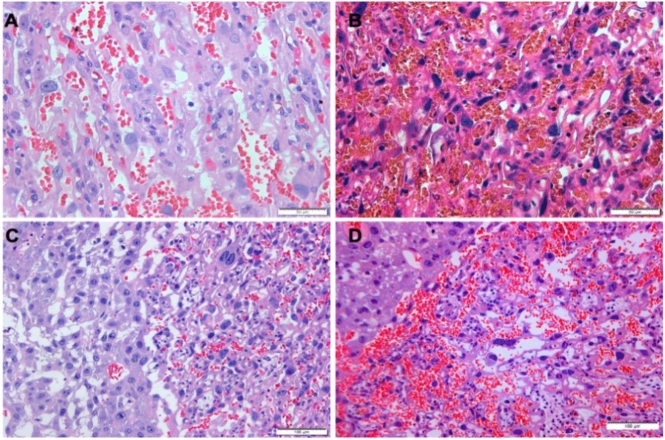
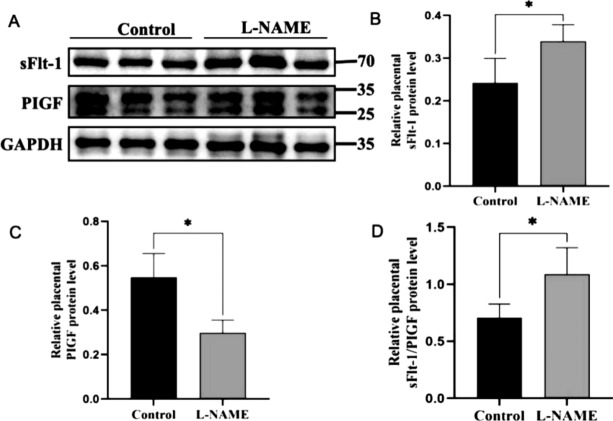
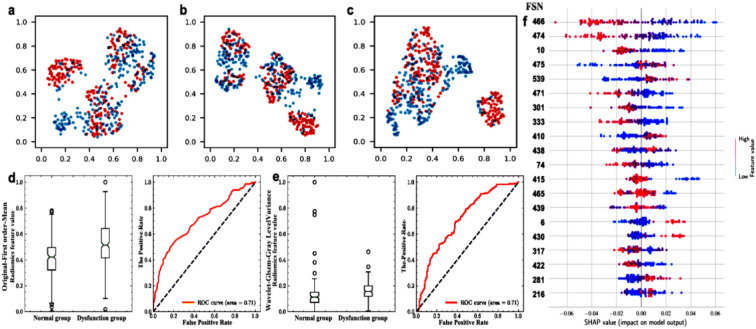
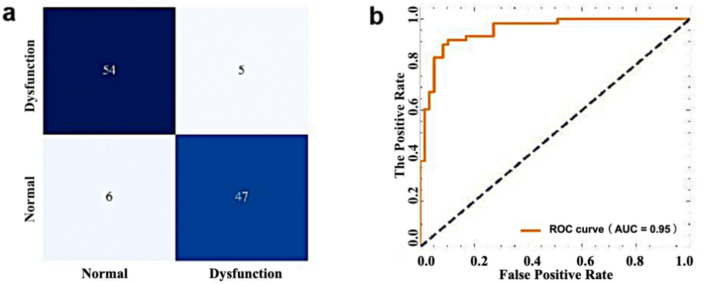
The goal of our research is to elucidate and better assess placental function in rats with preeclampsia through an innovative application of ultrasound-based radiomics. Using a rat model induced with L-NAME, we carefully investigated placental dysfunction via microstructural analysis and immunoprotein level assessment. Employing the Boruta feature selection method on ultrasound images facilitated the identification of crucial features, consequently enabling the development of a robust model for classifying placental dysfunction. Our study included 12 pregnant rats, and thorough placental evaluations were conducted on 160 fetal rats. Distinct alterations in placental microstructure and angiogenic factor expression were evident in rats with preeclampsia. Leveraging high-throughput mining of quantitative image features, we extracted 558 radiomic features, which were subsequently used to construct an impressive evaluation model with an area under the receiver operating curve (AUC) of 0.95. This model also exhibited a remarkable sensitivity, specificity, accuracy, positive predictive value, and negative predictive value of 88.7%, 91.5%, 90.2%, 90.4%, and 90.0%, respectively. Our findings highlight the ability of ultrasound-based radiomics to detect abnormal placental features, demonstrating its potential for evaluating both normative and impaired placental function with high precision and reliability.
Keywords: Placenta; Preeclampsia; Radiomics; Rats; Ultrasound.
© 2024. The Author(s).
Conflict of interest statement
The authors declare no competing interests.
Figures
Similar articles
-
Application of ultrasound-based radiomics technology in fetal-lung-texture analysis in pregnancies complicated by gestational diabetes and/or pre-eclampsia.Ultrasound Obstet Gynecol. 2021 May;57(5):804-812. doi: 10.1002/uog.22037. Ultrasound Obstet Gynecol. 2021. PMID: 32250510
-
A Hybrid Model for Fetal Growth Restriction Assessment by Automatic Placental Radiomics on T2-Weighted MRI and Multifeature Fusion.J Magn Reson Imaging. 2025 Jan;61(1):494-504. doi: 10.1002/jmri.29399. Epub 2024 Apr 24. J Magn Reson Imaging. 2025. PMID: 38655903
-
Homodyned K-Distribution Temporal-Based Characterization of Rat Placenta Microstructure Using the Reduced Uterine Perfusion Pressure Model of Preeclampsia.Ultrasound Med Biol. 2025 Jul;51(7):1090-1101. doi: 10.1016/j.ultrasmedbio.2025.03.007. Epub 2025 Apr 15. Ultrasound Med Biol. 2025. PMID: 40234153
-
Clinical-sonographic scores for the screening of placenta accreta spectrum: a systematic review and meta-analysis.Am J Obstet Gynecol MFM. 2024 Aug;6(8):101369. doi: 10.1016/j.ajogmf.2024.101369. Epub 2024 Apr 16. Am J Obstet Gynecol MFM. 2024. PMID: 38636601
-
An integrated model of preeclampsia: a multifaceted syndrome of the maternal cardiovascular-placental-fetal array.Am J Obstet Gynecol. 2022 Feb;226(2S):S963-S972. doi: 10.1016/j.ajog.2020.10.023. Epub 2021 Mar 9. Am J Obstet Gynecol. 2022. PMID: 33712272 Review.
Cited by
-
Nutraceuticals as Modulators of Molecular Placental Pathways: Their Potential to Prevent and Support the Treatment of Preeclampsia.Int J Mol Sci. 2024 Nov 13;25(22):12167. doi: 10.3390/ijms252212167. Int J Mol Sci. 2024. PMID: 39596234 Free PMC article. Review.
References
-
- Steegers, E. A., von Dadelszen, P., Duvekot, J. J. & Pijnenborg, R. Pre-eclampsia. Lancet376, 631–644. 10.1016/s0140-6736(10)60279-6 (2010). - PubMed
-
- ACOG Practice Bulletin No. 202. Gestational hypertension and preeclampsia. Obstet. Gynecol.133, 1. 10.1097/aog.0000000000003018 (2019). - PubMed
-
- Chappell, L. C., Cluver, C. A., Kingdom, J. & Tong, S. Pre-eclampsia. Lancet398, 341–354. 10.1016/s0140-6736(20)32335-7 (2021). - PubMed
-
- Hoodbhoy, Z. et al. The impact of maternal preeclampsia and hyperglycemia on the cardiovascular health of the offspring: A systematic review and meta-analysis. Am. J. Perinatol.40, 363–374. 10.1055/s-0041-1728823 (2023). - PubMed
MeSH terms
Grants and funding
LinkOut - more resources
Full Text Sources
