. 2024 Oct;43(20):4752-4785.
doi: 10.1038/s44318-024-00222-1. Epub 2024 Sep 10.

The global phosphorylation landscape of mouse oocytes during meiotic maturation

Affiliations

The global phosphorylation landscape of mouse oocytes during meiotic maturation

Hongzheng Sun et al. EMBO J. 2024 Oct.

Abstract

Phosphorylation is a key post-translational modification regulating protein function and biological outcomes. However, the phosphorylation dynamics orchestrating mammalian oocyte development remains poorly understood. In the present study, we apply high-resolution mass spectrometry-based phosphoproteomics to obtain the first global in vivo quantification of mouse oocyte phosphorylation. Of more than 8000 phosphosites, 75% significantly oscillate and 64% exhibit marked upregulation during meiotic maturation, indicative of the dominant regulatory role. Moreover, we identify numerous novel phosphosites on oocyte proteins and a few highly conserved phosphosites in oocytes from different species. Through functional perturbations, we demonstrate that phosphorylation status of specific sites participates in modulating critical events including metabolism, translation, and RNA processing during meiosis. Finally, we combine inhibitor screening and enzyme-substrate network prediction to discover previously unexplored kinases and phosphatases that are essential for oocyte maturation. In sum, our data define landscape of the oocyte phosphoproteome, enabling in-depth mechanistic insights into developmental control of germ cells.

Keywords: Kinase; Meiosis; Oocyte; Phosphatase; Phosphorylation.


Conflict of interest statement

The authors declare no competing interests.

Figures
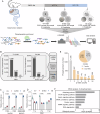
Figure 1
Figure 1. Phosphoproteomics profiling of mouse oocyte maturation.
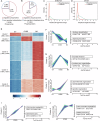
(A) Illustration of in vivo isolation of mouse oocytes at GV, GVBD, and MII stage. (B) Number of identified phosphoproteins, phosphopeptides, and phosphosites in all measured samples. (Left) Number of phosphorylated residues from different classes according to localization probability: class I (probability > 75%), class II (probability = 50 to 75%), and class III (probability <50%). (Middle) Distribution of phosphorylated amino acids [serine (pS), threonine (pT), and tyrosine (pY)]. (C, D) Phosphorylation dynamics of key residues on CDK1, MAPK1, and MAPK3 during oocyte maturation. Data are expressed as mean percentage ±SD from five independent replicates. Two-tailed Student’s t test was used for statistical analysis, comparing to GV oocytes. The P value is labeled in the figure. (E) Bar graph and pie chart depicting the number of phosphosites per protein. (F) Bar graph showing the statistically enriched KEGG pathways in the phosphoproteome. Benjamini–Hochberg (BH) corrected P value adjustment (P.adjust) was used for the enrichment analyses. Source data are available online for this figure.
Figure 2
Figure 2. Phosphorylation dynamic during meiotic maturation.
(A) Pie chart showing the percentage of regulated phosphosites during oocyte maturation. (B) Pie chart showing the percentage of regulated phosphoproteins during oocyte maturation. (C, D) Density plots comparing the amplitudes of the regulated phosphoproteome and the corresponding proteome. (E) Heatmap illustrating the dynamic changes in regulated phosphosites during oocyte maturation. Fuzzy c-means clustering organized the phosphosites into five distinct clusters. The numbers of phosphosites corresponding to each cluster are indicated. (FJ) Five distinct clusters of regulated phosphoproteome. Each line indicates the relative abundance of individual phosphosites. Representative biological processes and phosphosites are show on the right. Benjamini–Hochberg (BH) corrected P value adjustment (P.adjust) was used for the enrichment analyses.
Figure 3
Figure 3. Novel phosphosites identified in mouse oocytes.
(A) The overlap of phosphorylation sites among our study, Gygi’s data and PhosphoSitePlus database. (B) Pie chart showing the percentage of novel phosphosites identified in oocytes and their corresponding proteins. (CJ) Relative abundance of novel phosphosites in representative proteins at different stages. (K) Schematic model of core subcortical maternal complex, with the number of phosphosites indicated for each component. (LO) Relative abundance of novel phosphosites in representative proteins at different stages. Source data are available online for this figure.
Figure 4
Figure 4. BTG4 phosphorylation is required for maternal mRNA degradation.
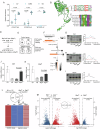
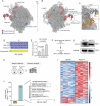
(A) Relative abundance of three phosphosites (Thr145, Ser146, and Ser147, abbreviated as “TSS”) on BTG4 protein during oocyte maturation. Data are expressed as mean percentage ±SD from five independent replicates. Welch’s t test was used to analyze the difference between GV and GVBD at the BTG4-T115 p-site, while Two-tailed Student’s t test was used for statistical analysis between other data sets, comparing to GV oocytes. The p value is labeled in the figure. (B) BTG4 protein structure is predicted by Robetta and TSS phosphosites are indicated by yellow residues. Sequence logo illustrating the phosphorylation cluster (15-amino acid flanking regions of TSS phosphosites) across multiple species. (C) Alignment of BTG4 phosphorylation cluster across different species. Asterisks indicate TSS. (D) Schematic presentation of phosphomutant design of BTG4-TSS. (E) Schematic presentation of sample collection and RNA analysis. GV and MII oocytes in control group were collected from in vitro-cultured oocytes. Btg4wt and Btg4tm oocytes were collected from MII oocyte with wild-type or mutant BTG4 overexpression. (F) Diagram showing the strategy of the mRNA poly(A) tail (PAT) assay. P1 anchor primer, P2 P1-antisense primer, Pn gene-specific primer. (GI) PAT assay showing changes in the poly(A)-tail length for the indicated transcripts in control group (GV and MII oocytes) and injection group (Btg4wt and Btg4tm oocytes). (J, K) Relative abundance of the indicated transcripts in control group (GV and MII oocytes) and injection group (Btg4wt and Btg4tm oocytes), determined by RT-qPCR. Data are expressed as mean percentage ±SD. n = 4 independent replicates. In total, 50 oocytes were analyzed for each group. Two-tailed Student’s t test and Welch’s t test were used for the statistical analysis of Zp3 and Gtsf1, respectively. The P value is labeled in the figure. (L) Heatmap illustrating the downregulated transcripts in MII vs. GV oocytes and the aberrantly accumulated transcripts in Btg4tm vs. Btg4wt oocytes, respectively. (M) Volcano plot showing the differentially expressed genes in Btg4 knockout oocytes and Btg4tm oocytes, respectively. Student’s t test followed by Benjamini–Hochberg (BH) P value adjustment (P.adjust) was used for the statistical analysis. Source data are available online for this figure.
Figure 5
Figure 5. Conserved phosphosites across multiple species.
(A) The flowchart illustrating the process of screening for conserved phosphosites across the four species (Drosophila, Sea star, Xenopus, and mus musculus). (B) Upset plot showing the identified 76 conserved phosphosites across the four species. (CE) Alignment of sequences surrounding conserved phosphosites in HDAC2 (C), NUP98 (D), and PDCD4 (E). (F) REVIGO clusters of significantly overrepresented (P value < 0.01) GO terms for proteins with conserved phosphosites. (G) Alignment of sequences surrounding conserved phosphosites (S241) in MDH1. (H) Schematic diagram of Malate-Aspartate Shuttle. (I) Schematic representation of the MDH1 phosphomutant design. (J) Immunoblotting showing the overexpression of exogenous MDH1 (MDH1wt and MDH1mut) protein in oocytes. (100 oocytes per lane). (K) Diagram showing the sample collection for metabolomic analysis. (L) Heatmap showing the dynamics of 15 differential metabolites between Mdh1mut group and control group. (M) Z-score plot of 15 differential metabolites compared between Mdh1mut group and control group. (N) Schematic diagram of malate-aspartate shuttle, TCA cycle and the relevant metabolic pathways. Metabolites increased in Mdh1mut oocytes are indicated by red filled triangles, and metabolites decreased in Mdh1mut oocytes are indicated by green filled triangles. AGC aspartate–glutamate carrier, OGC malate-2-oxoglutarate carrier, GOT1 Glutamic-Oxaloacetic Transaminase 1, GOT2 Glutamic-Oxaloacetic Transaminase 2. Source data are available online for this figure.
Figure 6
Figure 6. Unveiling crucial kinases orchestrating oocyte maturation.
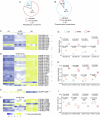
(A) Pie chart showing the numbers of total kinases (left), identified kinases (middle), and phosphorylated kinases (right). (B) Regulated phosphorylated kinases annotated to the major kinase families using www.kinhub.org. TK tyrosine kinases, TKL tyrosine kinase-like, STE homologs of the yeast STE7, STE11, and STE20 genes, CK1 casein/cell kinase 1 family, AGC protein kinase A, G, C families, CAMK calmodulin/calcium-regulated kinases and some non-calcium-regulated families, CMGC is CDK, MAPK, GSK3, and CLK kinase families. (C) Bar plot representing the percentage of all kinases (gray) and regulated phosphorylated kinases (green) quantified in oocytes from each of the major mammalian kinase families. (DF) Regulated phosphosites on MAST4 (D), WNK1 (E), and PDPK1 (F). (G) Effects of different kinase inhibitors on the first polar body extrusion. Data are expressed as mean percentage ± SD from three independent replicates in which at least 100 oocytes were analyzed for each group. Two-tailed Student’s t test was used for statistical analysis. **P < 0.01, ***P < 0.001. (H) Schematic presentation of the WNK-IN-11 treatment experiments. (I) Bright-field images of control and WNK-IN-11-treated oocytes. Scale bars, 50 μm. (J) Quantitative analysis of GVBD rate in oocytes treated with WNK-IN-11 at different concentrations. Data are expressed as mean percentage ± SD from three independent replicates in which at least 100 oocytes were analyzed for each group. (K) Quantitative analysis of Pb1 extrusion in oocytes treated with WNK-IN-11 at different concentrations. Data are expressed as mean percentage ± SD from three independent replicates in which at least 100 oocytes were analyzed for each group. (L) Representative confocal images of control and WNK-IN-11-treated oocytes stained with a-tubulin antibody to visualize the spindle (green) and with propidium iodide to visualize chromosomes (red). Scale bars, 10 μm. (M) Quantitative analysis of meiotic defects in control and WNK-IN-11-treated oocytes. Data are expressed as mean percentage ±SD from three independent replicates in which at least 100 oocytes were analyzed for each group. Two-tailed Student’s t test was used for statistical analysis. Source data are available online for this figure.
Figure 7
Figure 7. Phosphorylation dynamics of phosphatases during oocyte maturation.
(A) Pie chart showing the numbers of regulated and non-regulated phosphatases in oocyte proteome. (B) Pie chart showing the numbers of regulated and non-regulated phosphorylated phosphatases. (CF) Heatmap depicting the phosphorylation dynamics of phosphorylated phosphatases categorized into distinct families. Novel phosphosites identified in each phosphatase are indicated by blue asterisk. (G) Relative phosphorylation levels of the novel phosphosites identified in CDC25B. Box plots: centerlines show the medians; box limits indicate the 25th and 75th percentiles; whiskers extend to the minimum and maximum. Data are expressed as mean percentage ± SD from five independent replicates. Two-tailed Student’s t test was used for statistical analysis, comparing to GV oocytes. The P value is labeled in the figure. (H) Relative phosphorylation levels of the representative MTMR14 tyrosine phosphatase. Box plots: centerlines show the medians; box limits indicate the 25th and 75th percentiles; whiskers extend to the minimum and maximum. Data are expressed as mean percentage ± SD from five independent replicates. Two-tailed Student’s t test was used for statistical analysis, comparing to GV oocytes. The P value is labeled in the figure. (I) Representative phosphatases with downregulated phosphorylation levels at specific phosphosite. Box plots: centerlines show the medians; box limits indicate the 25th and 75th percentiles; whiskers extend to the minimum and maximum. Data are expressed as mean percentage ±SD from five independent replicates. Two-tailed Student’s t test was used for statistical analysis, comparing to GV oocytes. The P value is labeled in the figure. Source data are available online for this figure.
Figure EV1
Figure EV1. Quality control for the phosphoproteomics and proteomics data. Related to Fig. 1.
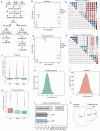
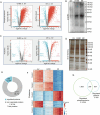
(A) Workflow of Proteomics and Phosphoproteomics. (B) Principal component analysis depicting the clustering of five proteome replicates from GV, GVBD, and MII oocytes. (C) Heatmap illustrating the Pearson’s correlation among the 15 proteome replicates obtained from GV, GVBD, and MII oocytes. (D) Principal component analysis depicting the clustering of five phosphoproteome replicates from GV, GVBD, and MII oocytes. (E) Heatmap illustrating the Pearson’s correlation among the 15 phosphoproteome replicates obtained from GV, GVBD, and MII oocytes. (F) Coefficient of variance boxplot of proteome for each stage sample derived from GV, GVBD, and MII oocytes. Box plots: centerlines show the medians; box limits indicate the 25th and 75th percentiles; whiskers extend to the minimum and maximum. n = 6700. (G) Coefficient of variance boxplot of phosphoproteome for each stage sample derived from GV, GVBD, and MII oocytes. Box plots: centerlines show the medians; box limits indicate the 25th and 75th percentiles; whiskers extend to the minimum and maximum. n = 8090. (H, I) Total phosphopeptide (G) and peptide (H) intensities ranked ascending to illustrate the dynamic range of the dataset. (J) Bar chart showing the number of identified peptides (up), proteins (middle), and quantified proteins (bottom). (K) The overlap of proteins and phosphoproteins.
Figure EV2
Figure EV2. Features of dynamic phosphoproteome and proteome. Related to Fig. 2.
(A) Volcano plots showing the differentially phosphorylated proteins between GVBD and GV (left), or between MII and GV (right). Student’s t test followed by Benjamini–Hochberg (BH) P value adjustment (P.adjust) was used for the statistical analysis. (B) Representative immunoblots of oocytes at GV, GVBD, and MII stages probed with pan-Ser/Thr antibody. (C) Volcano plots showing the differentially expressed proteins between GVBD and GV (left), or between MII and GV (right). Student’s t test followed by Benjamini–Hochberg (BH) P-value adjustment (p.adjust) was used for the statistical analysis. (D) Representative silver staining of oocytes at GV, GVBD, and MII stages for protein expression detection. (E) Pie chart showing the number and percentage of regulated proteins. (F) Heatmap illustrating the dynamic changes in regulated proteins during oocyte maturation. (G) The overlap of regulated proteins and regulated phosphoproteins.
Figure EV3
Figure EV3. RPL12-Ser38 phosphorylation participates in maintaining translational homeostasis in oocytes. Related to Fig. 5.
(A, B) Quantified phosphorylation sites of ribosome proteins (RPs) mapped to the ribosome structure (PDB: 4V6X). Phosphorylated RPSs and RPLs are shown in blue and red, respectively. RPL: Large ribosomal subunit proteins; RPS: Small ribosomal subunit proteins. (C) An enlarged view of the P stalk showing that RPL12-S38 is proximal to the ribosomal GTPase EEF2, RPLP0, RPLP1, and RPLP2. (D) Alignment and conservation analyses of RPL12 sequences flanking conserved phosphosites. (E) Bar chart showing the phosphorylation level of RPL12-S38 during oocyte maturation. The p value is labeled in the figure. Data are expressed as mean percentage ±SD from five independent replicates. Two-tailed Student’s t test was used for statistical analysis, comparing to GV oocytes. (F) Schematic representation of the design for RPL12 phosphomutant. (G) Immunoblotting showing the overexpression of exogenous RPL12 (RPL12wt and RPL12mut) protein in oocytes. (100 oocytes per lane). (H). Diagram showing the sample collection for proteomic analysis. (I). Heatmap showing the differentially expressed proteins between Rpl12wt and Rpl12mut oocytes. (J) Bar chart showing the differentially expressed proteins between Rpl12wt and Rpl12mut oocytes. The number of upregulated (up-) and downregulated (down-) proteins in Rpl12mut oocytes (left). Representative biological processes enriched for upregulated proteins in Rpl12mut oocytes (right). Benjamini–Hochberg (BH) corrected p-value adjustment (p.adjust) was used for the enrichment analyses.
Figure EV4
Figure EV4. Effects of different kinase inhibitors on oocyte maturation. Related to Fig. 6.
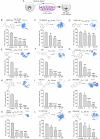
(A) Schematic presentation of the inhibitor treatment experiment. (BM) Quantitative analysis of the Pb1 extrusion rate in oocytes treated with different inhibitors. Data are expressed as mean percentage ±SD from three independent replicates in which at least 100 oocytes were analyzed for each group. Two-tailed Student’s t test was used for statistical analysis, comparing to control group (DMSO treatment). #P > 0.05, *P < 0.05, **P < 0.01, ***P < 0.001.
Figure EV5
Figure EV5. Enrichment analysis of the predicted kinases in oocytes. Related to Fig. 6.
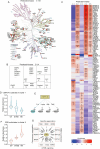
(A) Kinase tree showing the predicted kinases annotated to the major kinase families. (B) The number of predicted kinases in each kinase family. (C) Heatmap showing the predicted kinases enriched in each cluster. *P < 0.05, **P < 0.01, ***P < 0.001. Benjamini–Hochberg (BH) corrected P value adjustment (P.adjust) was used for the enrichment analyses. (D) Phosphorylation levels of the predicted CSNK1A substrates in cluster 1 during oocyte maturation. n = 191. (E). Networks showing the representative phosphosites in annotated substrates (KSPN) of CSNK1A1 kinase. Proteins are shown as nodes and phospho-residue is indicated by the number. (F) Phosphorylation levels of the predicted ERK substrates in cluster 5 during oocyte maturation. n = 672. (G) Networks showing the representative phosphosites in annotated substrates (KSPN) of ERK kinases. Proteins are shown as nodes and phospho-residue is indicated by the number.

References

    1. Adhikari D, Busayavalasa K, Zhang J, Hu M, Risal S, Bayazit MB, Singh M, Diril MK, Kaldis P, Liu K (2016) Inhibitory phosphorylation of Cdk1 mediates prolonged prophase I arrest in female germ cells and is essential for female reproductive lifespan. Cell Res 26:1212–1225 - PMC - PubMed
    1. Adhikari D, Flohr G, Gorre N, Shen Y, Yang H, Lundin E, Lan Z, Gambello MJ, Liu K (2009) Disruption of Tsc2 in oocytes leads to overactivation of the entire pool of primordial follicles. Mol Hum Reprod 15:765–770 - PubMed
    1. Adhikari D, Liu K (2014) The regulation of maturation promoting factor during prophase I arrest and meiotic entry in mammalian oocytes. Mol Cell Endocrinol 382:480–487 - PubMed
    1. Adhikari D, Zheng W, Shen Y, Gorre N, Hamalainen T, Cooney AJ, Huhtaniemi I, Lan ZJ, Liu K (2010) Tsc/mTORC1 signaling in oocytes governs the quiescence and activation of primordial follicles. Hum Mol Genet 19:397–410 - PMC - PubMed
    1. Adhikari D, Zheng W, Shen Y, Gorre N, Ning Y, Halet G, Kaldis P, Liu K (2012) Cdk1, but not Cdk2, is the sole Cdk that is essential and sufficient to drive resumption of meiosis in mouse oocytes. Hum Mol Genet 21:2476–2484 - PubMed