Comparative Study
. 2024 Sep 10;7(1):1114.
doi: 10.1038/s42003-024-06822-1.

A serum B-lymphocyte activation signature is a key distinguishing feature of the immune response in sarcoidosis compared to tuberculosis

Affiliations
Comparative Study

A serum B-lymphocyte activation signature is a key distinguishing feature of the immune response in sarcoidosis compared to tuberculosis

Ikhwanuliman Putera et al. Commun Biol. .

Abstract

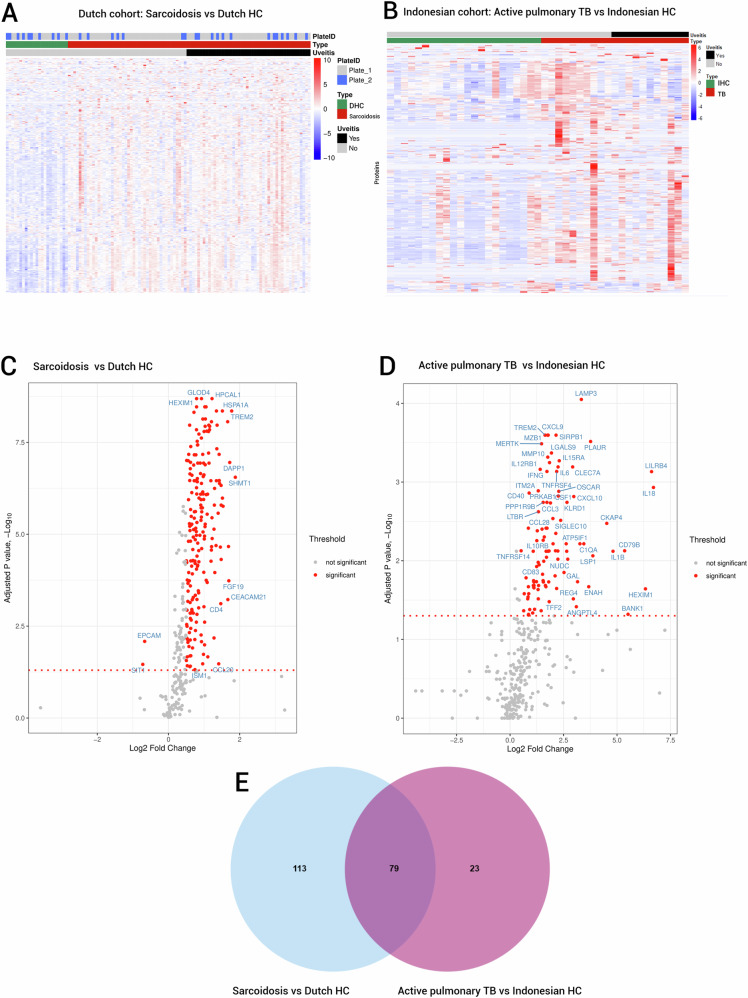
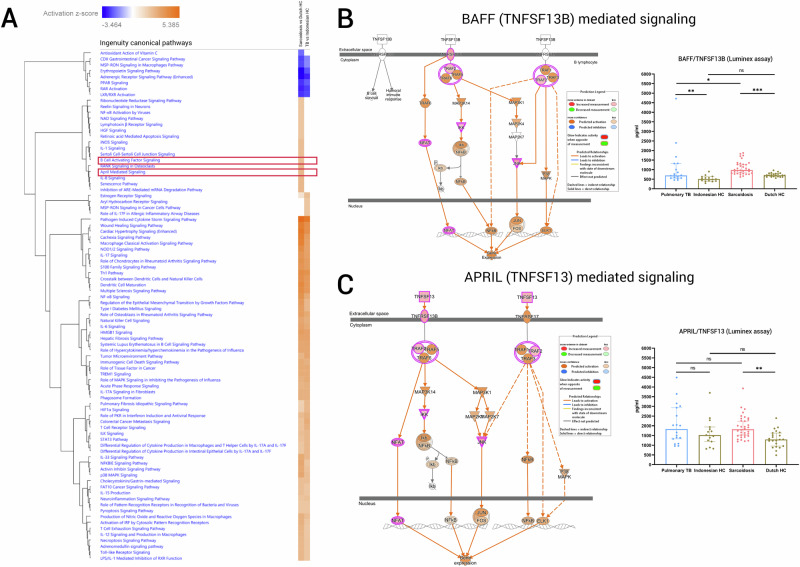
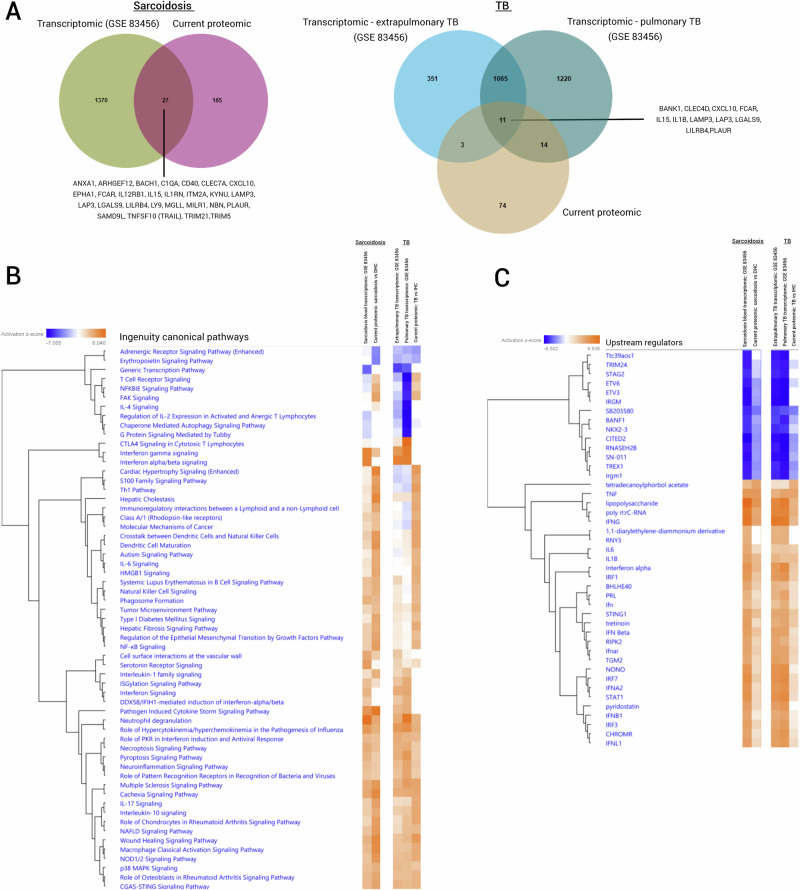
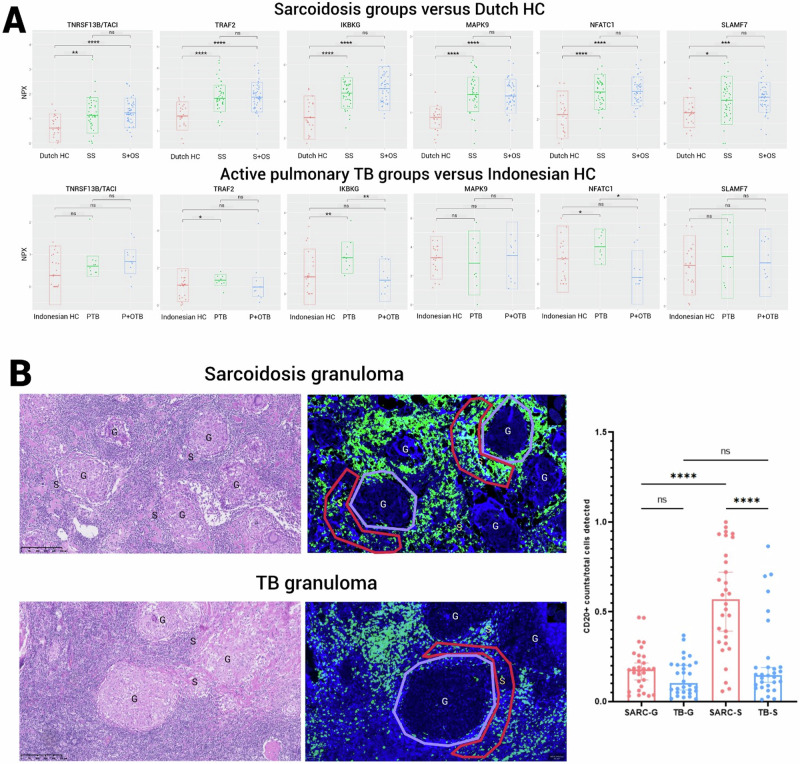
Sarcoidosis and tuberculosis (TB) are two granulomatous diseases that often share overlapping clinical features, including uveitis. We measured 368 inflammation-related proteins in serum in both diseases, with and without uveitis from two distinct geographically separated cohorts: sarcoidosis from the Netherlands and TB from Indonesia. A total of 192 and 102 differentially expressed proteins were found in sarcoidosis and active pulmonary TB compared to their geographical healthy controls, respectively. While substantial overlap exists in the immune-related pathways involved in both diseases, activation of B cell activating factor (BAFF) signaling and proliferation-inducing ligand (APRIL) mediated signaling pathways was specifically associated with sarcoidosis. We identified a B-lymphocyte activation signature consisting of BAFF, TNFRSF13B/TACI, TRAF2, IKBKG, MAPK9, NFATC1, and DAPP1 that was associated with sarcoidosis, regardless of the presence of uveitis. In summary, a difference in B-lymphocyte activation is a key discriminative immunological feature between sarcoidosis/ocular sarcoidosis (OS) and TB/ocular TB (OTB).


Conflict of interest statement

The authors declare no competing interest.

Figures

Fig. 1
Fig. 1. Serum proteome analysis in sarcoidosis and TB.
A Supervised heat map of 368 proteins from the Olink® inflammation panel in sarcoidosis versus Dutch HC (DHC). B Supervised heat map of 368 proteins from the Olink® inflammation panel in active pulmonary TB versus Indonesian HC (IHC). C Volcano plot of DEPs between sarcoidosis versus DHC. D Volcano plots of DEPs between active pulmonary TB versus IHC. E Venn diagram depicting disease specific and overlapping DEPs between sarcoidosis vs DHC and TB vs IHC comparisons.
Fig. 2
Fig. 2. Ingenuity canonical pathways overrepresented by identified DEPs in sarcoidosis and TB.
A Comparison of canonical pathways inhibited or activated in sarcoidosis and TB using hierarchical clustering sorting method in IPA® showing pathways with z-score > 2 and < -2. B BAFF mediated signaling pathway and (C) APRIL mediated signaling pathway, as retrieved from IPA® and predicted activation to be more specifically related to sarcoidosis. The right bar graph depicts the corresponding level of measurement with Luminex assay. The height of the bar represents the median value, and the upper and lower horizontal bars represent 95% confidence interval. Symbols depict the proteins and the coloring indicates the following: Red proteins measured at increased level, green proteins measured at decreased level, orange proteins predicted to be activated, and blue proteins predicted to be inhibited. Line coloring indicates the following: orange line indicates activating effect, blue line indicates inhibitory effect, yellow line indicates inconsistency with what was actually measured for the respective protein, and gray line indicates an unpredictable effect. Line types indicate the following: solid line indicates a direct relationship and dashed line indicates indirect relationship. Two-sided p values: *p < 0.05, **p < 0.01, ***p < 0.001.
Fig. 3
Fig. 3. Comparative analysis of differentially expressed genes/proteins, pathways, and upstream regulators between transcriptomic and proteomic datasets.
A Genes overlap between transcriptomic (from GSE 83456) and current proteomic analysis in sarcoidosis and TB cohorts. B Overlay comparison of ingenuity canonical pathways generated from transcriptomic datasets (GSE 83456) with our identified proteome of sarcoidosis and TB. Pathways were hierarchically sorted by using a cut-off value of z-score > 3 and <−3. C Overlay comparison of upstream regulators generated from transcriptomic datasets (GSE83456) with our identified proteome of sarcoidosis and TB (hierarchically sorted by using a cut-off value of z-score > 5 and <−5).
Fig. 4
Fig. 4. Identification of B-lymphocyte activation markers in sarcoidosis.
A NPX values from Olink® for TNFRSF13B/TACI, TRAF2, IKBKG, MAPK9, NFATC1, and SLAMF7 in sarcoidosis versus Dutch HC and TB versus Indonesian HC comparisons. B Representative hematoxylin & eosin and corresponding CD20 immunofluorescence microscopy images were analyzed for lymph node granulomas in sarcoidosis and TB. Annotated areas for CD20-stained cells quantification were represented by purple-bounded areas for granulomas (G) and red-bounded areas for the surroundings of granulomas (S). The bar graph represents CD20-positive cell counts normalized based on the total cells detected per annotated area from processed slides in sarcoidosis (SARC) and TB. post-hoc test B-H corrected two-sided *p <0.05, **p < 0.01, ***p < 0.001, ****p < 0.0001.
Fig. 5
Fig. 5. Identification of potential serum protein candidates in ocular sarcoidosis and tuberculosis.
Bar graphs showing the level of eight selected proteins in the verification step are presented. All measurements were acquired through Luminex assays, with the exception of AMBN, which was obtained through ELISA. The height of the bar represents the median value, and the upper and lower horizontal bars represent 95% confidence interval. Post-hoc test B-H corrected two-sided p-values *p < 0.05, **p < 0.01, ***p < 0.001. PTB = active pulmonary TB without uveitis, P + OTB = active pulmonary TB with uveitis, SS = Sarcoidosis without uveitis, S + OS = sarcoidosis with uveitis, IHC = Indonesian healthy controls, DHC = Dutch healthy controls.

References

    1. Mortaz, E. et al. Common features of tuberculosis and sarcoidosis. Int. J. Mycobacteriol.5, S240–S241 (2016). 10.1016/j.ijmyco.2016.09.031 - DOI - PubMed
    1. Giorgiutti, S. et al. Sarcoidosis-related uveitis: a review. J. Clin. Med.12 (2023). - PMC - PubMed
    1. Pedroso, A., Ferreira, I. & Chikura, T. Tuberculosis and sarcoidosis overlap: a clinical challenge from diagnosis to treatment. Cureus12, e11662 (2020). - PMC - PubMed
    1. Grunewald, J. et al. Sarcoidosis. Nat. Rev. Dis. Prim.5, 45 (2019). 10.1038/s41572-019-0096-x - DOI - PubMed
    1. Iannuzzi, M. C., Rybicki, B. A. & Teirstein, A. S. Sarcoidosis. N. Engl. J. Med357, 2153–2165 (2007). 10.1056/NEJMra071714 - DOI - PubMed

Publication types

MeSH terms