. 2024 Sep 11;12(1):100.
doi: 10.1186/s40364-024-00648-z.

Spatial resolved transcriptomics reveals distinct cross-talk between cancer cells and tumor-associated macrophages in intrahepatic cholangiocarcinoma

Affiliations

Spatial resolved transcriptomics reveals distinct cross-talk between cancer cells and tumor-associated macrophages in intrahepatic cholangiocarcinoma

Zhao-Ru Dong et al. Biomark Res. .

Abstract

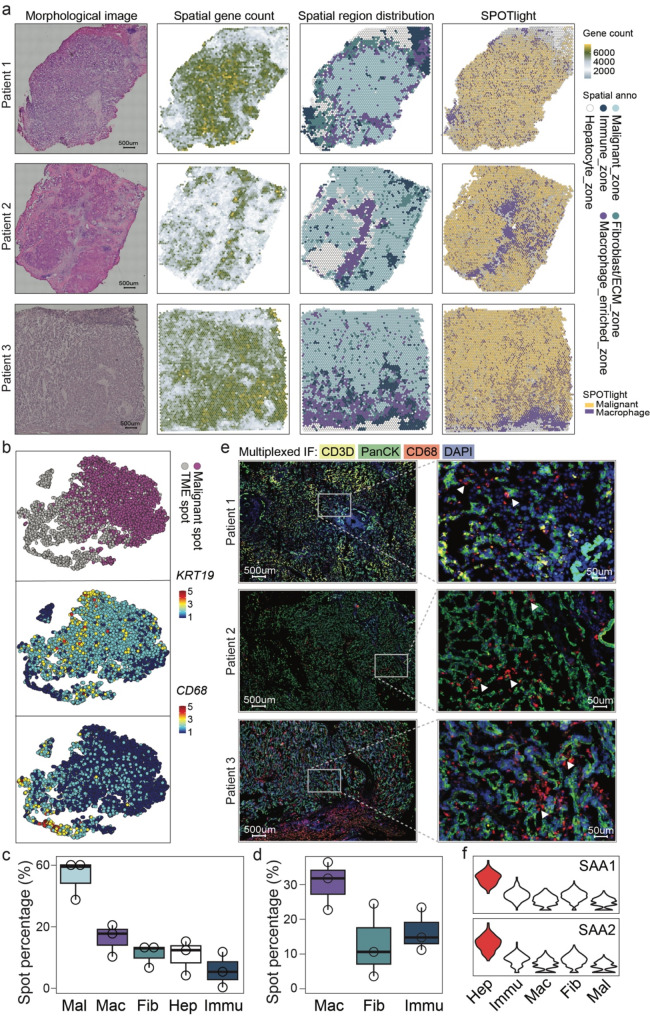
Background: Multiple studies have shown that tumor-associated macrophages (TAMs) promote cancer initiation and progression. However, the reprogramming of macrophages in the tumor microenvironment (TME) and the cross-talk between TAMs and malignant subclones in intrahepatic cholangiocarcinoma (iCCA) has not been fully characterized, especially in a spatially resolved manner. Deciphering the spatial architecture of variable tissue cellular components in iCCA could contribute to the positional context of gene expression containing information pathological changes and cellular variability.

Methods: Here, we applied spatial transcriptomics (ST) and digital spatial profiler (DSP) technologies with tumor sections from patients with iCCA.

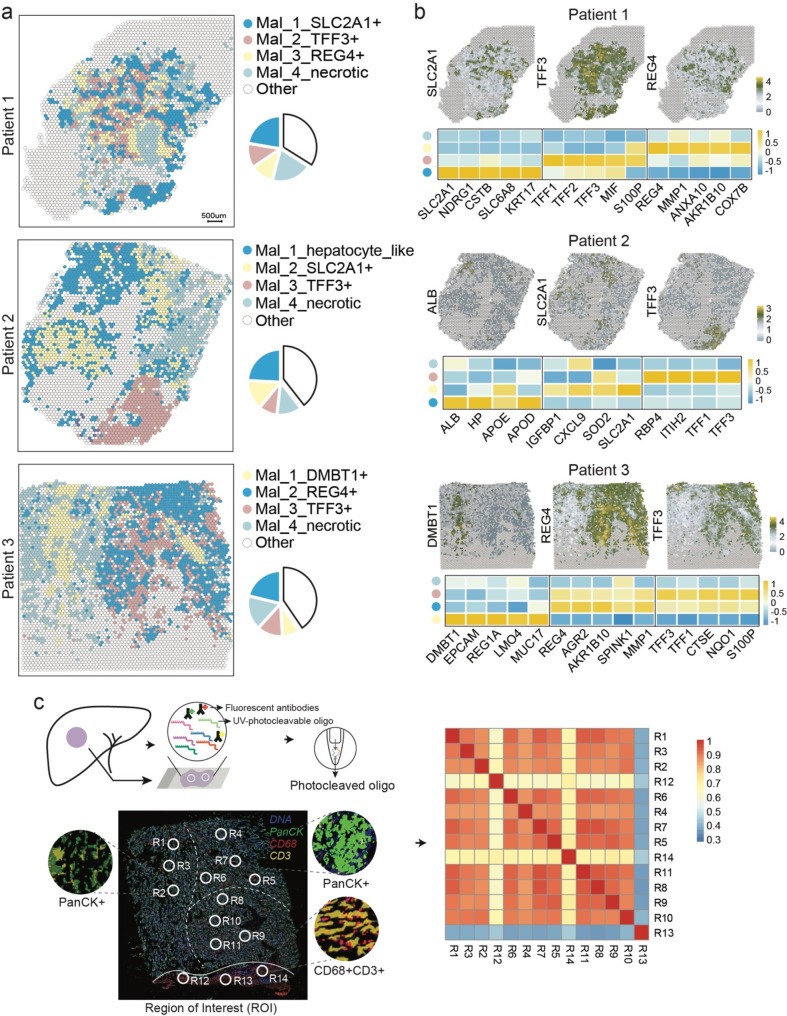
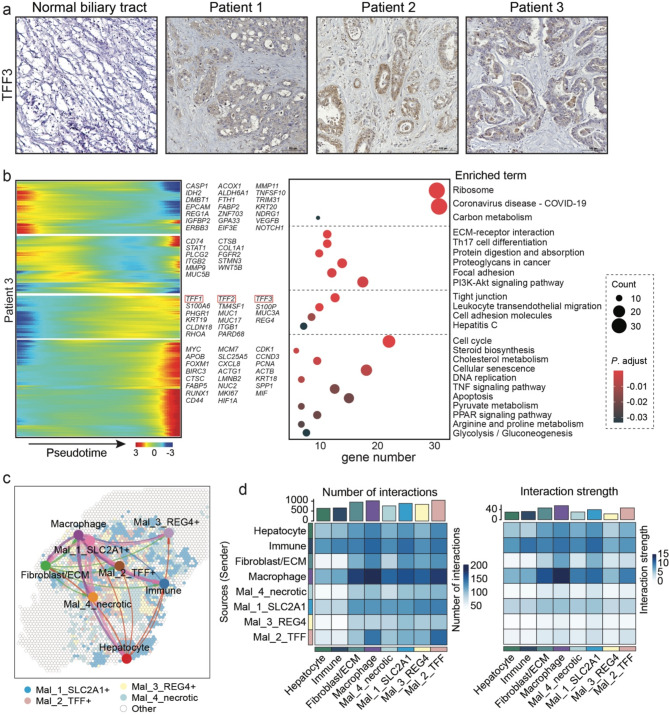
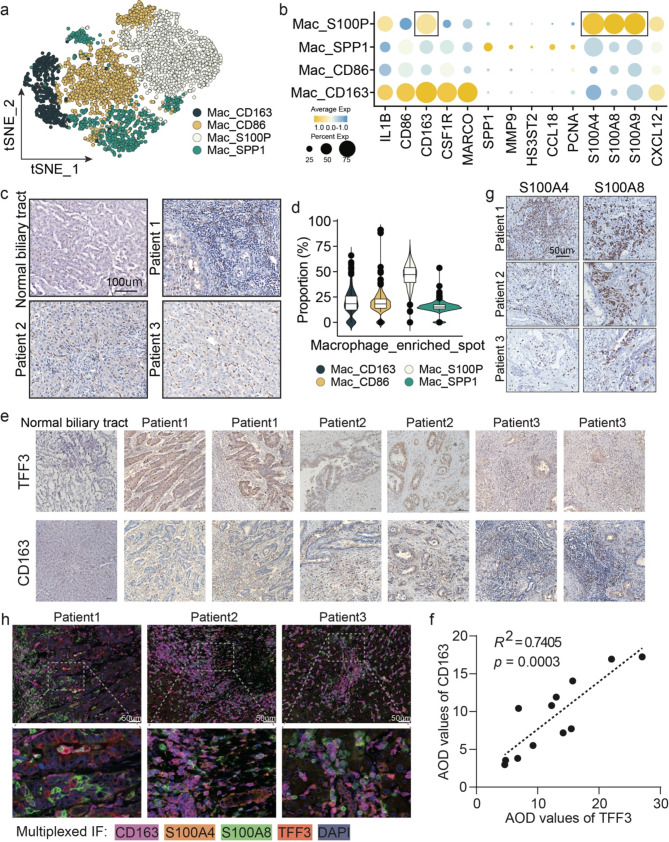
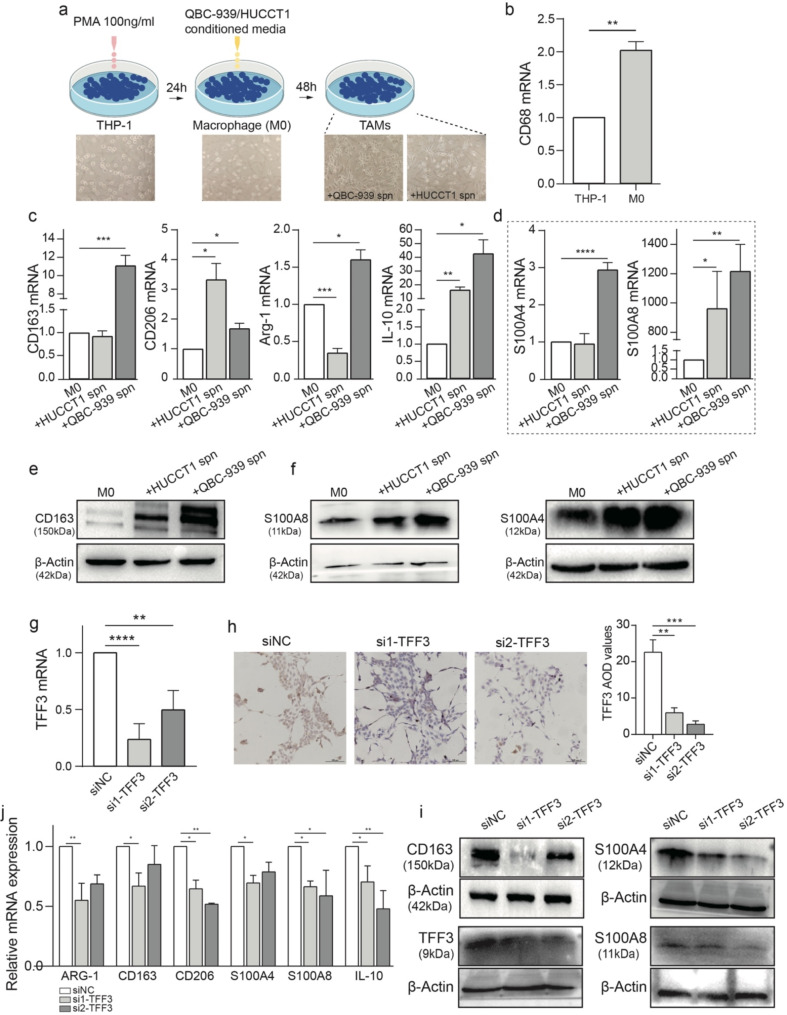
Results: The results reveal that spatial inter- and intra-tumor heterogeneities feature iCCA malignancy, and tumor subclones are mainly driven by physical proximity. Tumor cells with TME components shaped the intra-sectional heterogenetic spatial architecture. Macrophages are the most infiltrated TME component in iCCA. The protein trefoil factor 3 (TFF3) secreted by the malignant subclone can induce macrophages to reprogram to a tumor-promoting state, which in turn contributes to an immune-suppressive environment and boosts tumor progression.

Conclusions: In conclusion, our description of the iCCA ecosystem in a spatially resolved manner provides novel insights into the spatial features and the immune suppressive landscapes of TME for iCCA.

Keywords: Digital spatial profiler; Intrahepatic cholangiocarcinoma; Spatial transcriptomics; Trefoil factor 3 (TFF3); Tumor associated macrophage.


Conflict of interest statement

The authors declare no conflicts of interest that pertain to this work.

Figures

Fig. 1
Fig. 1
Dissecting iCCA ecosystem by spatial transcriptomics RNA sequencing. (a) The spot annotation of ST data and HE staining of tissue sections for three iCCA patients (Patient 1/2/3) enrolled in the current study. (b) T-distributed stochastic neighbor (t-SNE) embedding of all spots colored by spot annotation as either malignant spot or TME spot (upper panel), KRT19 expression level (middle panel) representing for malignant cell and CD68 expression level (bottom panel) for macrophage. (c) Spot proportion of each annotated cell type. Mal: malignant; Mac: macrophage; Fib: fibroblast; Hep: hepatocyte; Immu: immune. (d) Spot proportion of malignant spots dominated by specific TME components (macrophage, fibroblast or immune cell). (e) Multiplex IF staining of PanCK, CD3 and CD68 on patient tissue sections, the white arrows indicate for CD68 positive macrophages. (f) Average expression of SAA1 and SAA2 in annotated spot subpopulations
Fig. 2
Fig. 2
Spatial intra-tumor heterogeneity of iCCA. (a) Spatial distribution and proportion of malignant sub-populations in iCCA tissue section. (b) Different expressed genes for each malignant sub-population and the spatial expression distribution for typical marker genes. (c) DSP sequencing of 14 ROIs on section of patient 3. Left panel showing a schematic overview of DSP workflow and the spatial distribution of ROIs. Antibodies are covalently bonded to a DNA indexing oligo with a UV photo-cleavable linker. The solid line indicating the boundary between malignant enriched region and the stroma enriched region, and the dashed line indicating the boundaries of malignant sub-populations revealed by ST data. Right heatmap showing the overall transcriptional similarities of all ROIs
Fig. 3
Fig. 3
TFF proteins are overexpressed in iCCA and dominantly mediate the crosstalk between malignant cells and macrophage. (a) IHC staining showing an intensive expression of TFF3 in iCCA tissues. (b) Genes varying along the pseudo-time and the enriched signaling pathways for patient 3. (c) Interactions between every two spot groups in patient 1. (d) Interaction number and strength between every two spot groups in patient 1
Fig. 4
Fig. 4
Physical proximity distribution of CD163 + TAMs with TFF3 + malignant cells. (a) tSNE plot of macrophages of single cell data, colored by subclusters. (b) Dot plots showing the expression levels of marker genes of macrophage subclusters. (c) IHC staining showing the expression of CD163 in iCCA tissue indicating for the distribution of CD163 + TAMs. (d) SPOTlight tool inferring proportion estimate of each macrophage sub-population from the single cell data for the macrophage_enriched spots in ST data. (e) IHC staining showing the physical proximity distributions of CD163 and TFF proteins in the same or adjacent microscopic views. (f) Linear correlation of AOD values of TFF3 and CD163. (g) IHC staining of S100A4 and S100A8 for three iCCA patients. (h) Multiplexed IF staining of CD163, S100A4, S100A8 and TFF3
Fig. 5
Fig. 5
TFF3 secreted by malignant cells promoted the pro-tumor polarization of TAMs. (a) Schematic overview of THP-1 stimulation workflow. (b) The relative expression level of CD68 mRNA in THP-1 cell and stimulated M0 cell. (c) The relative expression levels of canonical marker genes of M2 after co-culture of cholangiocarcinoma cells with M0 cells. (d) The relative expression levels of S100P genes after co-culture of cholangiocarcinoma cells with M0 cells. (e) The relative protein level of CD163 after co-culture of cholangiocarcinoma cells with M0 cells. (f) The relative protein levels of S100P genes after co-culture of cholangiocarcinoma cells with M0 cells. (g) The relative expression level of TFF3 after depletion of TFF3 with siRNA in QBC-939 cells. (h) IHC staining showing the relative protein level of TFF3 after depletion of TFF3 with siRNA in QBC-939 cells. (i) Western blotting showing the relative protein level of TFF3 with siRNA in QBC-939 cells and CD163 and S100P in TAMs after depletion of TFF3. (j) The relative mRNA expression levels of canonical marker genes of M2 and S100P after depletion of TFF3 with siRNA in QBC-939 cells

References

    1. Peery AF, Crockett SD, Murphy CC, Lund JL, Dellon ES, Williams JL, et al. Burden and cost of gastrointestinal, liver, and pancreatic diseases in the United States: update 2018. Gastroenterology. 2019;156:254–e27211. 10.1053/j.gastro.2018.08.063 - DOI - PMC - PubMed
    1. Hogdall D, Lewinska M, Andersen JB. Desmoplastic tumor microenvironment and immunotherapy in cholangiocarcinoma. Trends Cancer. 2018;4:239–55. 10.1016/j.trecan.2018.01.007 - DOI - PubMed
    1. Sirica AE, Gores GJ. Desmoplastic stroma and cholangiocarcinoma: clinical implications and therapeutic targeting. Hepatology. 2014;59:2397–402. 10.1002/hep.26762 - DOI - PMC - PubMed
    1. Fan Z, Zou X, Wang G, et al. A transcriptome based molecular classification scheme for cholangiocarcinoma and subtype-derived prognostic biomarker. Nat Commun. 2024;15(1):484. 10.1038/s41467-024-44748-8 - DOI - PMC - PubMed
    1. Song G, Shi Y, Meng L, et al. Single-cell transcriptomic analysis suggests two molecularly distinct subtypes of intrahepatic cholangiocarcinoma. Nat Commun. 2022;13(1):1642. 10.1038/s41467-022-29164-0 - DOI - PMC - PubMed

LinkOut - more resources