. 2024 Sep;12(17):e70040.
doi: 10.14814/phy2.70040.

PKM2 regulates metabolic flux and oxidative stress in the murine heart

Affiliations

PKM2 regulates metabolic flux and oxidative stress in the murine heart

Katie C Y Lee et al. Physiol Rep. 2024 Sep.

Erratum in

Abstract

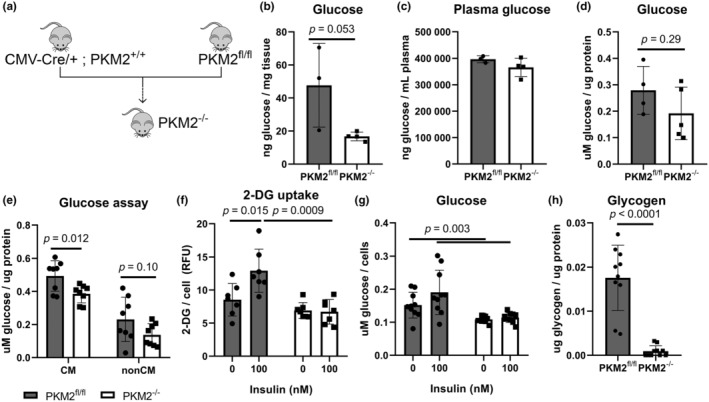
Cardiac metabolism ensures a continuous ATP supply, primarily using fatty acids in a healthy state and favoring glucose in pathological conditions. Pyruvate kinase muscle (PKM) controls the final step of glycolysis, with PKM1 being the main isoform in the heart. PKM2, elevated in various heart diseases, has been suggested to play a protective role in cardiac stress, but its function in basal cardiac metabolism remains unclear. We examined hearts from global PKM2 knockout (PKM2-/-) mice and found reduced intracellular glucose. Isotopic tracing of U-13C glucose revealed a shift to biosynthetic pathways in PKM2-/- cardiomyocytes. Total ATP content was two-thirds lower in PKM2-/- hearts, and functional analysis indicated reduced mitochondrial oxygen consumption. Total reactive oxygen species (ROS) and mitochondrial superoxide were also increased in PKM2-/- cardiomyocytes. Intriguingly, PKM2-/- hearts had preserved ejection fraction compared to controls. Mechanistically, increased calcium/calmodulin-dependent kinase II activity and phospholamban phosphorylation may contribute to higher sarcoendoplasmic reticulum calcium ATPase 2 pump activity in PKM2-/- hearts. Loss of PKM2 led to altered glucose metabolism, diminished mitochondrial function, and increased ROS in cardiomyocytes. These data suggest that cardiac PKM2 acts as an important rheostat to maintain ATP levels while limiting oxidative stress. Although loss of PKM2 did not impair baseline contractility, its absence may make hearts more sensitive to environmental stress or injury.

Keywords: glucose; glycolysis; metabolism; reactive oxygen species.


Conflict of interest statement

The authors declare no conflicts of interest.

Figures

FIGURE 1
FIGURE 1
Basal and insulin‐stimulated glucose uptake is reduced in PKM2−/− hearts. (a) Generation of global PKM2−/− mice. (b, c) Glucose measurements in whole heart tissue and plasma (n = 3–4 mice per group). (d) Cardiac glucose of whole heart tissue determined by an independent glucose assay (n = 4–5 mice). (e) Intracellular glucose in primary CM and non‐CM (n = 8 mice per genotype). (f) Quantifying 2‐DG uptake in CM normalized to DNA (n = 7 mice per genotype). Each point represents the average of at least 3 technical replicates from a single mouse. (g) Intracellular glucose in primary CM stimulated with insulin (n = 10 mice per genotype). Two‐way ANOVA with Tukey's multiple comparisons. (h) Glycogen content in whole heart tissue (n = 10 mice per group). Student's t‐test versus PKM2fl/fl mice unless specified. Data are shown as means ± SD.
FIGURE 2
FIGURE 2
Primary cardiac glucose transporters' GLUT1/4 expressions are similar. (a, b) Western blots and quantifications of total GLUT1/4 proteins in cardiac tissue (n = 10 mice per group, representative blot of 5 mice per group shown, each blot normalized to total protein and PKM2fl/fl controls. GLUT1, 4, and 12 were stained on the same blot. Total protein is also shown for normalization in Figure S3). (c, d) Western blot of CM incubated with or without insulin (n = 3 mice per genotype, normalized to total protein). Two‐way ANOVA with Tukey's multiple comparisons. (e) Slc2a1 and 4 transcripts in cardiac tissue were assessed by qPCR (n = 5 mice). Student's t‐test versus PKM2fl/fl mice unless specified. Data are shown as means ± SD.
FIGURE 3
FIGURE 3
Catabolic pathways glycolysis and the TCA cycle are dysregulated in PKM2−/− CM. (a) Experimental workflow. Cells are harvested 10 min, 2 h, and 18 h after the addition of U‐13C glucose media. (b) The schematic of glucose entry into glycolysis leads to acetyl‐CoA synthesis and the TCA cycle. (c–g) Glycolytic intermediates were assessed at 10 min of incubation. Unlabeled metabolite abundances are indicated as “C12,” labeled metabolites as “C13,” followed by the number of heavy carbons in the molecule. (h–j) TCA cycle metabolites were assessed at 2 h of incubation. All n = 3 mice per group. Data are shown as means ± SD. Student's t‐test versus PKM2fl/fl mice.
FIGURE 4
FIGURE 4
Lipid biosynthesis is dysregulated in PKM2−/− hearts. (a–d) 13C labeling of lipid substrates in CM analyzed by LC/MS after 18 h of incubation with U‐13C glucose. All n = 3 mice per group. Data are shown as means ± SD. (e, f) Representative TEM images showing lipid droplets (black spheres, examples indicated by black arrows, n = 3 mice). Each dot represents the average of 10 images from one tissue section per mouse. An independent experiment of an adjacent tissue section produced similar results. Scale bar = 8 μm. Student's t‐test versus PKMK2fl/fl mice.
FIGURE 5
FIGURE 5
Loss of PKM2 elevates ROS and superoxide levels in CM. (a) The Schematic of glucose entry into the oxidative PPP branch generates NADPH, leading to the nonoxidative biosynthetic PPP branch. (b–f) Isotopic tracing of PPP metabolites at 18 h of incubation unless specified. 6P‐gluconate abundance at both 10 min and 18 h is shown. Total NADPH (labeled and unlabeled) was assessed across all time points. All n = 3 mice per group. (g) ROS (n = 6 mice per genotype) and (h) mitochondrial superoxide levels (n = 5 mice per genotype) in CM incubated at normoxia (21% O2) or hypoxia (1% O2). (i) Representative fluorescent MitoSOX images (right, green) for analysis from (h) with accompanying brightfield images on the left. Scale bar = 100 μm. (j) Quantified cell viability of isolated CM incubated at normoxia or hypoxia, (k) representative fluorescent cell viability images (right, live cells green, dead cells red) with accompanying brightfield images on the left (n = 5 mice per genotype). Scale bar = 100 μm. Data are shown as means ± SD. Two‐way ANOVA with Tukey's multiple comparisons.
FIGURE 6
FIGURE 6
Mitochondrial respiration and ATP production are dysregulated in PKM2−/− hearts. (a) OCR and (b) ECAR were measured using the Seahorse assay. Arrows indicate the addition of oligomycin, FCCP, and rotenone & antimycin A, respectively. The experiment was repeated 3 times for a total of 4 mice. Representative plot of one experiment shown; each point is the average of 8 technical replicates for one mouse. (c) Calculation of basal respiration, (d) maximal respiration, (e) proton leak, (f) nonmitochondrial oxygen consumption, and (g) ATP production as determined by Seahorse assay. Data are shown as means ± SD of 8 technical replicate wells for one mouse. Student's t‐test versus PKM2fl/fl mice. (h) Total ATP abundance in CM determined by LC/MS across all time points (n = 3 mice per group). (i) ATP levels were determined in whole heart tissue (n = 10 mice) and (j) ATP in CM (n = 10 mice per genotype). Two‐way ANOVA with Tukey's multiple comparisons.
FIGURE 7
FIGURE 7
Preserved ejection fraction and fractional shortening in PKM2−/− mice. (a) Ejection fraction (EF) and (b) fractional shortening (FS) assessed by echocardiography (n = 16 mice for PKM2fl/fl and n = 23 for PKM2−/−) in mice aged 2–3 months old and (c, d) in mice aged 1 year old (n = 18 and 21 mice). (e–k) Western blots of phosphorylated PLN, SERCA2, and phosphorylated troponin I and their respective quantifications. Phosphorylated PLN (Ser16/Thr17) and phosphorylated troponin I (Ser23/24) normalized to PLN or troponin I, respectively (n = 5 mice). Total PLN (n = 5 mice) and SERCA2 normalized to total protein (n = 5 mice for PKM2fl/fl and n = 4 for PKM2−/−). Dotted line in (h) represents connection of nonconsecutive lanes of the same blot. (l) CaMKII activity as assessed by kinase consumption of ATP to ADP. Data shown as means ± SD. Student's t‐test versus PKM2fl/fl mice.

References

    1. Ackers‐Johnson, M. , Li, P. Y. , Holmes, A. P. , O'brien, S. M. , Pavlovic, D. , & Foo, R. S. (2016). A simplified, Langendorff‐free method for concomitant isolation of viable cardiac myocytes and nonmyocytes from the adult mouse heart. Circulation Research, 119, 909–920. - PMC - PubMed
    1. Baralle, F. E. , & Giudice, J. (2017). Alternative splicing as a regulator of development and tissue identity. Nature Reviews. Molecular Cell Biology, 18, 437–451. - PMC - PubMed
    1. Bednarski, T. , Pyrkowska, A. , Opasińska, A. , & Dobrzyń, P. (2016). Regulation of cardiac metabolism and function by lipogenic factors. Advances in Hygiene and Experimental Medicine, 70, 644–653. - PubMed
    1. Bekeredjian, R. , Walton, C. B. , Maccannell, K. A. , Ecker, J. , Kruse, F. , Outten, J. T. , Sutcliffe, D. , Gerard, R. D. , Bruick, R. K. , & Shohet, R. V. (2010). Conditional HIF‐1alpha expression produces a reversible cardiomyopathy. PLoS One, 5, e11693. - PMC - PubMed
    1. Boudina, S. , & Abel, E. D. (2007). Diabetic cardiomyopathy revisited. Circulation, 115, 3213–3223. - PubMed

MeSH terms