. 2024 Oct 10;5(4):100352.
doi: 10.1016/j.xhgg.2024.100352. Epub 2024 Sep 10.

Familial severe skeletal Class II malocclusion with gingival hyperplasia caused by a complex structural rearrangement at the KCNJ2-KCNJ16 locus

Affiliations

Familial severe skeletal Class II malocclusion with gingival hyperplasia caused by a complex structural rearrangement at the KCNJ2-KCNJ16 locus

Reza Maroofian et al. HGG Adv. .

Abstract

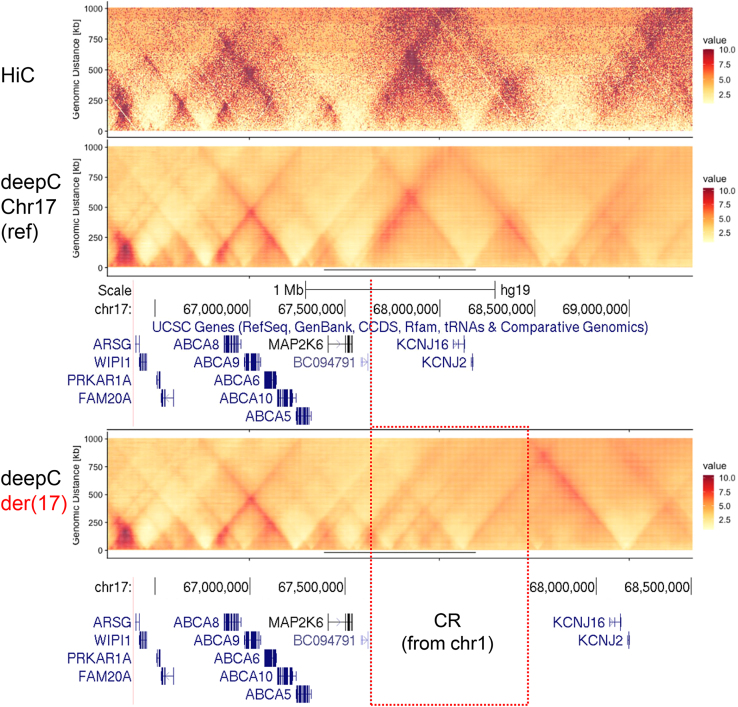
The aim of this work was to identify the underlying genetic cause in a four-generation family segregating an unusual phenotype comprising a severe form of skeletal Class II malocclusion with gingival hyperplasia. SNP array identified a copy number gain on chromosome 1 (chr1); however, this chromosomal region did not segregate correctly in the extended family. Exome sequencing also failed to identify a candidate causative variant but highlighted co-segregating genetic markers on chr17 and chr19. Short- and long-read genome sequencing allowed us to pinpoint and characterize at nucleotide-level resolution a chromothripsis-like complex rearrangement (CR) inserted into the chr17 co-segregating region at the KCNJ2-SOX9 locus. The CR involved the gain of five different regions from chr1 that are shuffled, chained, and inserted as a single block (∼828 kb) at chr17q24.3. The inserted sequences contain craniofacial enhancers that are predicted to interact with KCNJ2/KCNJ16 through neo-topologically associating domain (TAD) formation to induce ectopic activation. Our findings suggest that the CR inserted at chr17q24.3 is the cause of the severe skeletal Class II malocclusion with gingival hyperplasia in this family and expands the panoply of phenotypes linked to variation at the KCNJ2-SOX9 locus. In addition, we highlight a previously overlooked potential role for misregulation of the KCNJ2/KCNJ16 genes in the pathomechanism of gingival hyperplasia associated with deletions and other rearrangements of the 17q24.2-q24.3 region (MIM 135400).

Keywords: KCNJ16; KCNJ2; chromoanagenesis; chromothripsis; enhancer hijacking; gingival hyperplasia; malocclusion; mandibular retrognathism; maxillary prognathism; maxillary protrusion; neo-TAD.


Conflict of interest statement

Declaration of interests The authors declare no competing interests.

Figures

Figure 1
Figure 1
Pedigree, genomic rearrangement, and hypothetical mechanism (A) Pedigree and clinical photographs of the family. Circles represent females, squares represent males, and triangles represent miscarriages. Filled symbols represent affected individuals, black arrow depicts the proband, and individuals with DNA available are shown with their sample ID below the symbol. Symbols with borders in red and/or blue indicate the family members investigated by genome and/or exome sequencing, respectively. At the bottom, clinical pictures and lateral radiographs are shown for available family members. (B) Schematic diagram showing the reference regions in chr1 and chr17 and the derivative chr17. The five duplicated regions from chr1 are shown in different colors whereas the non-duplicated regions are shown in gray. Although the segments are not scaled, the representation shows the relative positions and orientations, and the sizes of the segments involved in the rearrangement are shown. The five protein-coding genes (MROH9, FMO3, FMO2, FMO1, and FMO4) included in the chr1_D region are represented at the top of the chr1_D segment and are indicated with an asterisk. The insertion point in chr17 is indicated with a black arrowhead and a vertical red line, and the concomitant inversion of the light blue segment in the chr17 is indicated by clockwise arrows. The relative position of the primers used for the segregation analysis shown in (C) are represented as gray arrows in the diagram of the derivative chr17, and below the diagram, the approximate positions of 20–64 kb nanopore long reads, including four which span multiple breakpoints, are shown in pink. On the right is shown a circos plot visualization of the rearrangement identified in the family. (C) Segregation analysis using a duplex PCR assay based on three primers to detect the mutant allele (upper fragment; product from chr1-forward and chr17-reverse primers) and the normal allele (lower fragment; product from chr17-forward and chr17-reverse primers). Sample IDs are shown at the top of the agarose gel with the affected individuals in red color, and “ctl” indicates a genomic sample from a control individual unrelated to this family. (D) UCSC track showing the coordinates (hg19) and genes in the region of interest in the chr17. The insertion site of the duplicated regions from chr1 is indicated by the red line, whereas the concomitant inversion in the chr17 is shown in blue highlight. At the bottom is shown a scaled representation of the TAD landscape based on Franke et al., showing the genes as blue boxes, the TAD boundaries as hexagonal symbols, and below is represented the theoretical prediction of the TAD landscape in the derivative chr17. For simplicity, only the two larger segments (chr1_D and chr1_H) containing human craniofacial enhancers are depicted. Note that the five protein-coding genes (FMO4, FMO1, FMO2, FMO3, and MROH9) represented at the top of the inserted chr1_D are positioned upstream of the TAD boundary (which is also included in chr1_D) and are not part of the neo-TAD containing the KCNJ2/KCNJ16 genes.
Figure 2
Figure 2
Hi-C data and deepC predictions at the KCNJ2-KCNJ16 locus On the top, the distance normalized Hi-C data of IMR90 cells is shown for the region of interest at chr17, whereas deepC predictions are shown for the reference sequence (middle panel) and for the CR-containing equivalent variant (lower panel), where the position of the inserted CR from chr1 is indicated. The color-coded values represent the interaction frequency in normalized Hi-C and predictions. UCSC tracks with the coordinates (hg19) and genes at the KCNJ2-KCNJ16 locus are shown below the predictions.

References

    1. Bamshad M.J., Nickerson D.A., Chong J.X. Mendelian Gene Discovery: Fast and Furious with No End in Sight. Am. J. Hum. Genet. 2019;105:448–455. - PMC - PubMed
    1. Spielmann M., Mundlos S. Looking beyond the genes: the role of non-coding variants in human disease. Hum. Mol. Genet. 2016;25:R157–R165. - PubMed
    1. Spielmann M., Lupiáñez D.G., Mundlos S. Structural variation in the 3D genome. Nat. Rev. Genet. 2018;19:453–467. - PubMed
    1. Anania C., Lupiáñez D.G. Order and disorder: abnormal 3D chromatin organization in human disease. Brief. Funct. Genomics. 2020;19:128–138. - PMC - PubMed
    1. Strzelec K., Dziedzic A., Łazarz-Bartyzel K., Grabiec A.M., Gutmajster E., Kaczmarzyk T., Plakwicz P., Gawron K. Clinics and genetic background of hereditary gingival fibromatosis. Orphanet J. Rare Dis. 2021;16:492. - PMC - PubMed

Substances