. 2024 Nov;11(41):e2404510.
doi: 10.1002/advs.202404510. Epub 2024 Sep 10.

Molecular Profiling Defines Three Subtypes of Synovial Sarcoma

Affiliations

Molecular Profiling Defines Three Subtypes of Synovial Sarcoma

Yi Chen et al. Adv Sci (Weinh). 2024 Nov.

Abstract

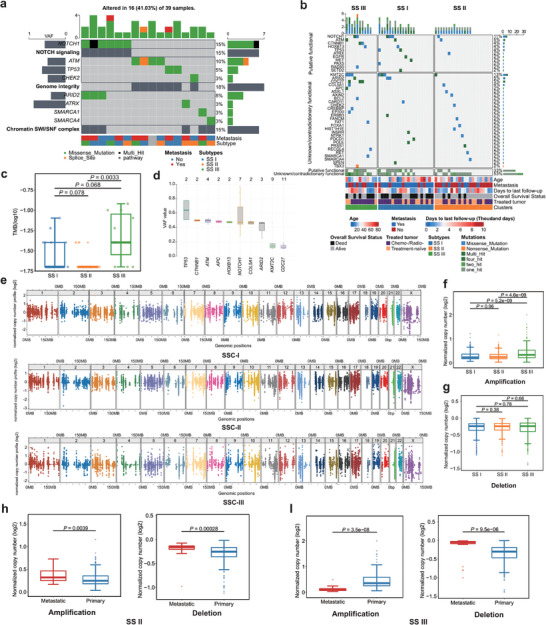
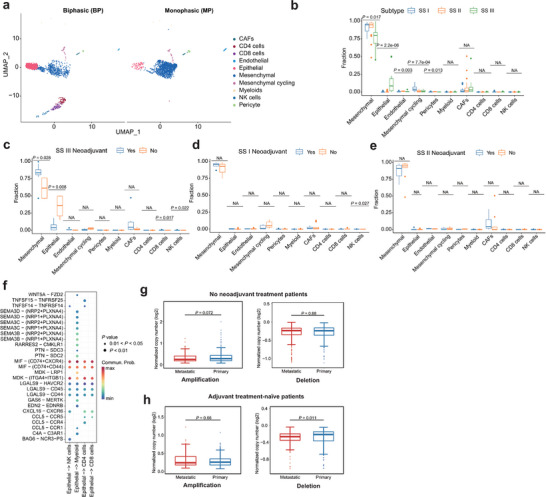
Synovial Sarcomas (SS) are characterized by the presence of the SS18::SSX fusion gene, which protein product induce chromatin changes through remodeling of the BAF complex. To elucidate the genomic events that drive phenotypic diversity in SS, we performed RNA and targeted DNA sequencing on 91 tumors from 55 patients. Our results were verified by proteomic analysis, public gene expression cohorts and single-cell RNA sequencing. Transcriptome profiling identified three distinct SS subtypes resembling the known histological subtypes: SS subtype I and was characterized by hyperproliferation, evasion of immune detection and a poor prognosis. SS subtype II and was dominated by a vascular-stromal component and had a significantly better outcome. SS Subtype III was characterized by biphasic differentiation, increased genomic complexity and immune suppression mediated by checkpoint inhibition, and poor prognosis despite good responses to neoadjuvant therapy. Chromosomal abnormalities were an independent significant risk factor for metastasis. KRT8 was identified as a key component for epithelial differentiation in biphasic tumors, potentially controlled by OVOL1 regulation. Our findings explain the histological grounds for SS classification and indicate that a significantly larger proportion of patients have high risk tumors (corresponding to SS subtype I) than previously believed.

Keywords: BAF complex; copy number alterations; multi‐omics; synovial sarcoma; transcriptomics.


Conflict of interest statement

The authors declare no conflict of interest.

Figures

Figure 1
Figure 1
Synovial sarcoma subtypes and functional annotations a,b) The study workflow, including a) discovery and b) validation cohorts. c) UMAP plot of SS subtypes and metastatic status distributions. d) Kaplan‐Meier curve of clusters of metastasis‐free survival in discovery cohort at top 14% mRNAs variance (Log‐rank test, P = 0.013). e) Kaplan‐Meier curve of clusters of metastasis‐free survival in patients at top 14% gene variance applied at GSE40021 validation cohort (Log‐rank test, P = 0.01). f) Distributions of the ssGSEA score of upregulated genes in the oncogenic program across three SS subtypes. Middle line: median; box edges: 25th and 75th percentiles. Mann‐Whitney U test. g) Heatmap of the three SS subtypes. Clinicopathological characteristics (top) of the 55 synovial sarcoma patients are shown in the annotation, and different colors represent the characteristics and subtypes. Molecular data (bottom) from 55 patients profiled with mRNA and copy number variations are depicted. The statistical differences in categorical variables with three subtypes were compared using Fisher's exact test; Continuous variables were compared using the Kruskal‐Wallis test. *p < 0.05, **p < 0.01, ***p < 0.001. h) Association of five gene modules with 50 Hallmarks on ssGSEA scores. Spearman rank correlation. The shade of the color represents the levels of correlations, the size of circles represents the p‐value.
Figure 2
Figure 2
Proteomics data of three SS subtypes a) UMAP plot of SS subtypes in the proteome level. b,c) The correlation of DEGs between RNA and protein levels, Spearman rank correlation. d,e) The functional enrichment between d) SS I, e) SS II, and SS III in the RNA/protein level. Gene ratio: In the enrichment analysis, the number of gene symbols (overlapping RNAs and proteins) at the leading edge is divided by the total number of gene symbols in the given pathway. The size of the circles represents the number of enriched proteins at the leading edge.
Figure 3
Figure 3
Genomic landscape of three SS subtypes a) Top three enrichment pathways of mutated genes and annotated below with metastasis and subtypes b) Distributions of the tumor mutation burdens (per 50 MB, logarithmic scale) in the three SS subtypes. Middle line: median; box edges: 25th and 75th percentiles. Mann‐Whitney U test. c) Distributions of variant allele frequency in mutated genes. Middle line: median; box edges: 25th and 75th percentiles. d) Distributions of variant allele frequency in mutated genes. Middle line: median; box edges: 25th and 75th percentiles. e) Chromosome scatter plots depicting the normalized copy numbers of three SS subtypes. f,g) The normalized copy number distributions of f) amplification and g) deletions in the three SS subtypes. Middle line: median; box edges: 25th and 75th percentiles. Mann‐Whitney U test. h) Normalized copy number distributions of amplifications and deletions between primary and metastatic in SS II patients. Middle line: median; box edges: 25th and 75th percentiles. Mann‐Whitney U test. i) Normalized copy number distributions of amplifications and deletions between primary and metastatic in SS III patients. Middle line: median; box edges: 25th and 75th percentiles. Mann‐Whitney U test.
Figure 4
Figure 4
Tumor microenvironment of SS subtypes: a–c) The distributions of immune and stroma cell types across SS subtypes by three deconvolutional approaches, including a) ESTIMATE, b) CIBERSORT, and c) MCPCounter, respectively, Middle line: median; box edges: 25th and 75th percentiles. Kruskal‐Wallis test. d) Heatmap of the three SS subtypes on the mRNA levels of 23 inhibitory and 36 stimulatory immune checkpoints. Clinicopathological characteristics (top) of the 55 SS patients are shown in the annotation, and different colors represent the characteristics and subtypes. The statistical differences in categorical variables were compared using the Fisher's exact test; Continues variables were compared using Kruskal‐Wallis test. *p < 0.05, **p < 0.01, ***p < 0.001. e,f) Distributions of the gene expressions of CD274 e) and PDCD1 f) in three synovial sarcoma subtypes. Middle line: median; box edges: 25th and 75th percentiles. Mann‐Whitney U test. g–i) Distributions of the T cell exclusion, dysfunction, and TIDE score in three SS subtypes. Middle line: median; box edges: 25th and 75th percentiles. Mann‐Whitney U test.
Figure 5
Figure 5
Treatment effects of SS subtypes a) UMAP plot of scRNA‐seq profiles in BP and MP tumors, colored by cell types. b) The distributions of cell types in three SS subtypes after CIBERSORTx deconvolution. Middle line: median; box edges: 25th and 75th percentiles. Kruskal‐Wallis test. c–e) Cell type distributions in neoadjuvant and no neoadjuvant treated SS III c), SS I d), and SS II e) patients after CIBERSORTx deconvolution. Middle line: median; box edges: 25th and 75th percentiles. Mann‐Whitney U test. f) Ligand–receptor pairs between epithelial cells and immune cells (NK cells, myeloid cells, CD4 cells, and CD8 cells. g) Normalized copy number distributions of amplifications and deletions between primary and metastatic in no neoadjuvant treatment patients. Middle line: median; box edges: 25th and 75th percentiles. Mann‐Whitney U test. h) Normalized copy number distributions of amplifications and deletions between primary and metastatic in adjuvant treatment‐naïve patients. Middle line: median; box edges: 25th and 75th percentiles. Mann‐Whitney U test.
Figure 6
Figure 6
The regulation of mesenchymal to epithelial transitions in SS. a,b) The trajectory plots showing the dynamic development of epithelial, mesenchymal, and mesenchymal cycling cells in a) BP and b) MP patients and their pseudotime curve. c) Venn diagram depicting the overlap of the MET key genes involved in oncogenic program upregulated genes, Bulk RNA‐seq DEGs (SS III versus SS II), scRNA‐seq DEGs (BP‐epithelial versus MP‐epithelial), and scRNA‐seq DEGs (epithelial versus other cells). d) The predicted gene interaction network between significant BAF complex genes, epithelial specific oncogenic genes, and other putative additional relevant genes. e) KRT8 immunoreactivity in moderate scoring of SS III(T68). f) Perturbation effects of knockdown MET key genes in five SS cell lines. g) Schematic overview of predicted TFs of MET key genes. h) Venn diagram depicting the overlap of the MET key genes involved in predicted TFs of KRT8, Bulk RNA‐seq DEGs (SS III versus SS II), and scRNA‐seq DEGs (epithelial versus other cells) i) The correlation between expression levels of KRT8 and OVOL1, Spearman rank correlation.

Similar articles

Cited by

References

    1. Nielsen T. O., Poulin N. M., Ladanyi M., Cancer Discov. 2015, 5, 124. - PMC - PubMed
    1. Thway K., Fisher C., Ann. Diagn. Pathol. 2014, 18, 369. - PubMed
    1. Fletcher C. D. M. B. J., Hogendoorn P. C. W., Mertens F., WHO Classification of Tumours of Soft Tissue and Bone, Vol. 5, IARC Press, 2013.
    1. dos Santos N. R., de Bruijn D. R., van Kessel A. G., Genes Chromosomes Cancer 2001, 30, 1. - PubMed
    1. Skytting B., Nilsson G., Brodin B., Xie Y., Lundeberg J., Uhlen M., Larsson O., J. Natl. Cancer Inst. 1999, 91, 974. - PubMed

Substances