Observational Study
. 2024 Nov;11(11):2877-2890.
doi: 10.1002/acn3.52197. Epub 2024 Sep 10.

Endogenous tPA levels: A biomarker for discriminating hemorrhagic stroke from ischemic stroke and stroke mimics

Affiliations
Observational Study

Endogenous tPA levels: A biomarker for discriminating hemorrhagic stroke from ischemic stroke and stroke mimics

Melissa Jauquet et al. Ann Clin Transl Neurol. 2024 Nov.

Abstract

Objective: Stroke is the leading cause of death and disability. Timely differentiation between ischemic stroke, hemorrhagic stroke, and stroke mimics is critical for tailored treatment and triage. To accelerate the identification of stroke's subtype, we propose to use the levels of circulating tPA as a biomarker.

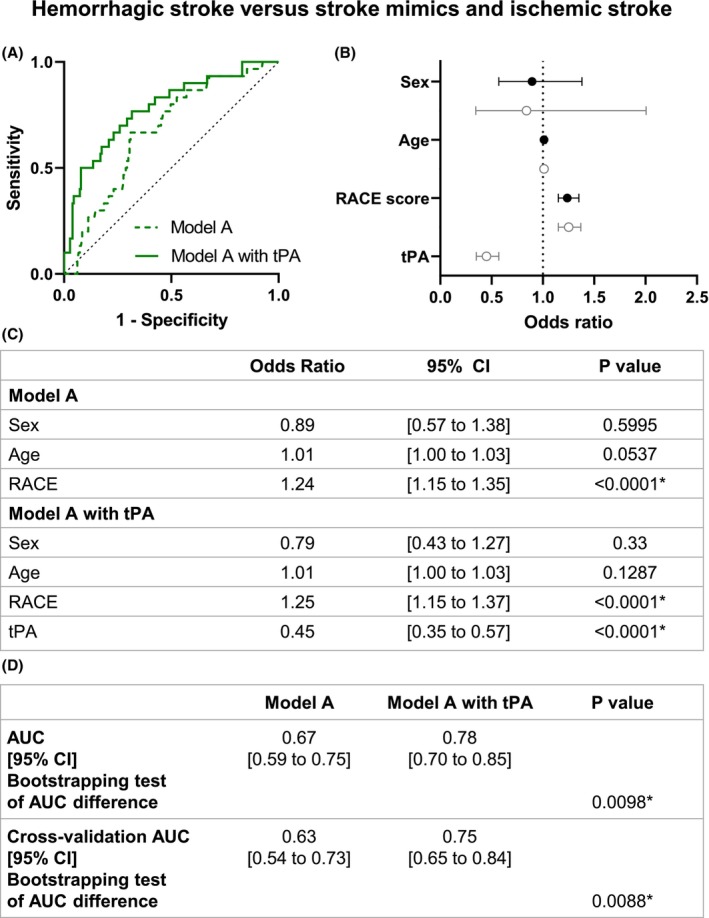
Methods: Biostroke is an observational study performed at the Caen Hospital. We quantified tPA levels in 110 patients with ischemic strokes, 30 patients with hemorrhagic strokes, and 67 stroke mimic patients upon their arrival at the emergency. Two logistic regression models were formulated: one with parameters measurable in an ambulance (Model A) and one with parameters measurable at the hospital (Model H). These models were both tested with or without plasma tPA measurements. Our initial assessment involved evaluating the effectiveness of both models in distinguishing between hemorrhagic strokes, ischemic strokes, and stroke mimics within our study cohort.

Results: Plasmatic tPA levels exhibit significant distinctions between hemorrhagic, ischemic, and mimic stroke patients (1.8; 2.5; 2.4 ng/mL, respectively). The inclusion of tPA in model A significantly enhances the classification accuracy of hemorrhagic patients only, increasing identification from 0.67 (95% CI, 0.59 to 0.75) to 0.78 (95% CI, 0.7 to 0.85) (p = 0.0098). Similarly, in model H, classification accuracy of hemorrhagic patients significantly increased with the addition of tPA, rising from 0.75 (95% CI, 0.67 to 0.83) without tPA to 0.86 (95% CI, 0.81 to 0.91) with tPA (p = 0.024).

Interpretations: Our findings underscore the valuable role of tPA levels in distinguishing between stroke subtypes.


Conflict of interest statement

The authors declare no conflicts of interests.

Figures

Figure 1
Figure 1
Flow chart of the selected patients within the Biostroke collection. Flow chart of patients selected for the study.
Figure 2
Figure 2
Plasmatic levels of antigenic tPA. Comparison of plasmatic tPA values between hemorrhagic stroke, ischemic stroke and stroke mimics. (A) Box and whisker plots with min., max., 25th, 50th (median) and 75th percentiles. Each circles represent a value for one tPA measurement. Sample size and plasmatic levels of antigenic tPA comparison between hemorrhagic stroke versus ischemic stroke (B); hemorrhagic stroke versus stroke mimics (C); and ischemic stroke versus stroke mimics (D). Data are presented as median (IQR) Mann–Whitney U test. CI, confidence interval; IQR, interquartile range; ns, not significant. ***p < 0.001.
Figure 3
Figure 3
Model A logistic regression of hemorrhagic stroke versus ischemic stroke and stroke mimics patients. (A) ROC curve representation for model A logistic regression with or without tPA levels. The logistic regression models without (AUC = 0.67) and with tPA level (AUC = 0.78) are represented with a continued line and a dotted line, respectively. (B) Logistic regression plot of odds ratios and 95% CI; model A (in black) and model A with tPA (in gray). (C) Models of the logistic regression analyses for comparison between hemorrhagic stroke versus nonhemorrhagic stroke. (D) Statistical comparison of both resulting AUC was performed by bootstrapping model predictions. Model predictions were additionally computed using 10‐fold cross‐validation. AUC, area under curve; CI, confidence interval; RACE, Rapid Arterial oCclusion Evaluation. *p < 0.05.
Figure 4
Figure 4
Model H logistic regression of hemorrhagic stroke versus ischemic stroke and stroke mimics patients. (A) ROC curve representation for model H logistic regression with or without tPA levels. The logistic regression models without (AUC = 0.75) and with tPA level (AUC = 0.86) are represented with a continued line and a dotted line, respectively. (B) Logistic regression plot of odds ratios and 95% CI; model H (in black) and model H with tPA (in gray). (C) Models of the logistic regression analyses for comparison between hemorrhagic stroke versus nonhemorrhagic stroke (ischemic stroke and stroke mimics). (D) Statistical comparison of both resulting AUC was performed by bootstrapping model predictions. Model predictions were additionally computed using 10‐fold cross‐validation. AUC, area under curve; CI, confidence interval; NIHSS, National Institutes of Health Stroke Scale; SBP, systolic blood pressure. *p < 0.05.
Figure 5
Figure 5
Model A logistic regression of ischemic stroke versus hemorrhagic stroke and stroke mimics patients. (A) ROC curve representation for model A logistic regression with or without tPA levels. The logistic regression models without (AUC = 0.71) and with tPA level (AUC = 0.71) are represented with a continued line and a dotted line, respectively. (B) Logistic regression plot of odds ratios and 95% CI; model A (in black) and model A with tPA (in gray). (C) Models of the logistic regression analyses for comparison between hemorrhagic stroke versus nonhemorrhagic stroke. (D) Statistical comparison of both resulting AUC was performed by bootstrapping model predictions. Model predictions were additionally computed using 10‐fold cross‐validation. AUC, area under curve; CI, confidence interval; RACE, Rapid Arterial oCclusion Evaluation. *p < 0.05.
Figure 6
Figure 6
Model H logistic regression of ischemic stroke versus hemorrhagic stroke and stroke mimics patients. (A) ROC curve representation for model H logistic regression with or without tPA levels. The logistic regression models without (AUC = 0.65) and with tPA level (AUC = 0.65) are represented with a continued line and a dotted line, respectively. (B) Logistic regression plot of odds ratios and 95% CI; model H (in black) and model H with tPA (in gray). (C) Models of the logistic regression analyses for comparison between hemorrhagic stroke versus nonhemorrhagic stroke (ischemic stroke and stroke mimics). (D) Statistical comparison of both resulting AUC was performed by bootstrapping model predictions. Model predictions were additionally computed using 10‐fold cross‐validation. AUC, area under curve; CI, confidence interval; NIHSS, National Institutes of Health Stroke Scale; SBP, systolic blood pressure. *p < 0.05.
Figure 7
Figure 7
Model A logistic regression of stroke mimics versus hemorrhagic and ischemic stroke patients. (A) ROC curve representation for model A logistic regression with or without tPA levels. The logistic regression models without (AUC = 0.84) and with tPA level (AUC = 0.84) are represented with a continued line and a dotted line, respectively. (B) Logistic regression plot of odds ratios and 95% CI; model A (in black) and model A with tPA (in gray). (C) Models of the logistic regression analyses for comparison between hemorrhagic stroke versus nonhemorrhagic stroke. (D) Statistical comparison of both resulting AUC was performed by bootstrapping model predictions. Model predictions were additionally computed using 10‐fold cross‐validation. AUC, area under curve; CI, confidence interval; RACE, Rapid Arterial oCclusion Evaluation. *p < 0.05.
Figure 8
Figure 8
Model H logistic regression of stroke mimics versus hemorrhagic and ischemic stroke patients. (A) ROC curve representation for model H logistic regression with or without tPA levels. The logistic regression models without (AUC = 0.79) and with tPA level (AUC = 0.81) are represented with a continued line and a dotted line, respectively. (B) Logistic regression plot of odds ratios and 95% CI; model H (in black) and model H with tPA (in gray). (C) Models of the logistic regression analyses for comparison between hemorrhagic stroke versus nonhemorrhagic stroke (ischemic stroke and stroke mimics). (D) Statistical comparison of both resulting AUC was performed by bootstrapping model predictions. Model predictions were additionally computed using 10‐fold cross‐validation. AUC: Area under curve. SBP: Systolic blood pressure. NIHSS = National Institutes of Health Stroke Scale. CI: confidence Interval. *p < 0.05.

References

    1. Feigin VL, Brainin M, Norrving B, et al. World Stroke Organization (WSO): global stroke fact sheet 2022. Int J Stroke. 2022;17(1):18‐29. - PubMed
    1. Tsao CW, Aday AW, Almarzooq ZI, et al. Heart Disease and Stroke Statistics‐2022 update: a report from the American Heart Association. Circulation. 2022;145(8):e153‐e639. - PubMed
    1. McClelland G, Rodgers H, Flynn D, Price CI. The frequency, characteristics and aetiology of stroke mimic presentations: a narrative review. Eur J Emerg Med. 2019;26(1):2‐8. - PubMed
    1. Liberman AL, Prabhakaran S. Stroke chameleons and stroke mimics in the emergency department. Curr Neurol Neurosci Rep. 2017;17(2):15. - PubMed
    1. Menon BK, Singh N, Sylaja PN. Tenecteplase use in patients with acute ischaemic stroke. Lancet. 2023;401(10377):618‐619. - PubMed

Publication types

LinkOut - more resources