. 2024 Sep 10:7:0459.
doi: 10.34133/research.0459. eCollection 2024.

Dihydroartemisinin Regulated the MMP-Mediated Cellular Microenvironment to Alleviate Rheumatoid Arthritis

Affiliations

Dihydroartemisinin Regulated the MMP-Mediated Cellular Microenvironment to Alleviate Rheumatoid Arthritis

Qiuyan Guo et al. Research (Wash D C). .

Abstract

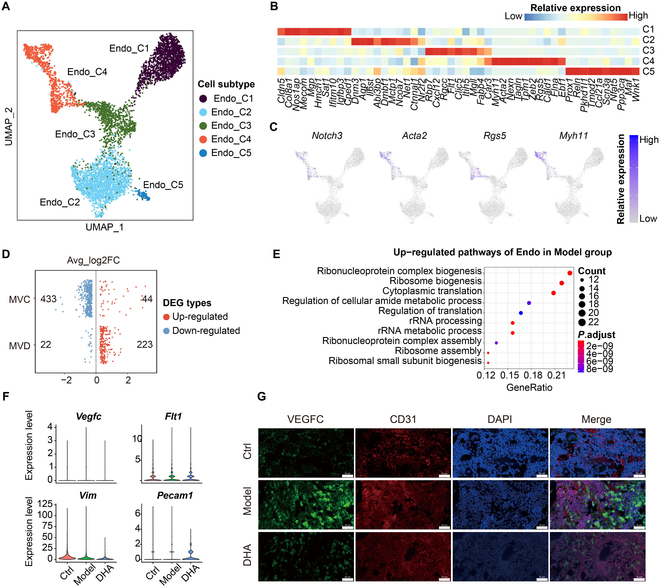
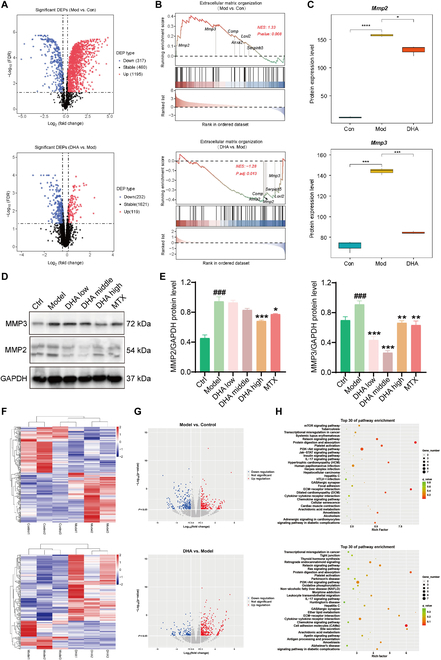
Rheumatoid arthritis (RA) is an autoimmune disease with features of synovial inflammation, cartilage erosion, bone destruction, and pain and is currently lacking a satisfactory treatment strategy. Dihydroartemisinin (DHA), the active metabolite of artemisinin, has exhibited outstanding suppressive effects on RA without obvious side effects. However, the underlying mechanisms remain unclear, which limits its further clinical application. The purpose of this study is to reveal the pharmacodynamic mechanism of DHA against RA by means of a combination of single-cell RNA sequencing (RNA-seq), proteomics, as well as transcriptomics both in vivo and in vitro. In our results, DHA effectively reduced the degree of redness, swelling, and pain in RA rats and dramatically changed the synovial tissue microenvironment under the pathological state. Within this microenvironment, fibroblasts, macrophages, B cells, and endothelial cells were the major affected cell types, primarily through DHA targeting the extracellular matrix (ECM) structural constituent signaling pathway. In addition, we confirmed that DHA regulated the ECM by modulating matrix metalloproteinase 2 (MMP2) and MMP3 in the synovial tissue of RA rats. Moreover, DHA induced apoptosis in MH7A cells, further validating the bioinformatics data. In conclusion, DHA effectively reduced the inflammatory response and improved the immune microenvironment in synovial tissue by inhibiting MMP2 and MMP3. Our findings provide a basis for the application of DHA in the treatment of RA.


Conflict of interest statement

Competing interests: The authors declare that they have no competing interests.

Figures

Fig. 1.
Fig. 1.
Effect of DHA on RA rats. (A) Mechanical pain threshold of rats during the DHA administration. (B) Left hind limb ankle photos of rats after the DHA administration. (C) Arthritis index of rats during the DHA administration cycle. (D) Joint swelling of rats at the end of administration. (E) H&E and TRAP staining of knee joints (40×). (F) Effects of DHA on IL-17, MMP9, TRAP, and CTSK in rats’ serum (n = 6). (G) Morphological changes of ankle and knee joints of AIA rats. (H) Impact of DHA on bone microstructure parameters of the ankle (left 3 panels) and knee joints (right 3 panels) (n = 3). The data are presented as the mean ± SD. #P < 0.05, ##P < 0.01, ###P < 0.001 compared to the Control (Ctrl) group respectively; *P < 0.05, **P < 0.01, ***P < 0.001 compared to the Model group respectively.
Fig. 2.
Fig. 2.
The treatment effect of DHA upon cellular composition and fibroblast of knee synovium in RA rats. (A) The Uniform Manifold Approximation and Projection (UMAP) plot shows the presence of various cell types in the scRNA-seq dataset, including fibroblasts (Fibro), endothelial cells (Endo), myocytes, B cells, macrophages (Macro), neutrophils (Neutro), platelets, and red blood cells (RBC). (B) The bubble plot illustrates the marker genes specifically expressed by each cell type in the scRNA-seq dataset. (C) The UMAP plot shows the subclustering and annotation of fibroblasts, dividing into 4 subtypes: Fibro_S1, Fibro_S2, Fibro_S3, and Fibro_S4. (D) The heatmap shows the top 15 marker genes specifically expressed by each fibroblast subgroup. (E) The dotplot indicates the gene ontology (GO) functional pathways based on the significantly up-regulated genes of Model versus Ctrl (MVC) and Model versus DHA (MVD) groups. (F) The dotplot indicates the GO functional pathways based on the significantly down-regulated genes of MVC and MVD groups.
Fig. 3.
Fig. 3.
DHA exerted an anti-inflammatory effect on macrophages and B cells in RA rats. (A) UMAP plot of 3 distinct subtypes of macrophage cells. (B) The violin plot displays the relative expression levels of marker genes across different macrophage subtypes. (C) Ratio of M1/M2 macrophages in different groups. (D) The scatter dot plots illustrate the differentially expressed genes (DEGs) that were up-regulated or down-regulated in each macrophage subtype within the MVC and MVD groups. (E) GO pathway enrichment analysis was performed based on the overlapping up-regulated DEGs in all macrophage subtypes within the MVC and MVD groups. (F) The UMAP visualization demonstrates the presence of 3 distinct subtypes of B cells. (G) The violin plot displays the relative expression levels of marker genes across different B cell subtypes. (H) The Sankey diagram depicts the cell proportions and numbers of the 3 B cell subtypes in different groups. (I) The scatterplots illustrate the up-regulated or down-regulated DEGs in each B cell subtype within the MVC and MVD groups. (J and K) GO pathway enrichment analysis was performed on the overlapping up-regulated (J) and down-regulated (K) DEGs in all B cell subtypes within the MVC and MVD groups.
Fig. 4.
Fig. 4.
The treatment effect of DHA upon endothelial cells in rat synovial tissues. (A) The UMAP plots show the unsupervised clustering of endothelial (Endo) subtypes. (B) The heatmap plot shows the relative expression of markers of endothelial subtypes. (C) The feature plots show the relative expression of markers of endothelial subtypes. (D) The plot shows the log2 fold change (log2FC) value in the Model group. The scatter point in red or blue indicates the up-regulated or down-regulated DEGs, respectively. (E) The dotplot indicates the GO functional pathways based on the significantly overlapping up-regulated genes of MVC and MVD groups. (F) Violin plot shows expression of Vegfc, Flt1, Vim, and Pecam1 in the Endo across Ctrl, Model, and DHA groups. (G) Immunofluorescence images show the expression levels of VEGFC (green) and CD31 (endothelial marker, red) in rat synovial tissues.
Fig. 5.
Fig. 5.
Effect of DHA on hippocampus and synovial protein expression in RA rats. (A) The volcano plots display the expressions of differentially expressed proteins (DEPs) in both MVC and MVD groups. (B) The rank in the ordered dataset reveals DEPs involved in the extracellular matrix (ECM) organization signaling pathway. (C) Proteomics datasets indicate the expression levels of MMP2 and MMP3. (D) WB validation was conducted on MMP2 and MMP3. (E) Statistical analysis of WB. The data are presented as the mean ± SD (n = 3). ###P < 0.001, significance between Model versus Ctrl; *P < 0.05, **P < 0.01, ***P < 0.001, significance between DHA or MTX versus Model. (F) The heatmap plots illustrate the relative expressions of DEGs in MVC and MVD groups. (G) The volcano plots depict the relative expressions of DEGs in MVC and MVD groups. (H) The KEGG analysis reveals the enriched pathways in MVC and MVD groups.
Fig. 6.
Fig. 6.
Effects of DHA on mitochondrial membrane potential, apoptosis, and the intracellular Ca2+ concentration of MH7A cells. (A) Impact of DHA on the cell viability of MH7A cells (n = 3). (B) The cell apoptosis rate was quantified. (C) The ratio of red–green fluorescence intensity indicating mitochondrial membrane potential was quantified. (D) MH7A cells were analyzed for apoptosis (n = 3). (E) MH7A cells were analyzed for mitochondrial membrane (n = 3). (F) Intracellular Ca2+ concentration in MH7A cells was detected using fluorescence imaging. (G) Flow cytometry was performed to quantify the intracellular Ca2+ concentration in MH7A cells. (H) Statistical analysis of Ca2+ concentration. The data are presented as the mean ± SD. *P < 0.05, **P < 0.01, ***P < 0.001, compared to the Ctrl group.

References

    1. Zhang C, Ma P, Qin A, Wang L, Dai K, Liu Y, Zhao J, Lu Z. Current immunotherapy strategies for rheumatoid arthritis: The immunoengineering and delivery systems. Research. 2023;6:0220.
    1. Smolen JS, Aletaha D, McInnes IB. Rheumatoid arthritis. Lancet. 2016;388(10055):2023–2038. - PubMed
    1. Smolen JS, Landewé RBM, Bijlsma JWJ, Burmester GR, Dougados M, Kerschbaumer A, McInnes IB, Sepriano A, Vollenhoven RF, Wit M, et al. . EULAR recommendations for the management of rheumatoid arthritis with synthetic and biological disease-modifying antirheumatic drugs: 2019 update. Ann Rheum Dis. 2020;79(6):685–699. - PubMed
    1. Du Y, Li C, Zhang Y, Xiong W, Wang F, Wang J, Zhang Y, Deng L, Li X, Chen W, et al. . In situ-activated phospholipid-mimic artemisinin prodrug via injectable hydrogel Nano/microsphere for rheumatoid arthritis therapy. Research. 2022;2022:0003.
    1. Agca R, Heslinga SC, Rollefstad S, Heslinga M, McInnes IB, Peters MJ, Kvien TK, Dougados M, Radner H, Atzeni F, et al. . EULAR recommendations for cardiovascular disease risk management in patients with rheumatoid arthritis and other forms of inflammatory joint disorders: 2015/2016 update. Ann Rheum Dis. 2017;76(1):17–28. - PubMed

LinkOut - more resources