. 2024 Aug 27:15:1431411.
doi: 10.3389/fimmu.2024.1431411. eCollection 2024.

Different polarization and functionality of CD4+ T helper subsets in people with post-COVID condition

Affiliations

Different polarization and functionality of CD4+ T helper subsets in people with post-COVID condition

Clara Sánchez-Menéndez et al. Front Immunol. .

Abstract

Introduction: After mild COVID-19 that does not require hospitalization, some individuals develop persistent symptoms that may worsen over time, producing a multisystemic condition termed Post-COVID condition (PCC). Among other disorders, PCC is characterized by persistent changes in the immune system that may not be solved several months after COVID-19 diagnosis.

Methods: People with PCC were recruited to determine the distribution and functionality of CD4+ T helper (Th) subsets in comparison with individuals with mild, severe, and critical presentations of acute COVID-19 to evaluate their contribution as risk or protective factors for PCC.

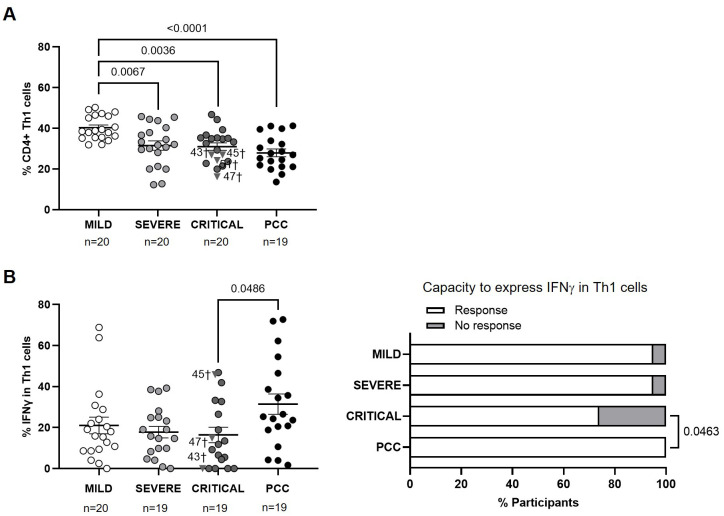
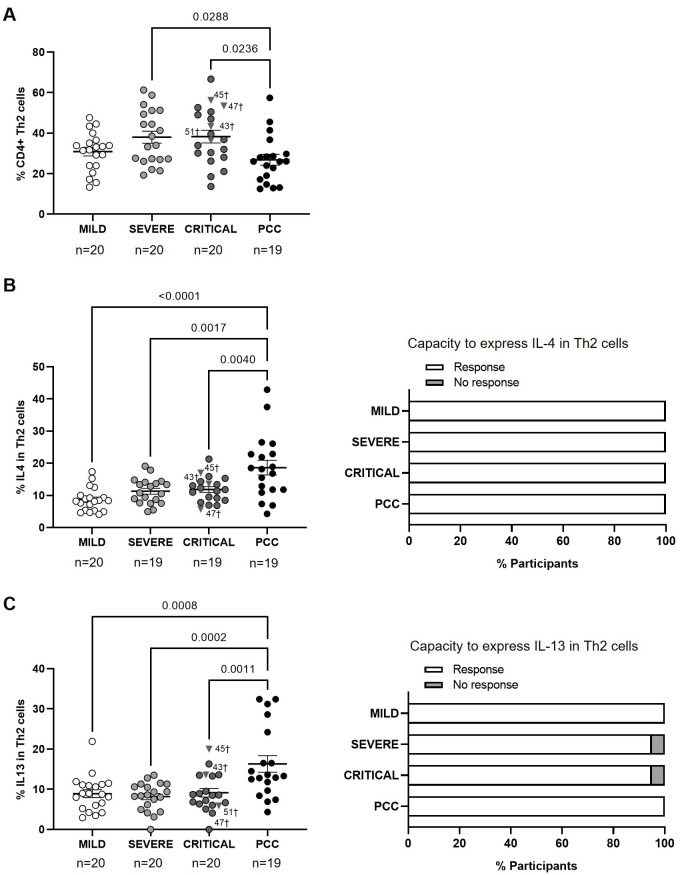
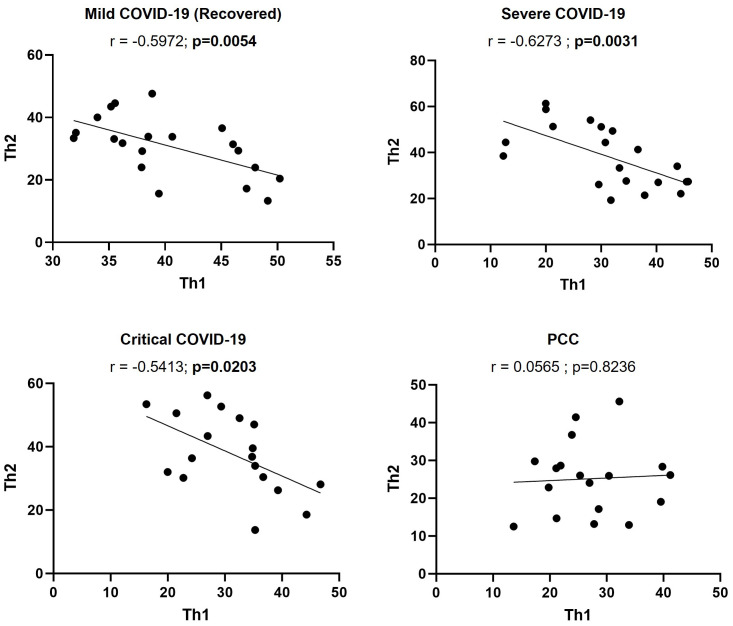
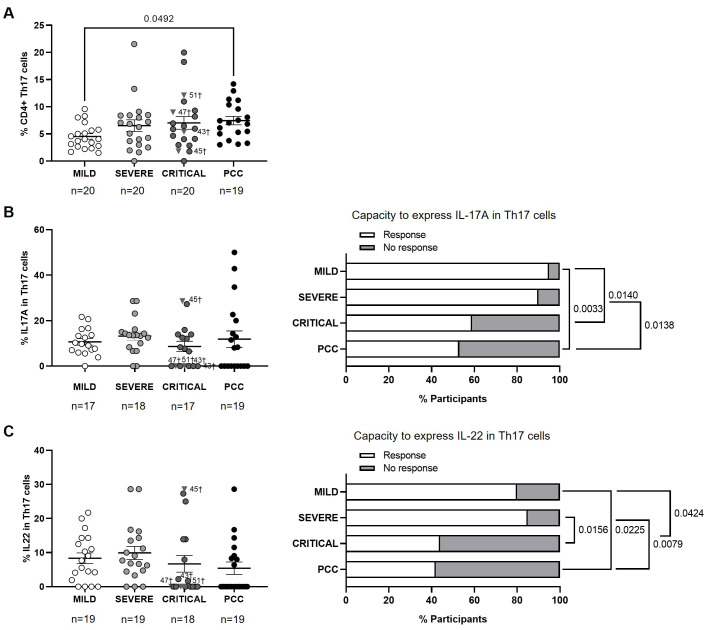
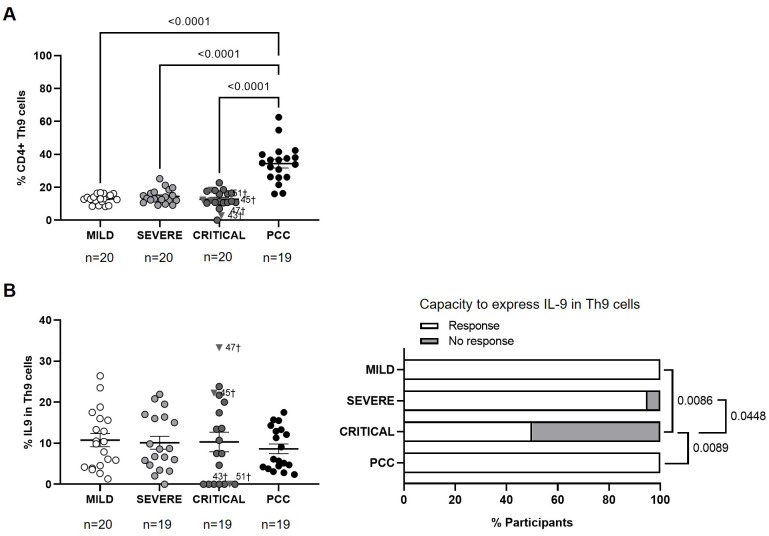
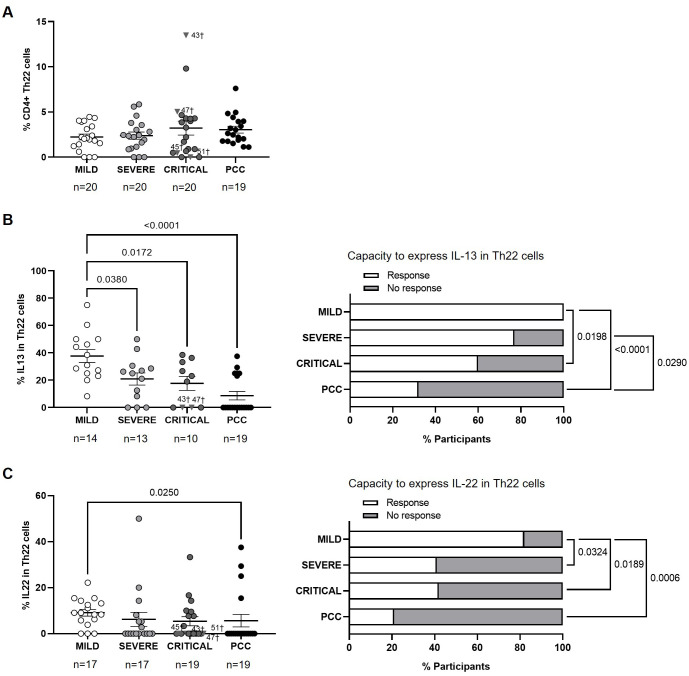
Results: People with PCC showed low levels of Th1 cells, similar to individuals with severe and critical COVID-19, although these cells presented a higher capacity to express IFNγ in response to stimulation. Th2/Th1 correlation was negative in individuals with acute forms of COVID-19, but there was no significant Th2/Th1 correlation in people with PCC. Th2 cells from people with PCC presented high capacity to express IL-4 and IL-13, which are related to low ventilation and death associated with COVID-19. Levels of proinflammatory Th9 and Th17 subsets were significantly higher in people with PCC in comparison with acute COVID-19, being Th1/Th9 correlation negative in these individuals, which probably contributed to a more pro-inflammatory than antiviral scenario. Th17 cells from approximately 50% of individuals with PCC had no capacity to express IL-17A and IL-22, similar to individuals with critical COVID-19, which would prevent clearing extracellular pathogens. Th2/Th17 correlation was positive in people with PCC, which in the absence of negative Th1/Th2 correlation could also contribute to the proinflammatory state. Finally, Th22 cells from most individuals with PCC had no capacity to express IL-13 or IL-22, which could increase tendency to reinfections due to impaired epithelial regeneration.

Discussion: People with PCC showed skewed polarization of CD4+ Th subsets with altered functionality that was more similar to individuals with severe and critical presentations of acute COVID-19 than to people who fully recovered from mild disease. New strategies aimed at reprogramming the immune response and redirecting CD4+ Th cell polarization may be necessary to reduce the proinflammatory environment characteristic of PCC.

Keywords: CD4+ T cells; T helper polarization; Th1; Th17; Th2; cytokines; post-covid condition.


Conflict of interest statement

The authors declare that the research was conducted in the absence of any commercial or financial relationships that could be construed as a potential conflict of interest.

Figures

Figure 1
Figure 1
Levels of CD4+ Th1 cells and expression of IFNγ in individuals with acute COVID-19 and PCC. (A) Blood levels of CD4+ Th1 cells in individuals from each cohort of acute COVID-19 and PCC. (B) Intracellular expression of IFNγ in CD4+ Th1 cells upon stimulation in individuals from each cohort (left graph) and percentage of individuals whose CD4+ Th1 cells expressed (Response, open bar) or not (No response, light gray bar) IFNγ upon stimulation (right graph). Each dot in scatter plots corresponds to one sample and lines represent the mean ± standard error of the mean (SEM). Each symbol represents a different cohort: Mild COVID-19 (open circles), Severe COVID-19 (light gray circles), Critical COVID-19 (dark gray circles), and PCC (closed circles). Individuals from Critical cohort with exitus are identified with † symbol and their ID number: 43, 45, 47, and 51. Ordinary one-way ANOVA and Tukey post-test were applied to calculate the statistical significance between cohorts in scatter plots. Fisher´s exact test was used to calculate significance between cohorts in horizontal bar graphs. Significant p-values below 0.05 are represented.
Figure 2
Figure 2
Levels of CD4+ Th2 cells and expression of IL-4 and IL-13 in individuals with acute COVID-19 and PCC. (A) Blood levels of CD4+ Th2 cells in individuals from each cohort of acute COVID-19 and PCC. Intracellular expression of IL-4 (B) and IL-13 (C) in CD4+ Th2 cells upon stimulation in individuals from each cohort (left graphs) and percentage of individuals whose CD4+ Th2 cells expressed (Response, open bar) or not (No response, light gray bar) these cytokines upon stimulation (right graph). Each dot in scatter plots corresponds to one sample and lines represent the mean ± SEM. Each symbol represents a different cohort: Mild COVID-19 (open circles), Severe COVID-19 (light gray circles), Critical COVID-19 (dark gray circles), and PCC (closed circles). Individuals from Critical cohort with exitus are identified with † symbol and their ID number: 43, 45, 47, and 51. Ordinary one-way ANOVA and Tukey post-test were applied to calculate the statistical significance between cohorts in scatter plots. Fisher´s exact test was used to calculate significance between cohorts in horizontal bar graphs. Significant p-values below 0.05 are represented.
Figure 3
Figure 3
Correlation between the levels of CD4+ Th1 and Th2 cells in individuals with acute COVID-19 and PCC. Pearson’s coefficient r and p-values between the percentage of expression of CD4+ Th1 and Th2 cells were calculated for each cohort. Each dot corresponds to one sample and lines represent the linear regression.
Figure 4
Figure 4
Levels of CD4+ Th17 cells and expression of IL-17A and IL-22 in individuals with acute COVID-19 and PCC. (A) Blood levels of CD4+ Th17 cells in individuals from each cohort of acute COVID-19 and PCC. Intracellular expression of IL-17A (B) and IL-22 (C) in CD4+ Th17 cells upon stimulation in individuals from each cohort (left graphs) and percentage of individuals whose CD4+ Th17 cells expressed (Response, open bar) or not (No response, light gray bar) these cytokines upon stimulation (right graph). Each dot in scatter plots corresponds to one sample and lines represent the mean ± SEM. Each symbol represents a different cohort: Mild COVID-19 (open circles), Severe COVID-19 (light gray circles), Critical COVID-19 (dark gray circles), and PCC (closed circles). Individuals from Critical cohort with exitus are identified with † symbol and their ID number: 43, 45, 47, and 51. Kruskal-Wallis test and Dunn’s multiple comparisons test were applied to calculate the statistical significance between cohorts in scatter plots. Fisher´s exact test was used to calculate significance between cohorts in horizontal bar graphs. Significant p-values below 0.05 are represented.
Figure 5
Figure 5
Levels of CD4+ Th9 cells and expression of IL-9 in individuals with acute COVID-19 and PCC. (A) Blood levels of CD4+ Th9 cells in individuals from each cohort of acute COVID-19 and PCC. (B) Intracellular expression of IL-9 in CD4+ Th9 cells upon stimulation in individuals from each cohort (left graphs) and percentage of individuals whose CD4+ Th9 cells expressed (Response, open bar) or not (No response, light gray bar) these cytokines upon stimulation (right graph). Each dot in scatter plots corresponds to one sample and lines represent the mean ± SEM. Each symbol represents a different cohort: Mild COVID-19 (open circles), Severe COVID-19 (light gray circles), Critical COVID-19 (dark gray circles), and PCC (closed circles). Individuals from Critical cohort with exitus are identified with † symbol and their ID number: 43, 45, 47, and 51. Ordinary one-way ANOVA and Tukey post-test were applied to calculate the statistical significance between cohorts in scatter plots. Fisher´s exact test was used to calculate significance between cohorts in horizontal bar graphs. Significant p-values below 0.05 are represented.
Figure 6
Figure 6
Levels of CD4+ Th22 cells and expression of IL-13 and IL-22 in individuals with acute COVID-19 and PCC. (A) Blood levels of CD4+ Th22 cells in individuals from each cohort of acute COVID-19 and PCC. Intracellular expression of 13 (B) and IL-22 (C) in CD4+ Th22 cells upon stimulation in individuals from each cohort (left graphs) and percentage of individuals whose CD4+ Th22 cells expressed (Response, open bar) or not (No response, light gray bar) these cytokines upon stimulation (right graph). Each dot in scatter plots corresponds to one sample and lines represent the mean ± SEM. Each symbol represents a different cohort: Mild COVID-19 (open circles), Severe COVID-19 (light gray circles), Critical COVID-19 (dark gray circles), and PCC (closed circles). Individuals from Critical cohort with exitus are identified with † symbol and their ID number: 43, 45, 47, and 51. Ordinary one-way ANOVA and Tukey post-test and Kruskal-Wallis test and Dunn’s multiple comparisons test were applied according to data normality to calculate the statistical significance between cohorts in scatter plots. Fisher´s exact test was used to calculate significance between cohorts in horizontal bar graphs. Significant p-values below 0.05 are represented.

Similar articles

Cited by

References

    1. Clinical management of COVID-19: Living guideline, 18 August 2023 . Available online at: https://www.who.int/publications-detail-redirect/WHO-2019-nCoV-clinical-... (Accessed May, 2024).
    1. Takahashi T, Ellingson MK, Wong P, Israelow B, Lucas C, Klein J, et al. . Sex differences in immune responses that underlie COVID-19 disease outcomes. Nature. (2020) 588:315–20. doi: 10.1038/s41586-020-2700-3 - DOI - PMC - PubMed
    1. Williamson EJ, Walker AJ, Bhaskaran K, Bacon S, Bates C, Morton CE, et al. . Factors associated with COVID-19-related death using OpenSAFELY. Nature. (2020) 584:430–6. doi: 10.1038/s41586-020-2521-4 - DOI - PMC - PubMed
    1. Desai AD, Lavelle M, Boursiquot BC, Wan EY. Long-term complications of COVID-19. Am J Physiol - Cell Physiol. (2022) 322:C1–11. doi: 10.1152/ajpcell.00375.2021 - DOI - PMC - PubMed
    1. Hu B, Guo H, Zhou P, Shi ZL. Characteristics of SARS-coV-2 and COVID-19. Nat Rev Microbiol. (2021) 19:141–54. doi: 10.1038/s41579-020-00459-7 - DOI - PMC - PubMed