. 2024 Aug 27:15:1433393.
doi: 10.3389/fimmu.2024.1433393. eCollection 2024.

Lactylation signature identifies liver fibrosis phenotypes and traces fibrotic progression to hepatocellular carcinoma

Affiliations

Lactylation signature identifies liver fibrosis phenotypes and traces fibrotic progression to hepatocellular carcinoma

Lin-Na Li et al. Front Immunol. .

Abstract

Introduction: Precise staging and classification of liver fibrosis are crucial for the hierarchy management of patients. The roles of lactylation are newly found in the progression of liver fibrosis. This study is committed to investigating the signature genes with histone lactylation and their connection with immune infiltration among liver fibrosis with different phenotypes.

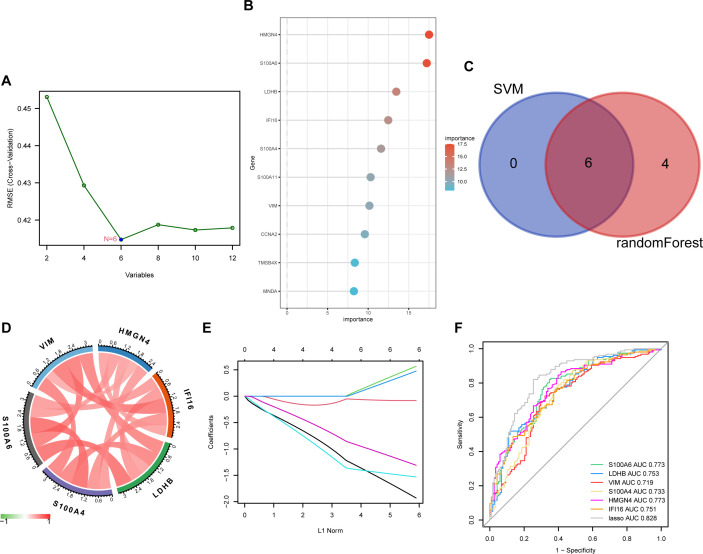
Methods: Firstly, a total of 629 upregulated and 261 downregulated genes were screened out of 3 datasets of patients with liver fibrosis from the GEO database and functional analysis confirmed that these differentially expressed genes (DEGs) participated profoundly in fibrosis-related processes. After intersecting with previously reported lactylation-related genes, 12 DEGs related to histone lactylation were found and narrowed down to 6 core genes using R algorithms, namely S100A6, HMGN4, IFI16, LDHB, S100A4, and VIM. The core DEGs were incorporated into the Least absolute shrinkage and selection operator (LASSO) model to test their power to distinguish the fibrotic stage.

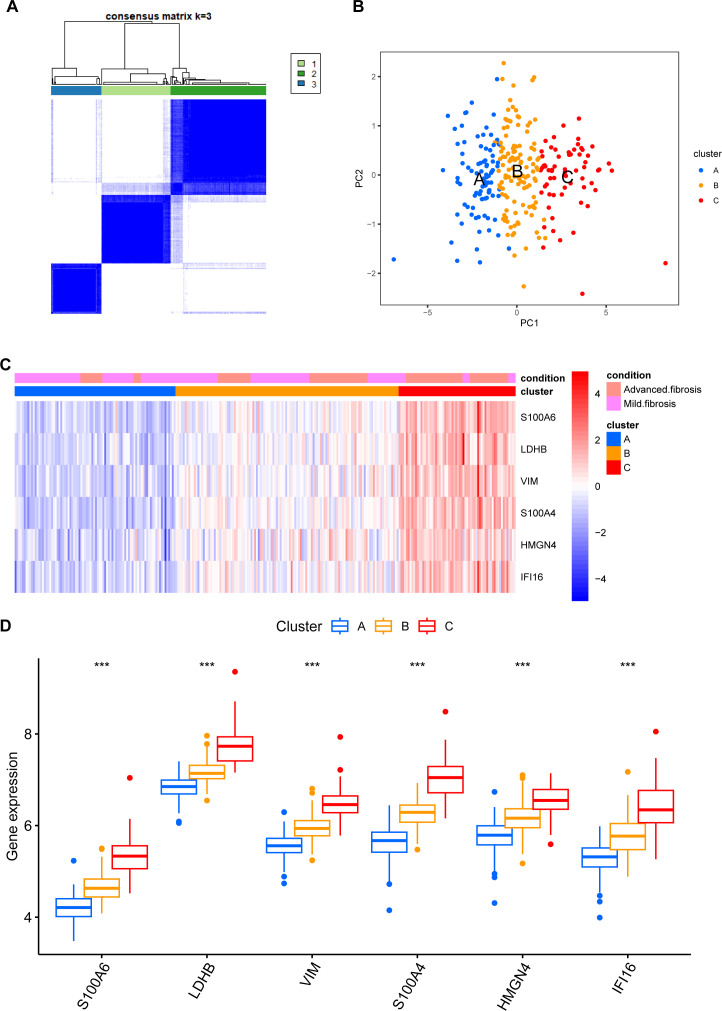
Results: Advanced fibrosis presented a pattern of immune infiltration different from mild fibrosis, and the core DEGs were significantly correlated with immunocytes. Gene set and enrichment analysis (GSEA) results revealed that core DEGs were closely linked to immune response and chemokine signaling. Samples were classified into 3 clusters using the LASSO model, followed by gene set variation analysis (GSVA), which indicated that liver fibrosis can be divided into status featuring lipid metabolism reprogramming, immunity immersing, and intermediate of both. The regulatory networks of the core genes shared several transcription factors, and certain core DEGs also presented dysregulation in other liver fibrosis and idiopathic pulmonary fibrosis (IPF) cohorts, indicating that lactylation may exert comparable functions in various fibrotic pathology. Lastly, core DEGs also exhibited upregulation in HCC.

Discussion: Lactylation extensively participates in the pathological progression and immune infiltration of fibrosis. Lactylation and related immune infiltration could be a worthy focus for the investigation of HCC developed from liver fibrosis.

Keywords: hepatocellular carcinoma; immune infiltration; lactylation; liver fibrosis; machine learning.


Conflict of interest statement

Author W-wL was employed by the company Guangzhou Wondfo Health Science and Technology Co., Ltd. The remaining authors declare that the research was conducted in the absence of any commercial or financial relationships that could be construed as a potential conflict of interest.

Figures

Figure 1
Figure 1
Merging the database and screening differential expressed genes (DEGs). (A) Principal Component Analysis (PCA) of samples from the three databases before data merging. (B) PCA of 274 samples covering 16,243 genes after data merging using the FactoMineR and factoextra packages from R. (C, D) sample distribution before (C) and after (D) homogenization of the datasets using the preprocessCore package of R language. (E, F) DEGs were screened using the limma package under the standard of adj.P.Val<0.05, and |logFC| > 0.25. Upregulated genes were plotted in red and downregulated genes in blue in a volcano plot (E). The heatmap (F) displays a group of genes differentially expressed in mild and advanced fibrosis.
Figure 2
Figure 2
GO Annotation and KEGG Enrichment analyses of DEGs. (A–C) GO annotation of the DEGs in association with annotated (A) biological process (BP), (B) cellular component (CC), and (C) molecular function (MF). (D) demonstration of KEGG enrichment results. Pathways were ranked according to their GeneRatio, and the sizes of the bubbles represent the number of enriched genes, and the colors represent p values.
Figure 3
Figure 3
Lactylation of DEGs in mild and advanced fibrotic livers. (A, B) Venn plot displaying the intersection of upregulated (A) and downregulated (B) DEGs with lactylation–related genes. (C) a volcano plot displaying the expressions of lactylation–related genes in mild and advanced fibrotic livers. (D, E) heatmap (D) and boxplot (E) displaying the expression patterns of the 12 lactylation–related genes in mild and advanced fibrotic livers. ****p<0.001.
Figure 4
Figure 4
Key DEG screening using machine learning. (A) key DEGs screened by SVM (support vector machine) using the kernlab package from R. (B) key DEGs elected by random forest using the randomForest package of R and ranked in order of their importance. (C) key DEGs selected by SVM and random forest were intersected and six candidates were obtained. (D) chord diagram displaying the correlation of six core DEGs. Positive correlations were plotted in red and negative in green. (E) the LASSO coefficient profiles of the six core DEGs in predicting liver fibrosis plotted by the glmnet package from R. (F) ROC (receiver operating characteristic) curve of the six core DEGs and their LASSO model in predicting disease occurrence plotted using the pROC package from R. AUC, area under the curve.
Figure 5
Figure 5
Immune infiltration in fibrotic livers and its correlation with core DEGs. (A) correlation heatmap displaying the correlation of various immune cells in the aspect of their proportion in fibrotic livers. (B) differences in immunocyte infiltration between mild and advanced fibrosis. Ns, not significant, * p<0.05, ** p<0.01, *** p<0.001. (C) associations between the degree of immune infiltration and each core DEG were plotted using the ggplot2 package on R. Immunocytes with p values less than 0.05 are displayed, sizes of the bubbles represent correlation coefficients and colors represent p values.
Figure 6
Figure 6
Association of core DEGs with genome variants. Correlation heatmaps illustrating the association between a single core DEG and 50 top-related genes.
Figure 7
Figure 7
GSEA of genes correlated with core DEGs. GSEA was performed based on the genes selected by correlation analysis using clusterProfiler from R. Top20 Reactome pathways of GSEA results are plotted with the enrichment score on the x-axis.
Figure 8
Figure 8
Phenotype clustering by the expression of core DEGs. (A) consensus clustering on liver fibrosis samples based on the six core DEGs using the ConsensusClusterPlus package from R. (B) PCA of the sample distribution across different phenotypes. (C) heatmap showing the association between gene expression and different phenotypes plotted by pheatmap from R. (D) expression distinction of core DEGs across different phenotypes. *** p<0.001.
Figure 9
Figure 9
Pairwise GSVA between different clusters. KEGG (A) and Reactome (B) pathways enriched for indicated clusters. GSVA package in R was used to compare pathway enrichment reciprocally between each two clusters. Pathways with significant differences were plotted on heatmaps using the pheatmap package from R. The color columns represent enrichment scores for the pathways in each cluster.
Figure 10
Figure 10
Upstream regulatory network of core DEGs. Core DEGs (red) and their predicted upstream regulators (blue) in the regulatory network constructed by Cytoscape software.
Figure 11
Figure 11
Expression of core DEGs in fibrosis, cirrhosis, and IPF. Differences in core DEG expressions in HCV-related cirrhosis (A), alcoholic cirrhosis (B), and IPF (C, D) were compared with the control. *p<0.05, **p<0.01, ***p<0.005, ****p<0.001, and ns, non-significant.
Figure 12
Figure 12
Expression and prognostic values of core DEGs in patients with HCC. (A) expressions of core DEG in the TCGA-LIHC patients. (B) overall survival of HCC patients with high or low expression of core DEGs. Only genes with significant association with survival are displayed. (C) mRNA expressions of VIM and S100A4 in normal and fibrotic mice detected by RT-qPCR. *p<0.05.

Similar articles

Cited by

References

    1. Kisseleva T, Brenner D. Molecular and cellular mechanisms of liver fibrosis and its regression. Nat Rev Gastroenterol Hepatol. (2021) 18:151–66. doi: 10.1038/s41575-020-00372-7 - DOI - PubMed
    1. Tang X, Yang L, Zhang P, Wang C, Luo S, Liu B, et al. . Occult hepatitis B virus infection and liver fibrosis in Chinese patients. J Infect Dis. (2023) 228:1375–84. doi: 10.1093/infdis/jiad140 - DOI - PubMed
    1. Lackner C, Tiniakos D. Fibrosis and alcohol-related liver disease. J Hepatol. (2019) 70:294–304. doi: 10.1016/j.jhep.2018.12.003 - DOI - PubMed
    1. Parola M, Pinzani M. Liver fibrosis in NAFLD/NASH: from pathophysiology towards diagnostic and therapeutic strategies. Mol Aspects Med. (2024) 95:101231. doi: 10.1016/j.mam.2023.101231 - DOI - PubMed
    1. Bataller R, Brenner DA. Liver fibrosis. J Clin Invest. (2005) 115:209–18. doi: 10.1172/JCI24282 - DOI - PMC - PubMed