[Preprint]. 2025 Feb 28:2024.08.30.610421.
doi: 10.1101/2024.08.30.610421.

High-throughput synthesis and specificity characterization of natively paired antibodies using oPool+ display

Affiliations

High-throughput synthesis and specificity characterization of natively paired antibodies using oPool+ display

Wenhao O Ouyang et al. bioRxiv. .

Update in

Abstract

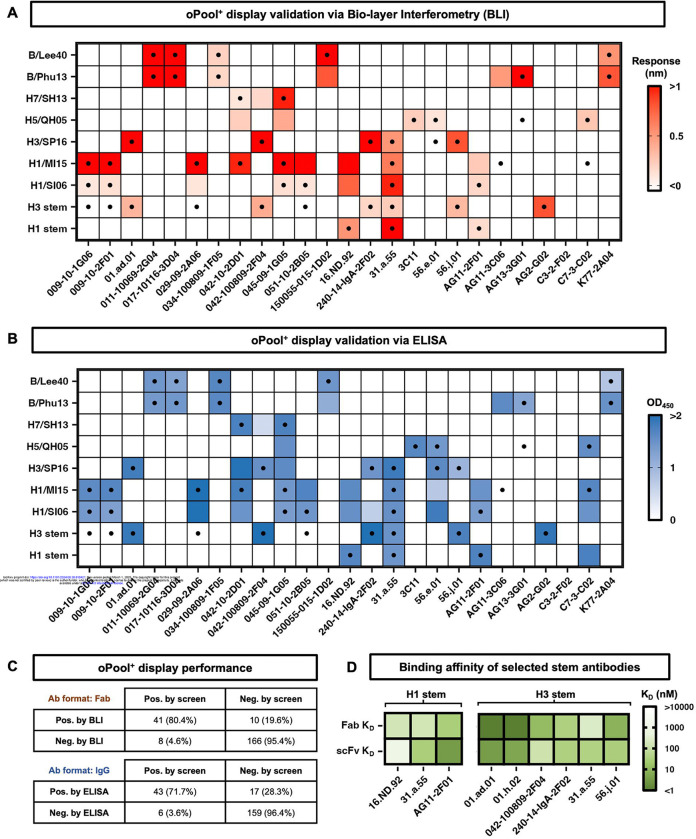
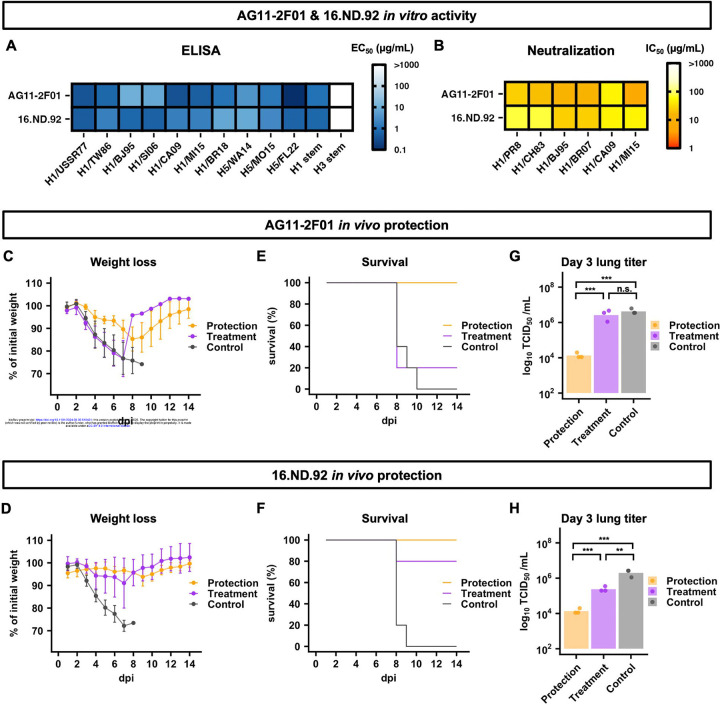
Antibody discovery is crucial for developing therapeutics and vaccines as well as understanding adaptive immunity. However, the lack of approaches to synthesize antibodies with defined sequences in a high-throughput manner represents a major bottleneck in antibody discovery. Here, we presented oPool+ display, a high-throughput cell-free platform that combined oligo pool synthesis and mRNA display to rapidly construct and characterize many natively paired antibodies in parallel. As a proof-of-concept, we applied oPool+ display to probe the binding specificity of >300 uncommon influenza hemagglutinin (HA) antibodies against 9 HA variants through 16 different screens. Over 5,000 binding tests were performed in 3-5 days with further scaling potential. Follow-up structural analysis of two HA stem antibodies revealed the previously unknown versatility of IGHD3-3 gene segment in recognizing the HA stem. Overall, this study established an experimental platform that not only accelerate antibody characterization, but also enable unbiased discovery of antibody molecular signatures.

Keywords: B-cell receptors; High-throughput screening; antibody; broadly neutralizing; cryo-EM; hemagglutinin; influenza; mRNA display; oligo pools.


Conflict of interest statement

DECLARATION OF INTERESTS N.C.W. consults for HeliXon. The authors declare no other competing interests.

Figures

Figure 1.
Figure 1.. Curation and synthesis of the natively paired HA antibody library.
(A) The overall breakdown of the HA antibody library. (B) Design of oligos for scFv assembly. Each given scFv construct contains a T7 promoter and a start codon at the N-terminal as well as a FLAG tag at the C-terminal. The scFv sequences were then split into 4 fragments at the selected CDR regions, with overlap between adjacent fragments. Through an overlap PCR, oligos of the same construct would preferably anneal to each other, ensuring the assembly of natively paired scFvs. (C) Synthesis of the natively paired HA antibody library. Synthesized oligo pools containing scFv fragments were assembled via a two-stage PCR (see Materials and Methods). (D) The unassembled and assembled oligo pools were compared by agarose gel electrophoresis. “U”: unassembled oligo pool. “Rep1”: replicate 1. “Rep2”: replicate 2. The red arrow indicates the target size (800–900 bp) for full length scFvs. (E-F) The reproducibility (E) and coverage (F) of the scFv assembly using varying numbers of scFv per PCR, ranging from 25 to 200. The Pearson correlation coefficient (R) of the occurrence frequencies of individual scFvs between the two replicates were indicated. Micro-tube icon by Servier https://smart.servier.com/ is licensed under CC-BY 3.0 Unported, available via Bio Icons.
Figure 2.
Figure 2.. Rapid specificity characterization of the natively paired antibodies by mRNA display.
The screening results of each scFv are shown as a heatmap. X-axis represents the scFv names. Y-axis represents each individual screens. Screens against CR9114 IgG pre-bound HAs are indicated by “+CR9114”. Binding scores shown were adjusted with robust scaling. Individual cutoffs were set for each screen to determine positive hits (Table S4, Materials and Methods). Black circles at the top of the heatmap indicate head antibody controls, whereas empty circles indicate stem antibody controls.
Figure 3.
Figure 3.. Systematic validation of oPool+ display.
(A-B) Binding activity of 25 antibodies against different HAs was measured by (A) biolayer interferometry (BLI) with antibodies in Fab format and (B) ELISA with antibodies in IgG format. (A) The response signals during the association phase and (B) the OD450 values were shown as heatmaps. The dots represent the hits in oPool+ display. X-axis represents antibody names. Y-axis represents antigen names. (C) Binary confusion matrices based on BLI and ELISA validations are shown. (D) Binding affinity of selected HA stem antibody candidates in both scFv and Fab format. Their dissociation constants (KD) against H1 stem and H3 stem are shown as heatmaps. Of note, 31.a.55 was a positive control for binding to both H1 stem and H3 stem, AG11–2F01 was a positive control for binding to H1 stem, and 042–100809-2F04 was a positive control for binding to H3 stem.
Figure 4.
Figure 4.. CR9114 competition profile of validated antibodies.
(A) CR9114 competition indices of validated antibodies. The competition indices calculated from oPool+ display are shown. High positive values indicate CR9114 competition, low positive and high negative values indicate no CR9114 competition. (B) CR9114 competition of validated antibodies based on BLI results, shown as scatter plot against the competition indices. The response of each antibody binding to the antigen were measured during the association step with or without prior saturation binding of CR9114. The percentage of competition is shown with the range of 0% (no competition) to 100% (complete competition). Pearson correlation coefficient (R) between replicates is indicated. The linear fit lines are shown as red dash lines. Representative antibodies are labelled.
Figure 5.
Figure 5.. Structural analysis of AG11–2F01 and 16.ND.92.
(A) Cryo-EM structures of AG11–2F01 and 16.ND.92 in complex with H1/SI06 HA. HA1 is in light grey. HA2 is in dark grey. Heavy chain variable domain (VH) is in orange. Light chain variable domain (VL) is in pink. (B) Epitopes of AG11–2F01 and 16.ND.92. VH contacts are in orange. VL contacts are in pink. Contacts shared by both VH and VL are in purple. (C) Interactions between light chain and HA are shown. H-bonds are represented by black dashed lines. (D) Interactions between CDR H3 and HA are shown. (E) Overlay of the CDR H3 loops from IGHD3–3 HA-stem antibodies. HA is in surface representation. (F) Contributions of CDR H3 (orange), non-CDR H3 VH (yellow), and VL (pink) to the paratope buried surface areas (BSA) of the indicated antibodies. (G) Contributions of IGHD3–3-encoded residues to VH paratope BSA of the indicated antibodies.
Figure 6.
Figure 6.. in vitro and in vivo protection of AG11–2F01 and 16.ND.92.
(A) The binding activities of AG11–2F01 and 16.ND.92 against recombinant HA proteins from the indicated H1 and H5 strains were measured by ELISA. The EC50 values are shown as a heatmap. (B) The neutralization activity of AG11–2F01 and 16.ND.92 against different recombinant H1N1 viruses was measured by a microneutralization assay. The IC50 values are shown as a heatmap. (A-B) Strain names are abbreviated as follows: H1N1 A/Puerto Rico/8/1934 (H1/PR8), H1N1 A/USSR/90/1977 (H1/USSR77), H1N1 A/Chile/1/1983 (H1/CH83), H1N1 A/Taiwan/01/1986 (H1/TW86), H1N1 A/Beijing/262/1995 (H1/BJ95), H1N1 A/Solomon Island/3/2006 (H1/SI06), H1N1 A/Brisbane/59/2007 (H1/BR07), H1N1 A/California/04/2009 (H1/CA09), H1N1 A/Michigan/45/2015 (H1/MI15), H1N1 A/Brisbane/02/2018 (H1/BR18), H5N8 A/northern pintail/WA/40964/2014 (H5/WA14), H5N2 A/snow goose/Missouri/CC-1584A/2015 (H5/MO15), and H5N1 A/bald eagle/Florida/W22–134-OP/2022 (H5/FL22). H1 stem and H3 stem represents the HA stem constructs designed based on H1N1 A/Brisbane/59/2007 HA and H3N2 A/Finland/486/2004 HA, respectively,. (C-H) The in vivo protection activity of AG11–2F01 and 16.ND.92 against lethal challenge of PR8 virus was assessed by (C-D) weight loss profiles, (E-F) Kaplan-Meier survival curves, and (G-H) lung viral titers at day 3 post-infection. P values were computed by two-tailed student’s t-test. ***: P < 0.001; **: P < 0.01; n.s.: not significant.

References

    1. Pedrioli A., and Oxenius A. (2021). Single B cell technologies for monoclonal antibody discovery. Trends Immunol. 42, 1143–1158. 10.1016/j.it.2021.10.008. - DOI - PubMed
    1. Valldorf B., Hinz S.C., Russo G., Pekar L., Mohr L., Klemm J., Doerner A., Krah S., Hust M., and Zielonka S. (2022). Antibody display technologies: selecting the cream of the crop. Biol. Chem. 403, 455–477. 10.1515/hsz-2020-0377. - DOI - PubMed
    1. Persson M.A., Caothien R.H., and Burton D.R. (1991). Generation of diverse high-affinity human monoclonal antibodies by repertoire cloning. Proc. Natl. Acad. Sci. U. S. A. 88, 2432–2436. 10.1073/pnas.88.6.2432. - DOI - PMC - PubMed
    1. Sheets M.D., Amersdorfer P., Finnern R., Sargent P., Lindquist E., Schier R., Hemingsen G., Wong C., Gerhart J.C., and Marks J.D. (1998). Efficient construction of a large nonimmune phage antibody library: the production of high-affinity human single-chain antibodies to protein antigens. Proc. Natl. Acad. Sci. U. S. A. 95, 6157–6162. 10.1073/pnas.95.11.6157. - DOI - PMC - PubMed
    1. Kirkpatrick E., Qiu X., Wilson P.C., Bahl J., and Krammer F. (2018). The influenza virus hemagglutinin head evolves faster than the stalk domain. Sci. Rep. 8, 10432. 10.1038/s41598-018-28706-1. - DOI - PMC - PubMed

Publication types