[Preprint]. 2024 Aug 30:2024.08.29.610343.
doi: 10.1101/2024.08.29.610343.

A Comparison of Skeletal Muscle Diffusion Tensor Imaging Tractography Seeding Methods

Affiliations

A Comparison of Skeletal Muscle Diffusion Tensor Imaging Tractography Seeding Methods

Bruce M Damon et al. bioRxiv. .

Update in

Abstract

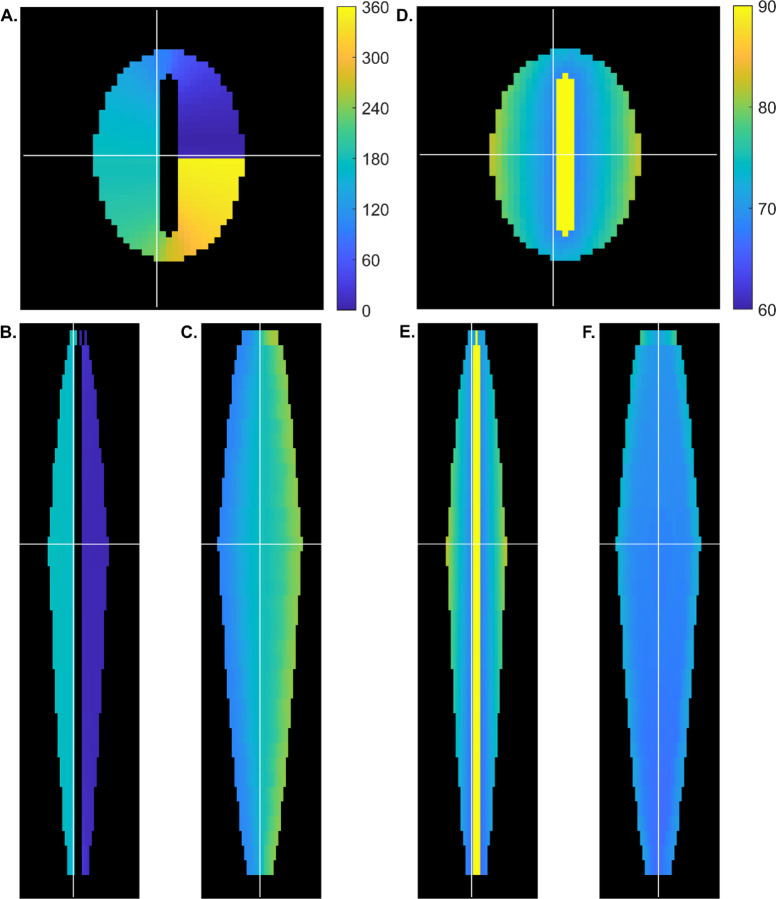
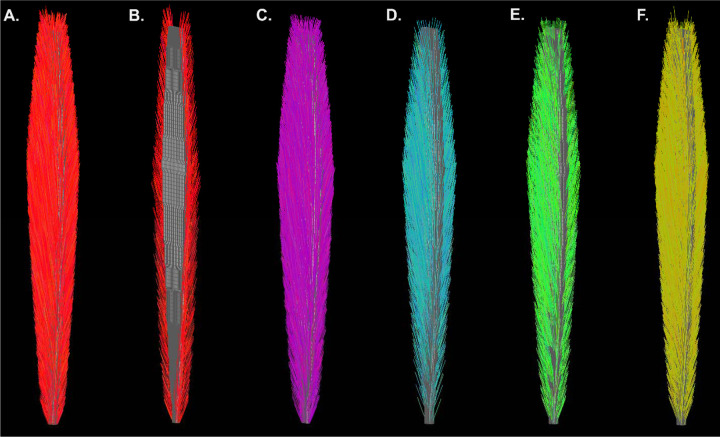
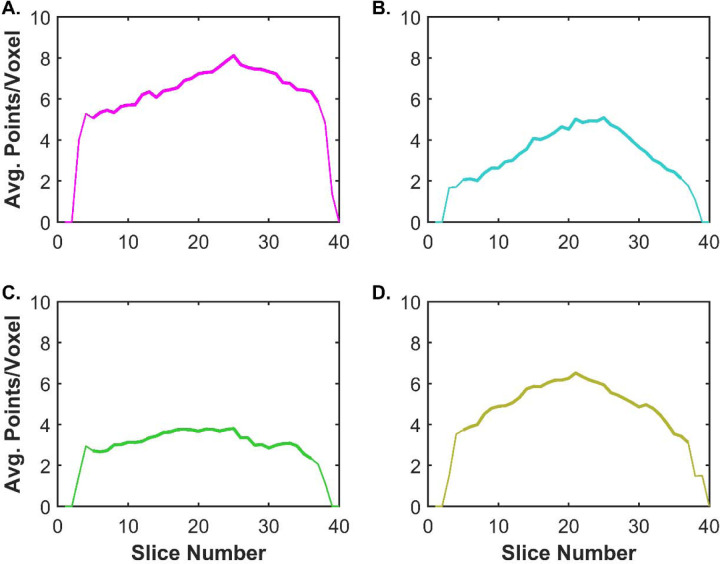
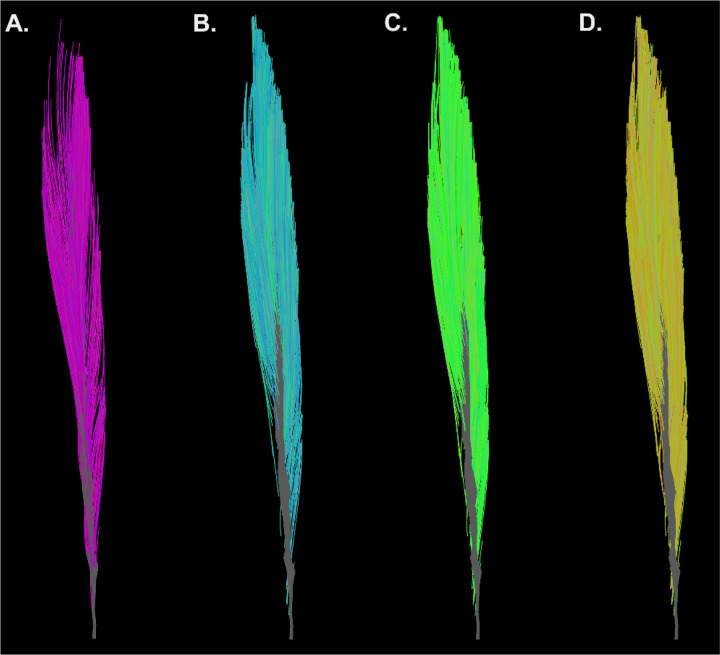
The internal arrangement of a muscle's fibers with respect to its mechanical line of action (muscle architecture) is a major determinant of muscle function. Muscle architecture can be quantified using diffusion tensor magnetic resonance imaging-based tractography, which propagates streamlines from a set of seed points by integrating vectors that represent the direction of greatest water diffusion (and by inference, the local fiber orientation). Previous work has demonstrated that tractography outcomes are sensitive to the method for defining seed points, but this sensitivity has not been fully examined. To do so, we developed a realistic simulated muscle architecture and implemented four novel methods for tract seeding: seeding along the muscle-aponeurosis boundary with an updated procedure for rounding seed points prior to lookup in the muscle boundary mask and diffusion tensor matrix (APO-3); voxel-based seeding throughout the muscle volume at a user-specified spatial frequency (VXL-1); voxel-based seeding throughout the muscle volume at a variable spatial frequency (VXL-2), and seeding near external and internal muscle boundaries (VXL-3). We then implemented these methods in an example human dataset. The updated aponeurosis seeding procedures allow more accurate and robust tract propagation from seed points. The voxel-based seeding methods had quantification outcomes that closely matched the updated aponeurosis seeding method. Further, the voxel-based methods can accelerate the overall workflow and may be beneficial in high throughput analysis of multi-muscle datasets. Continued evaluation of these methods in a wider range of muscle architectures is warranted.

Keywords: DTI; fiber-tracking; freeware; muscle architecture; simulation; skeletal muscle.


Figures

Figure 1.
Figure 1.. Composite tissue design and muscle fiber orientations in the simulated muscle.
Panels A-C show angles of azimuth (□) as counterclockwise rotations from the +X axis. A. Axial view. The elliptical-profiled tissue had a central aponeurosis in which the collagen orientation was perpendicular to the slice plane. White lines show the locations of the coronal (horizontal line) and sagittal (vertical line) views. The color bar gives □ in degrees. B. Coronal view. The same color scale as in Panel A. is used. White lines give the locations of the axial (horizontal line) and sagittal (vertical line) views. C. Sagittal view. The angle of decreased as a function of increasing slice number. The same color scale as in Panel A. is used. White lines give the locations of the axial (horizontal line) and coronal (vertical line) views. D-F. Same as A-C, except that the angle of elevation above the slice plane (θ) is shown. D. Axial view. The color scale indicates the θ in degrees. θ increased as a function of within-slice distance from the aponeurosis. E. Coronal view. The same color scale as D. is shown. θ increased as a function of increasing slice number. F. Sagittal view. The same color scale as D. is shown. θ increased as a function of increasing slice number.
Figure 2.
Figure 2.. Fiber tracts generated under noise-free conditions (simulated muscle).
A. Fiber tracts generated using the current tracking methods, with an expanded aponeurosis seeding mesh whose lateral mesh column coordinates fell 0.2–0.5 pixels (0.2–0.5 mm) outside the rounding limits that allow fiber tract initiation (APO-1). B. Fiber tracts generated using the current tracking methods, with a restricted aponeurosis seeding mesh whose lateral mesh column coordinates fell 0.01 pixels (10 μm) inside the rounding limits that allow fiber tract initiation (APO-2). C. Aponeurosis-seeded fiber tracts generated using the restricted mesh and the updated seed point rounding procedure (APO-3). D. Regularly spaced, voxel-seeded fiber tracts (VXL-1). E. Variable density, voxel-seeded fiber tracts (VXL-2). F. Edge voxel-seeded fiber tracts (VXL-3).
Figure 3.
Figure 3.. Bland-Altman plots of the agreement between of θ and □ for the fiber tract segment angles and ground truth (simulated muscle).
A. The mean pairwise difference (ground truth – tract segment-based estimate) in θ is plotted as a function of the mean pairwise value of θ. The actual 95% confidence interval (i.e., that calculated from the 2.5th and 97.5th percentiles of the distribution of difference scores) is shown. included zero. For clarity, only every 10th data point is shown. B. The mean pairwise difference (ground truth – tract segment-based estimate) in □ is plotted as a function of the mean pairwise value of □. The 95% confidence interval included zero. For clarity, only every 10th data point is shown.
Figure 4.
Figure 4.. Uniformity of spatial sampling of the muscle by the fiber tracts (simulated muscle).
Uniformity is expressed as the average number of fiber tract points per voxel in each slice. Descriptive statistics were calculated for slices with at least two proximal and distal neighbors, as represented by the bold lines. A. APO-3 condition, with a mean of 6.6 points/voxel and a coefficient of variation (CV) of 12.4% across slices. B. VXL-1 condition, with a mean of 3.6 points/voxel and a CV of 28.4%. C. VXL-2 condition, with a mean of 3.2 points/voxel and a CV of 12.9%. D. VXL-3 condition, with a mean of 5.1 points/voxel and a CV of 18.5%.
Figure 5.
Figure 5.. Example fiber tracts generated in the SNR=39 condition (simulated muscle).
A. APO-3 condition (restricted aponeurosis seeding mesh with updated rounding procedure). B. VXL-2 (variable density seeding) condition. C. VXL-3 (edge seeding) condition.
Figure 6.
Figure 6.. Example fiber tracts (in vivo data).
A. APO-3 condition (restricted aponeurosis seeding mesh with updated rounding procedure). B. VXL-1 (every 2nd voxel in the row and column directions). C. VXL-2 (variable density seeding) condition. D. VXL-3 (eroded edge seeding) condition.
Figure 7.
Figure 7.. Uniformity of spatial sampling of the muscle by the fiber tracts (in vivo data).
Uniformity is expressed as the average number of fiber tract points per voxel in each slice. Descriptive statistics were calculated for slices with at least two proximal and distal neighbors, as represented by the bold lines. A. APO-3 condition, with a mean of 8.0 points/voxel and a coefficient of variation (CV) of 16.2% across slices. B. VXL-1 condition, with a mean of 5.9 points/voxel and a CV of 23.6%. C. VXL-2 condition, with a mean of 17.4 points/voxel and a CV of 19.2%. D. VXL-3 condition, with a mean of 8.5 points/voxel and a CV of 28.9%.

References

    1. Sacks RD, Roy RR. Architecture of the hind limb muscles of cats: functional significance. J Morphol. 1982;173:185–95. - PubMed
    1. Otten E. Concepts and models of functional architecture in skeletal muscle. Exerc Sport Sci Rev. 1988;16:89–137. - PubMed
    1. Lieber RL, Friden J. Functional and clinical significance of skeletal muscle architecture. Muscle Nerve. 2000;23:1647–66. - PubMed
    1. Van Leeuwen JL, Spoor CW. Modelling the pressure and force equilibrium in unipennate muscles with in-line tendons. Philos Trans R Soc Lond B Biol Sci. 1993;342:321–33. - PubMed
    1. Van Leeuwen JL, Spoor CW. Modelling mechanically stable muscle architectures. Philos Trans R Soc Lond B Biol Sci. 1992;336:275–92. - PubMed

Publication types

LinkOut - more resources