[Preprint]. 2024 Aug 31:2024.08.30.610447.
doi: 10.1101/2024.08.30.610447.

Chronic social defeat stress induces meningeal neutrophilia via type I interferon signaling

Affiliations

Chronic social defeat stress induces meningeal neutrophilia via type I interferon signaling

Stacey L Kigar et al. bioRxiv. .

Abstract

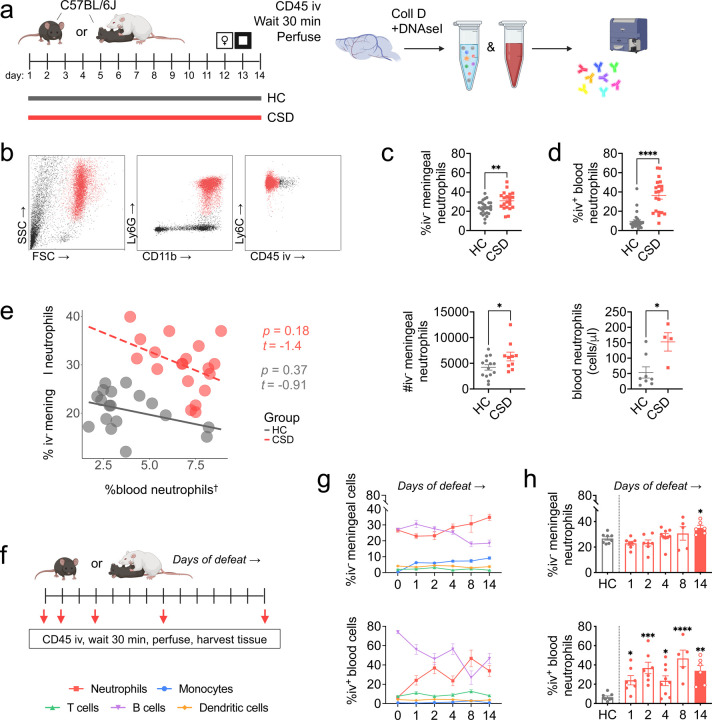
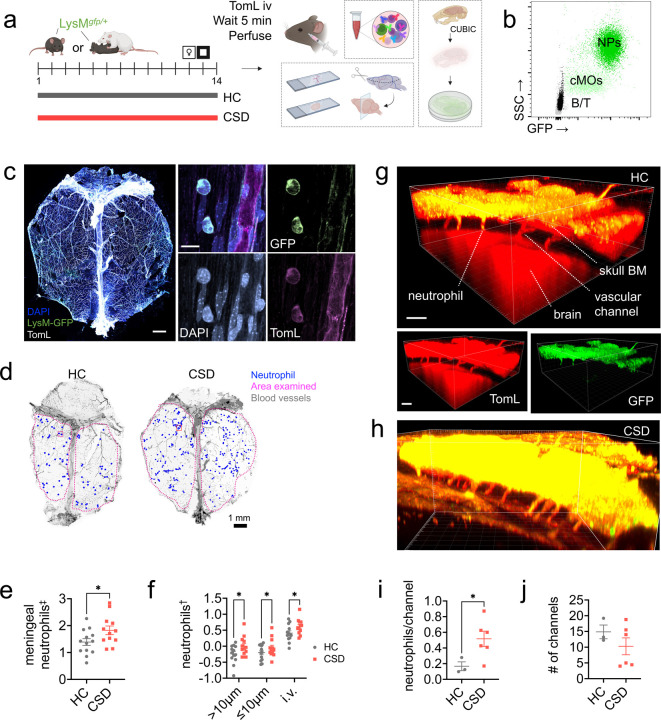
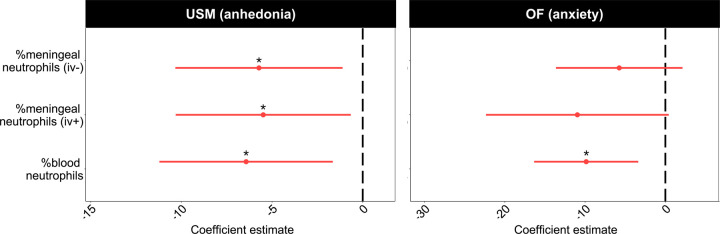
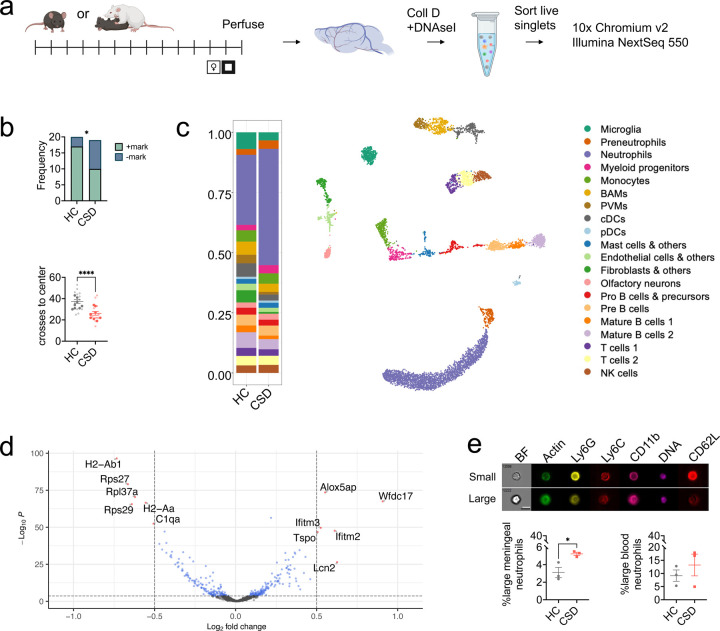
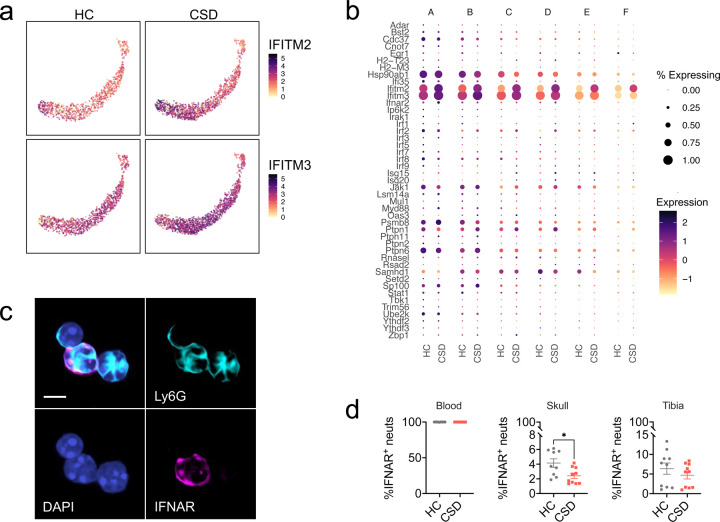
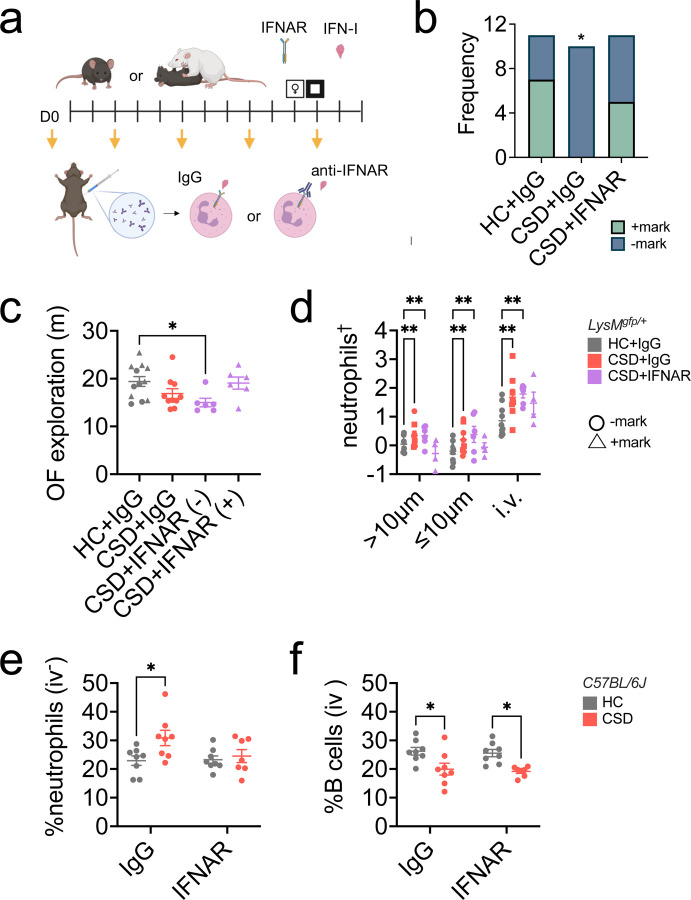
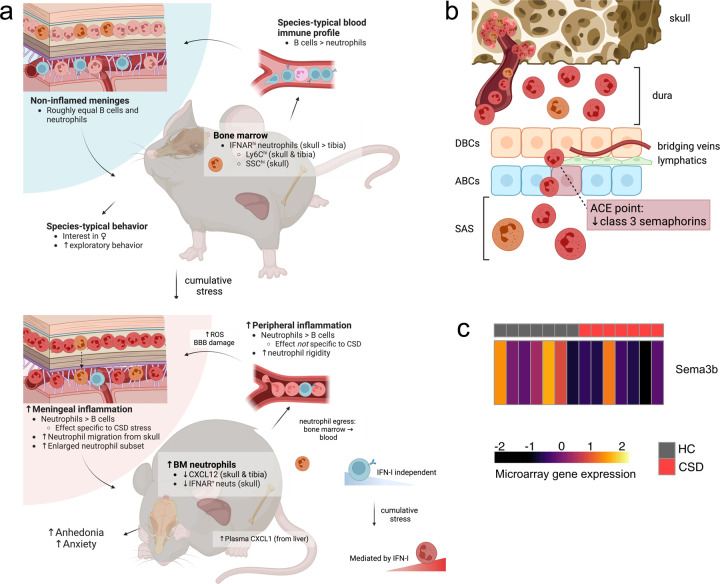
Animal models of stress and stress-related disorders are also associated with blood neutrophilia. The mechanistic relevance of this to symptoms or behavior is unclear. We used cytometry, immunohistochemistry, whole tissue clearing, and single-cell sequencing to characterize the meningeal immune response to chronic social defeat (CSD) stress in mice. We find that chronic, but not acute, stress causes meningeal neutrophil accumulation, and CSD increases neutrophil trafficking in vascular channels emanating from skull bone marrow (BM). Transcriptional analysis suggested CSD increases type I interferon (IFN-I) signaling in meningeal neutrophils. Blocking this pathway via the IFN-I receptor (IFNAR) protected against the anhedonic and anxiogenic effects of CSD stress, potentially through reduced infiltration of IFNAR+ neutrophils into the meninges from skull BM. Our identification of IFN-I signaling as a putative mediator of meningeal neutrophil recruitment may facilitate development of new therapies for stress-related disorders.


Conflict of interest statement

Competing interests E.T.B. is a consultant for Sosei Heptares. M.L.L. is currently employed at AstraZeneca but was an employee at NIH at the time this work was conducted. The other authors have no conflicts to declare.

Figures

Figure 1:
Figure 1:. Meningeal neutrophils are elevated following chronic, but not acute, social defeat stress.
a) CSD mice were behaviorally phenotyped on days 10–13, and tissue harvested at day 14 (Figures S1A–C). b) Mice were injected retro-orbitally with a fluorescently labeled CD45 antibody for exclusion of blood-exposed cells in the meninges. Simplified gating strategy showing identification of nonvascular neutrophils from meningeal tissue. Full gating strategy shown in Figures S1D–E. c) Flow cytometric analysis shows CSD stress causes an increase in meningeal neutrophils, defined as CD45iv-;CD11b+;Ly6G+;Ly6Cint and (top) calculated as a percent of live CD45+ cells (nHC = 27, nCSD = 21), or (bottom) assessed for absolute, as opposed to relative, cell counts (nHC = 14, nCSD = 10). d) Flow cytometry analysis of blood neutrophils (CD45iv+;CD11b+;Ly6G+;Ly6Cint) shows a robust increase following CSD stress in both the (top) percentage of neutrophils (nHC = 27, nCSD = 20) and (bottom) absolute counts (nHC = 8, nCSD = 4). e) No apparent relationship between blood and meningeal neutrophils; values were square root transformed to improve normality. f) Schematic of acute vs chronic stress study; red arrows indicate time points in days at which mice were killed and tissue was harvested. g) Comparison of all cell types examined in this study showing equal and opposite directional fluctuations for neutrophils and B cells in both tissues. h) There was a main effect of the number of encounters for meningeal neutrophils, but only the CSD day-14 group showed a significant increase by post hoc analysis. In contrast, there was a significant increase in blood neutrophils overall and at each time point when compared to HC (subscript indicates days of defeat: nHC = 8, n1 = 7; n2 = 7; n4 = 9; n8 = 5; n14 = 6). Diagrams made with Biorender. HC = home cage, CSD = chronic social defeat stress. Data shown as mean ± SEM. *p < 0.05, **p < 0.01, ***p < 0.001, ****p < 0.0001.
Figure 2:
Figure 2:. CSD stress leads to increased numbers of neutrophils in vascular channels connecting skull bone marrow to meninges.
a) LysMgfp/+ mice were subjected to CSD stress. Before TomL intravascular (iv) injection, blood was drawn for flow cytometry (Figure SF3). Dorsal meninges and brain (Figure S4) were prepared for imaging. A separate cohort of mice was used for tissue clearing. Diagram made with Biorender. b) Flow cytometry data of blood shows both high GFP expression and SSC in neutrophils compared to other cell types (x axis is log scale, y axis is linear). c) Left: Representative image for dorsal whole-mount meningeal tissue. Scale bar = 1 mm. Right: GFP+ neutrophils adjacent to a blood vessel; merge and individual channels. Scale bar = 10μm. d) Representative meningeal whole mounts from HC and CSD mice showing hand-counted meningeal neutrophils, normalized to indicated area. Blood vessels traced in Adobe Illustrator for visualization. Inset box represents approximate size of area shown in high resolution images from (c). e) Quantification of total meningeal neutrophils shows an increase with CSD stress. natural log-transformed. f) Neutrophils were separated into three categories based on their location in the tissue: >10μm away from a blood vessel (“parenchymal”), ≤10μm away from a blood vessel (“abluminal”), and intravascular (“iv”). CSD led to neutrophil elevations in all three subcompartments. log10-transformed. g) Representative image from cleared HC skull showing vascular channels between skull bone marrow and the meninges. Scale bar = 100μm. Top: Merged image. Bottom: Individual channels for blood vessels and neutrophils. h) Representative image from a CSD mouse. i) Quantification of neutrophils per channel (normalized to number of channels) indicates increased egress from skull bone marrow following CSD stress (nHC = 3, nCSD = 6). j) No differences in the number of channels counted between groups. HC = home cage, CSD = chronic social defeat stress, TomL = tomato lectin, NPs = neutrophils, cMOs = classical monocytes, SSC = side scatter complexity, BM = bone marrow. Data shown as mean ± SEM. *p < 0.05.
Figure 3:
Figure 3:
Elevated neutrophil levels are associated with the negative behavioral sequelae of CSD stress. Dot and whiskers plots showing standardized effect sizes for neutrophil levels on behavioral outcomes (batch corrected for cohort). Left: Logistic regression models show negative relationships between blood and meningeal neutrophils with USM behavior. As neutrophil levels rise, mice are less likely to engage with the hedonic stimulus, i.e., odor from sexually mature females (nHC = 12, nCSD = 13). Right: Linear regression models indicate blood neutrophils are significantly associated with anxiety-like behavior. Specifically, as blood neutrophil levels increase, mice explored the OF arena less (iv-/iv+ meningeal neutrophils: nHC = 15, nCSD = 17; blood: nHC = 10, nCSD = 11). See Tables S1-S2 for full statistics; see Figure S5 for comparison with LysMgfp/+ mice. HC = home cage, CSD = chronic social defeat stress, USM = urine scent marking, OF = open field. *p < 0.05.
Figure 4:
Figure 4:. Single cell sequencing of meningeal tissue validates CSD neutrophilia; differential gene expression (DGE) analysis reveals enrichment of pathways related to cytoskeletal processes.
a) Timeline for sample collection and processing. Figure made with Biorender. b) WT mice were behaviorally phenotyped prior to single cell analysis; a subset with representative behavior in both the USM task for anhedonia and the OF task for anxiety-like behavior were selected. Top: HC animals that marked (+mark) and CSD animals that did not mark (-mark) were chosen. Bottom: larger, filled circles indicate individual animals used for single-cell analysis. c) Analysis of 10x Genomics single-cell data for meningeal tissue reveals 20 distinct immune cell clusters. Left: Visualization of recovered cells as a proportion of total cells recovered per group; lavender indicates neutrophils. (nHC = 8, nCSD = 4; see Methods). Plot shown previously. d) Volcano plot showing DGE between CSD and HC in the neutrophil cluster (excluding preneutrophil cluster). Indicated points represent DGE with LFC > 0.5 and FDR p < 0.001. Gene set enrichment analysis (GSEA) revealed several enriched pathways related to cell size and the cytoskeleton (see Figure S8). e) The Amnis ImageStream system was used to visualize cells stained with flow cytometry markers identifying neutrophils, phalloidin (to label actin) and Hoechst (to label nuclei). Top: Representative images acquired from individual meningeal neutrophils. Two differently sized populations emerged, as depicted (white bar = ‘small’ neutrophil diameter, black bar = ‘large’). Bottom: There were nearly 3x more enlarged neutrophils in CSD meninges compared to HC. No changes were evident in blood. For more details, see Figure S9. HC = home cage, CSD = chronic social defeat stress, BAM = border associated macrophage, PVM = perivascular macrophage, DBC = dural border cell, BF = brightfield. Data shown as mean ± SEM. *p < 0.05, ****p < 0.0001.
Figure 5:
Figure 5:. Migration of IFNAR+ neutrophils from skull bone marrow to the meninges may underlie the type I interferon neutrophil signature seen in CSD stressed mice.
a) UMAP shows expression of Ifitm2 and Ifitm3, the leading-edge genes for enrichment of the GO: “Response to type I interferon” pathway in neutrophils, in CSD compared to HC animals. b) Dot plot showing gene expression in each neutrophil subcluster for all genes comprising this pathway. Expression is scaled to mean ± standard deviation. c) 60x magnification of skull bone marrow-derived neutrophils. Clockwise from top left: Merge, Ly6G+ staining (cyan), IFNAR+ staining (magenta), nuclei (DAPI, blue). Scale = 5μm. d) IFNAR+ neutrophils, normalized to total neutrophils, for blood, skull, and tibia bone marrow. The population of IFNAR+ skull bone marrow neutrophils was decreased in CSD stressed mice, and may represent a migration event to the meninges. See Figure S13 for more detail. HC = home cage, CSD = chronic social defeat. Data shown as mean ± SEM. *p < 0.05.
Figure 6:
Figure 6:. Type I interferon receptor (IFNAR) blockade may improve CSD-stress related behavioral anhedonia and prevent meningeal neutrophil accumulation.
a) Schematic showing drug-delivery schedule for IFNAR blocking antibodies. Mice were injected with either matched IgG control antibody or anti-IFNAR antibody on the days indicated with yellow arrows. Figure made with Biorender. b) USM results from LysMgfp/+ mice; as expected, CSD+IgG mice marked less frequently compared to the HC+IgG group. There were no differences between the HC+IgG group and the CSD+IFNAR group (nHC+IgG = 11, nCSD+IgG = 10, nCSD+IFNAR = 11). Hereafter we considered LysMgfp/+ mice in two separate groups – those that marked in the USM test (+, indicated with triangles) and those that didn’t (-, indicated with circles). c) HC+IgG(+) and (−) mice showed a normal distribution for anxiety-like behavior and were collapsed into one group. CSD+IFNAR(+) mice showed control-like levels of exploration in the OF task for anxiety-like behavior. d) There was an overall effect of group on meningeal neutrophils. Post hoc analysis indicated a CSD stress-induced increase that was normalized in the CSD+IFNAR(+) subgroup. values were natural log-transformed to improve normality. e) In C57BL/6J wild type mice there was an IFNAR-mediated rescue in meningeal neutrophil accumulation following CSD stress, with expected differences in IgG control groups (nCSD+IFNAR = 7, otherwise n = 8). f) Anti-IFNAR treatment does not rescue the reduction in meningeal B cells seen with CSD stress. HC = home cage, CSD = chronic social defeat stress. Data shown as mean ± SEM. *p < 0.05, **p < 0.01.
Figure 7:
Figure 7:. Proposed model for how chronic, but not acute, stress leads to dysregulation of the meningeal environment.
a) At baseline, both skull and tibia bone marrow contain a small population of IFNAR+ neutrophils (orange), further divisible into IFNARlo and IFNARhi populations. Relatively mature IFNARhi cells express more Ly6C and may thus be more proinflammatory. In blood, B cell numbers greatly outnumber neutrophils; in the meninges these two populations are roughly equal. Acute stress exposure leads to repetitive release of neutrophils into the blood but is not sufficient for accumulation of neutrophils in the meninges (Figures 1H, S15A). Prolonged exposure to psychosocial stress leads to a decline in meningeal B cells (Figure S2C) that precedes an increase in meningeal neutrophils (Figure 1H). Whereas CSD-associated meningeal neutrophilia appears to be mediated by IFN-I signaling, meningeal B cell depletion does not (Figures 6C,E). CSD stress causes random neurovascular damage—potentially via stalled and rigid ROS-producing neutrophils in brain capillaries (Figures S4, S9E, S11)—which amplifies neutrophil recruitment from adjacent skull bone marrow (Figure 2G). b) Class 3 semaphorins (SEMA3) prevent migration of neutrophils across dural lymphatics into the leptomeninges at ACE points due to their chemorepellent properties. Depletion of SEMA3 family expression leads to increased accumulation of neutrophils and other immune factors in SAS from whence they can directly interact with the brain to influence mood and behavior. c) Microarray analysis of SEMA3 family members in bulk meningeal tissue suggests decreased expression of Sema3b, which may permit neutrophil entry into the SAS (n = 7 per group). Figures made in Biorender. HC = home cage, CSD = chronic social defeat, SSC = side scatter complexity, ROS = reactive oxygen species, BBB = blood brain barrier, DBC = dural border cell, ABC = arachnoid barrier cell, ACE = arachnoid cuff exit, SAS = subarachnoid space.

Similar articles

References

    1. Danese A. et al. Elevated Inflammation Levels in Depressed Adults With a History of Childhood Maltreatment. Arch. Gen. Psychiatry 65, 9 (2008). - PMC - PubMed
    1. Spindola L. M. et al. Gene expression in blood of children and adolescents: Mediation between childhood maltreatment and major depressive disorder. J. Psychiatr. Res. 92, 24–30 (2017). - PubMed
    1. Dantzer R. & Kelley K. W. Twenty years of research on cytokine-induced sickness behavior. Brain. Behav. Immun. 21, 153–160 (2007). - PMC - PubMed
    1. Osimo E. F. et al. Inflammatory markers in depression: A meta-analysis of mean differences and variability in 5,166 patients and 5,083 controls. Brain. Behav. Immun. 87, 901–909 (2020). - PMC - PubMed
    1. Felger J. C. et al. Effects of Interferon-Alpha on Rhesus Monkeys: A Nonhuman Primate Model of Cytokine-Induced Depression. Biol. Psychiatry 62, 1324–1333 (2007). - PMC - PubMed

Publication types