[Preprint]. 2024 Sep 1:2024.08.30.610195.
doi: 10.1101/2024.08.30.610195.

Increased burden of rare risk variants across gene expression networks predisposes to sporadic Parkinson's disease

Affiliations

Increased burden of rare risk variants across gene expression networks predisposes to sporadic Parkinson's disease

Elena Eubanks et al. bioRxiv. .

Update in

  • Increased burden of rare risk variants across gene expression networks predisposes to sporadic Parkinson's disease.
    Eubanks E, VanderSleen K, Mody J, Patel N, Sacks B, Farahani MD, Wang J, Elliott J, Jaber N, Akçimen F, Bandres-Ciga S, Helweh F, Liu J, Archakam S, Kimelman R, Sharma B, Socha P, Guntur A, Huang Y, Ramalingam N, Guadagno E, Bartels T, Dettmer U, Mouradian MM, Bahrami AH, Dai W, Baum J, Shi Z, Hardy J, Kara E. Eubanks E, et al. Cell Rep. 2025 May 27;44(5):115636. doi: 10.1016/j.celrep.2025.115636. Epub 2025 May 1. Cell Rep. 2025. PMID: 40317721 Free PMC article.

Abstract

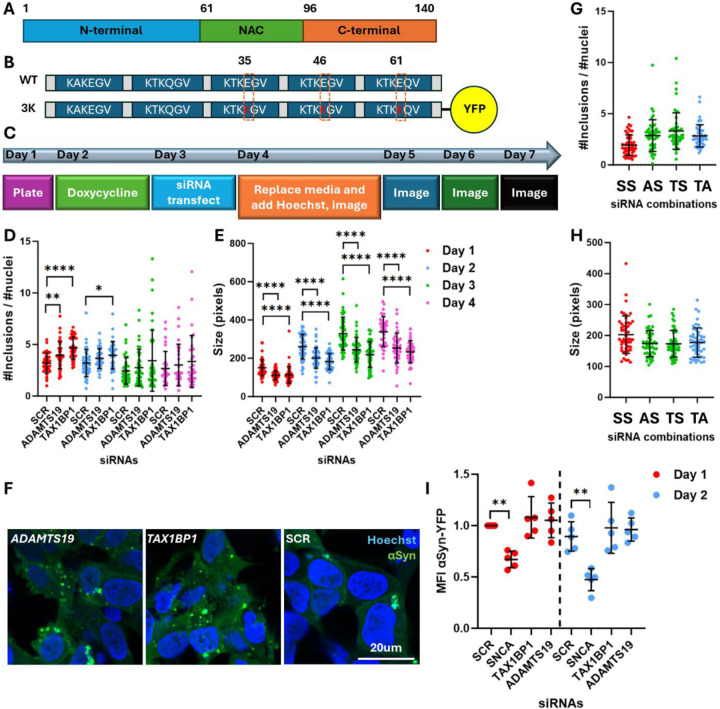
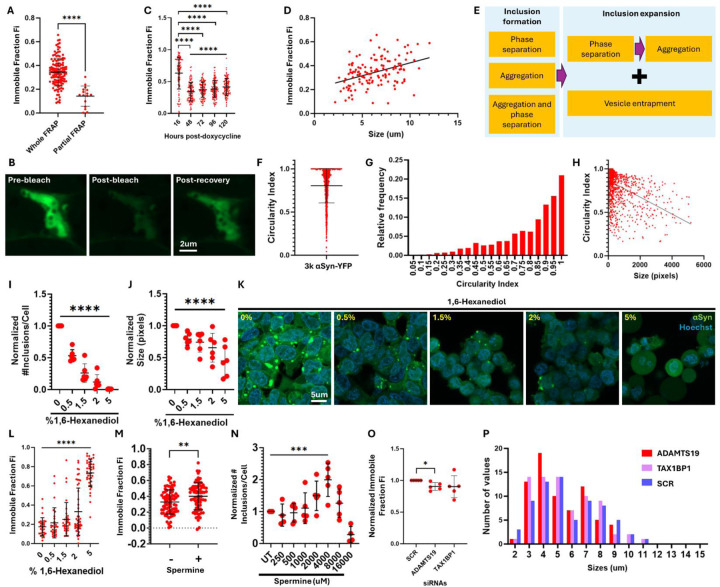
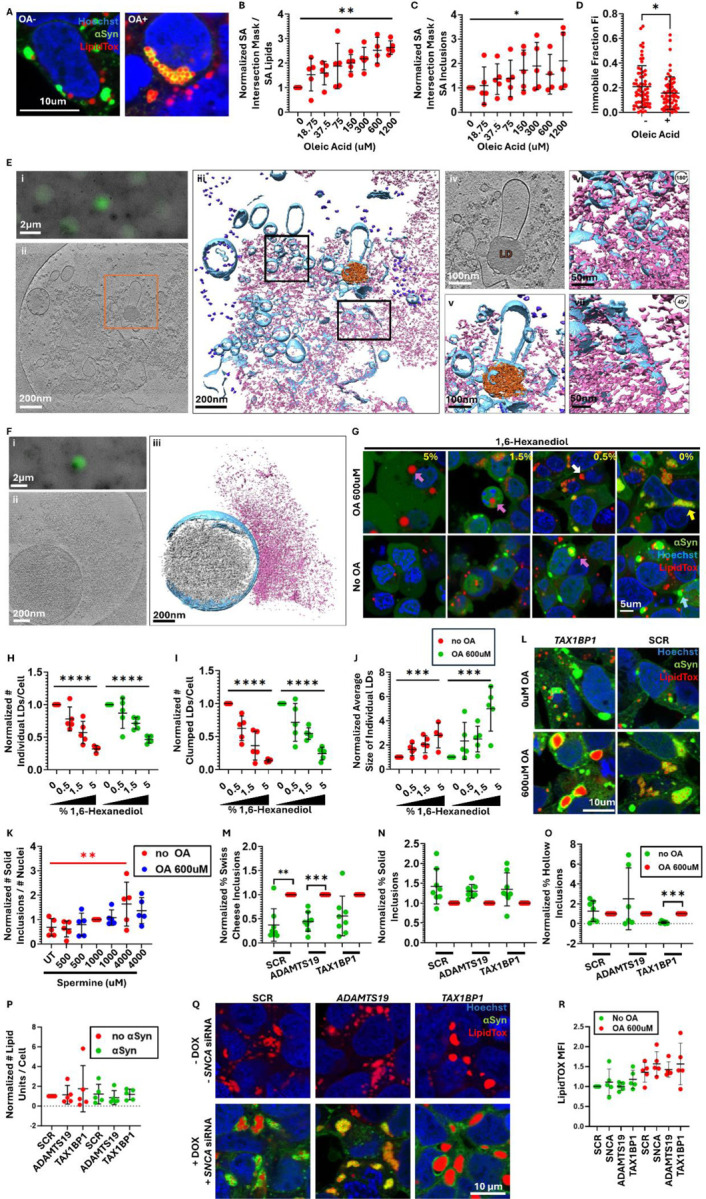
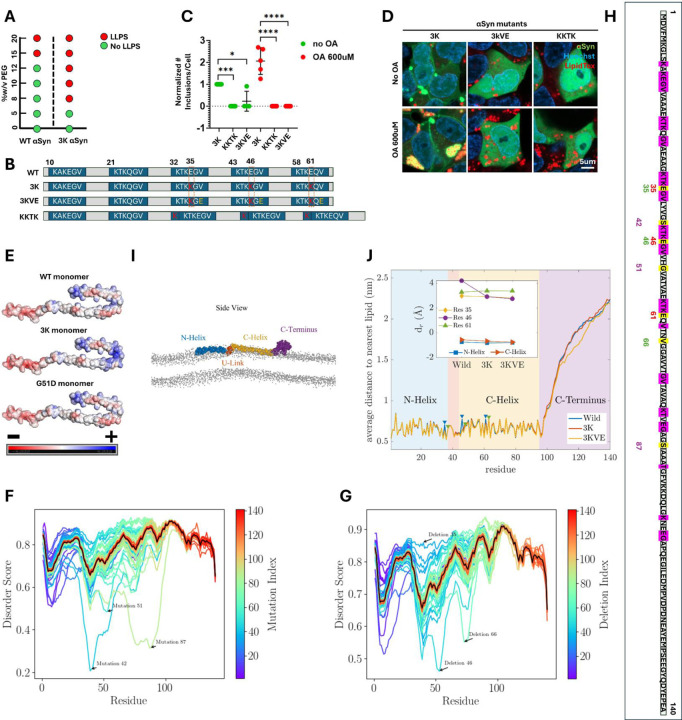
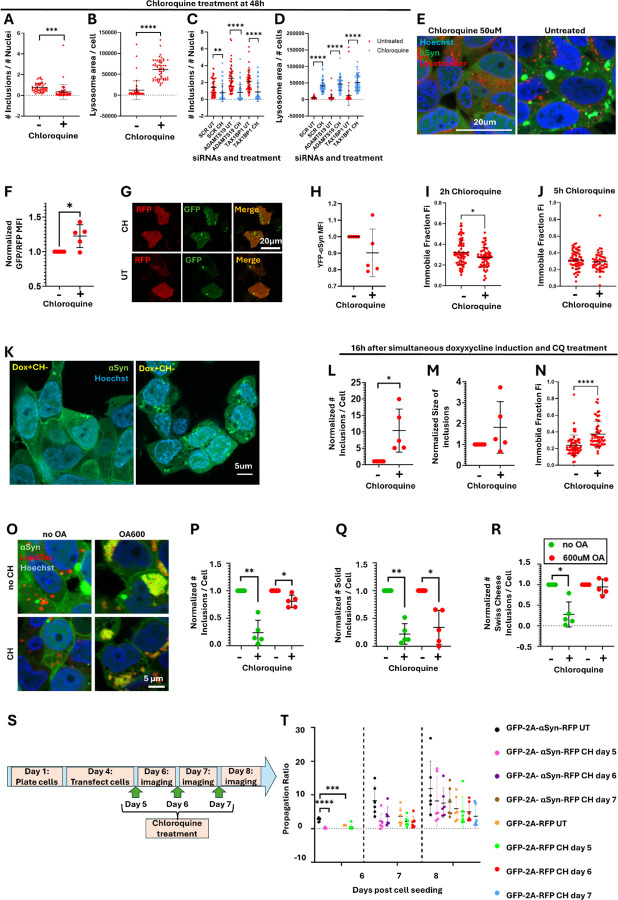
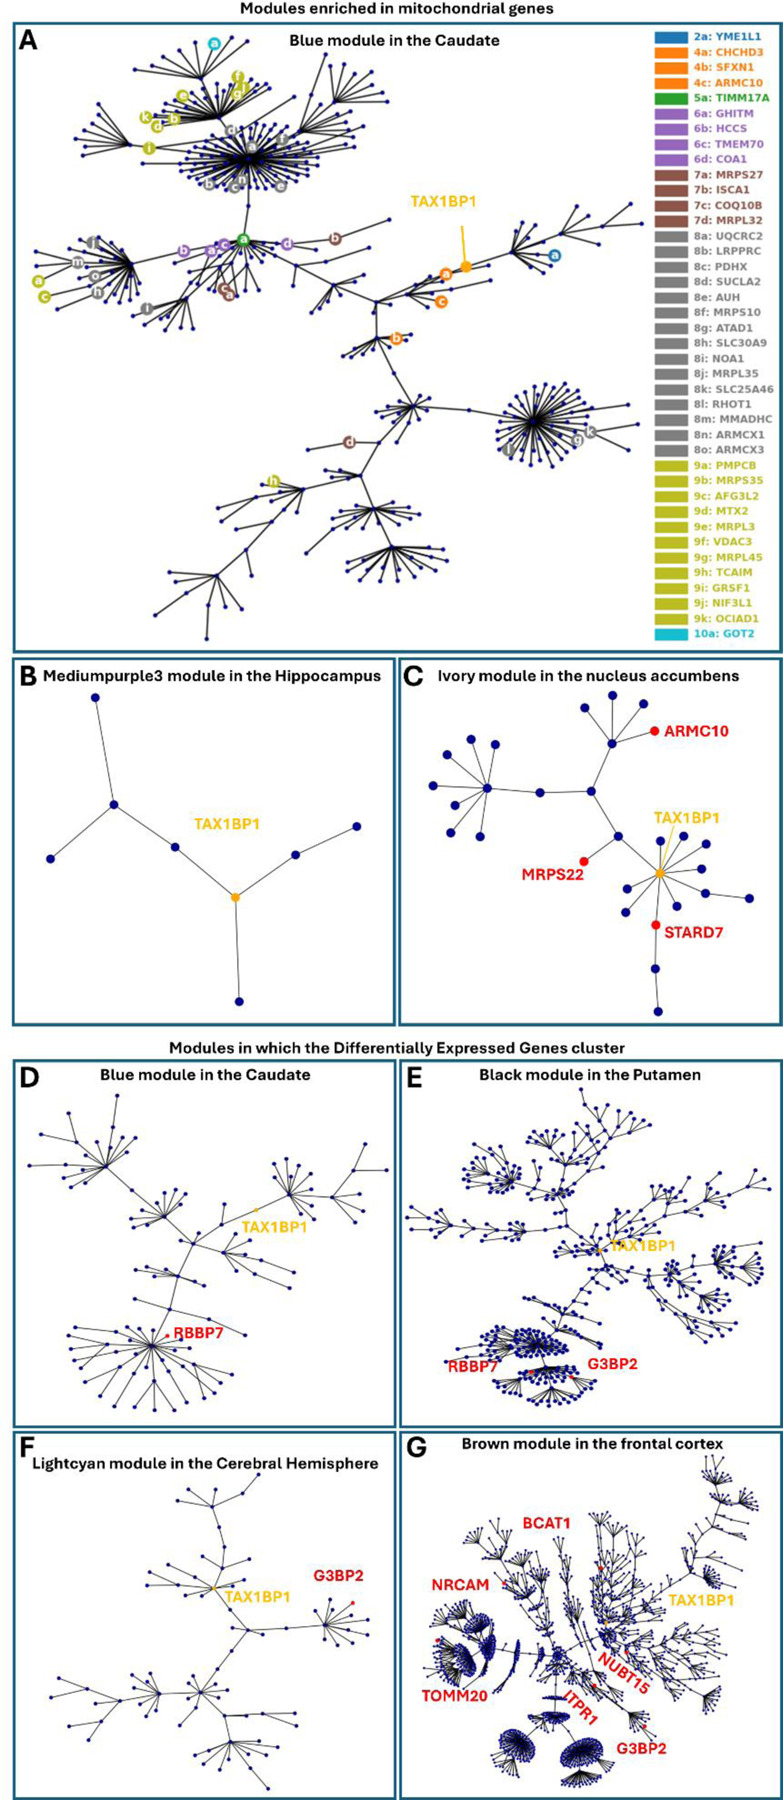
Alpha-synuclein (αSyn) is an intrinsically disordered protein that accumulates in the brains of patients with Parkinson's disease and forms intraneuronal inclusions called Lewy Bodies. While the mechanism underlying the dysregulation of αSyn in Parkinson's disease is unclear, it is thought that prionoid cell-to-cell propagation of αSyn has an important role. Through a high throughput screen, we recently identified 38 genes whose knock down modulates αSyn propagation. Follow up experiments were undertaken for two of those genes, TAX1BP1 and ADAMTS19, to study the mechanism with which they regulate αSyn homeostasis. We used a recently developed M17D neuroblastoma cell line expressing triple mutant (E35K+E46K+E61K) "3K" αSyn under doxycycline induction. 3K αSyn spontaneously forms inclusions that show ultrastructural similarities to Lewy Bodies. Experiments using that cell line showed that TAX1BP1 and ADAMTS19 regulate how αSyn interacts with lipids and phase separates into inclusions, respectively, adding to the growing body of evidence implicating those processes in Parkinson's disease. Through RNA sequencing, we identified several genes that are differentially expressed after knock-down of TAX1BP1 or ADAMTS19. Burden analysis revealed that those differentially expressed genes (DEGs) carry an increased frequency of rare risk variants in Parkinson's disease patients versus healthy controls, an effect that was independently replicated across two separate cohorts (GP2 and AMP-PD). Weighted gene co-expression network analysis (WGCNA) showed that the DEGs cluster within modules in regions of the brain that develop high degrees of αSyn pathology (basal ganglia, cortex). We propose a novel model for the genetic architecture of sporadic Parkinson's disease: increased burden of risk variants across genetic networks dysregulates pathways underlying αSyn homeostasis, thereby leading to pathology and neurodegeneration.


Conflict of interest statement

Conflict of interest M.M.M. is an inventor of filed and issued patents related to α-synuclein. M.M.M. is a founder of MentiNova, Inc. E.K. is a member of the EMBO Scientific Exchange Grants Advisory Board.

Figures

Figure 1:
Figure 1:. Effect of TAX1BP1 or ADAMTS19 knock down on αSyn inclusions.
A. Diagram showing the regions within the αSyn protein: N-terminal domain, non-Aβ component (NAC), C-terminal acidic tail. B. Diagram showing the location of the mutations in the 3K αSyn mutant protein. The E46K is a naturally occurring Mendelian mutation, whereas the E35K and E61K are artificial mutations in the flanking repeat motifs. C. Workflow of the experiments undertaken on the 3K αSyn cell line: Cells were plated on day 1, treated with doxycycline on day 2, transfected with siRNAs on day 3, fed with medium containing no phenol red on day 4, and then live imaged on day 4 onwards. D. Effect of knock-down of TAX1BP1 and ADAMTS19 versus scrambled (SCR) on the number and E. size of αSyn inclusions over several days. One way ANOVA with Dunnett test correction for multiple testing. F. Representative confocal images showing the effect of the knock-downs on αSyn inclusions. G. Effect of the combined effect of TAX1BP1 and ADAMTS19 knock-down on the number and H. size of αSyn inclusions. X axis labelling refers to the co-transfection combinations: AS: ADAMTS19+SCR+SCR; TS: TAX1BP1+SCR+SCR; TA: TAX1BP1, ADAMTS19, SCR. One way ANOVA with Dunnett test correction for multiple testing. I. Flow cytometry plots at days 1 and 2 post-transfection showing the effect of the TAX1BP1 and ADAMTS19 knock-downs on the amount of αSyn per cell, as inferred by the mean fluorescence intensity (MFI) of the YFP tag. The positive control, siRNA targeting SNCA, showed a significant reduction in MFI for YFP on both days. One way ANOVA with Dunnett test correction for multiple testing (undertaken separately for each day). 5 biological (independent) replicates were done for each experiment, unless otherwise stated. P values: *≤0.05, **≤0.01, ***≤0.001, ****≤0.0001. Only statistically significant differences are shown in the plots. Abbreviations: SCR: scrambled.
Figure 2:
Figure 2:. The role of phase separation in the formation of αSyn inclusions.
A. Fluorescence recovery after photobleaching (FRAP) plots on the inclusions formed in the 3K αSyn M17D cell line. The inclusions were bleached either in their entirety or partially by 8 iterations of the 488nm laser and their recovery was monitored in timelapse imaging. Shown in the plot is the immobile fraction (Fi), which represents the proportion of fluorescence that did not recover, as indicated by the plateau level reached. Unpaired two tailed t-test. B. Confocal images showing the appearance of one αSyn inclusion before bleaching, right after bleaching and post-recovery (plateau phase). C. Timecourse FRAP experiment showing the evolution of the Fi over 120h. The 16h timepoint was compared to each subsequent timepoint through a one way ANOVA with Dunnett test correction for multiple testing. Timepoints 48–120h were analyzed through a one way ANOVA with test for linear trend. D. XY graph showing the relationship between the size of αSyn inclusions and their Fi. Data was analyzed through Pearson and Spearman correlation tests, both of which showed a p-value <0.0001. R squared=0.1592. Equation determined through simple linear regression: Y=0.02150*X+0.2086. E. Proposed sequence of changes in the liquid-solid status of αSyn inclusions over time. F. Plot showing the circularity index of αSyn inclusions in the 3K cell line. G. Frequency plot showing the distribution of the circularity indexes for the αSyn inclusions (bin size=0.05). H. Correlation plot for the circularity index versus inclusion size. Data was analyzed through Pearson and Spearman correlation tests, both of which showed a p-value <0.0001. R squared=0.2018. Equation determined through simple linear regression: Y=-9.74e-005*X+0.8702. I. Plot showing the number and J. size of αSyn inclusions per cell after treatment with various concentrations of 1,6-Hexanediol (in %v/v). Data was analyzed through a one way ANOVA with test for linear trend. Data was normalized to the untreated control within each independent experiment prior to putting the data together, which was arbitrarily assigned the value of 1. K. Representative confocal images of 3K cells that were treated with dose-response concentrations of 1,6-Hexanediol (in %v/v). L. FRAP experiments on αSyn inclusions after treatment with dose-response concentrations of 1,6-Hexanediol (in %v/v). Data was analyzed through a one way ANOVA with test for linear trend. M. FRAP experiments on αSyn inclusions after treatment with 4000uM of Spermine. Whole inclusions were bleached. Unpaired two tailed t-test. N. Number of αSyn inclusions per cell after treatment with dose-response concentrations of Spermine. Data was normalized to the untreated control within each independent experiment, which was arbitrarily assigned the value of 1. Data was analyzed through a one way ANOVA with test for linear trend for the concentrations between 0–4000uM of Spermine. O. FRAP experiments on αSyn inclusions after knock-down of TAX1BP1 and ADAMTS19 versus non-targeting scrambled control (2 days post-transfection). Data was normalized to the negative control within each independent experiment, which was arbitrarily assigned the value of 1. Data was analyzed through one sample t-tests followed by Bonferroni correction for multiple tests. P. Frequency plot showing the distribution of the sizes of the inclusions that were analyzed for each siRNA. This was done to ensure that matched populations of inclusions were imaged for each condition, given that we have observed a change in Fi depending on the size of the inclusions (see fig. 2D). Plots containing normalized data are labelled as such on the Y axis. 5 biological replicates were done for each experiment, unless stated otherwise. P values: *≤0.05, **≤0.01, ***≤0.001, ****≤0.0001. Only statistically significant differences are shown in the plots. Abbreviations: UT: untreated; SCR: scrambled; Fi: immobile fraction.
Figure 3:
Figure 3:. Lipid droplets, membranes and vesicles integrate within αSyn inclusions.
A. Representative confocal images showing αSyn inclusions before and after treatment with 600uM of Oleic Acid (OA). Cells were stained with LipidTOX Deep Red stain for neutral lipids. B. Plot showing the fraction of the overlapping surface areas of the red (LipidTOX) and green (αSyn) masks relatively to the total surface area of the red mask. The results represent the fraction of the lipid droplets that are not embedded within αSyn inclusions. Data was analyzed through a one way ANOVA with test for linear trend. C. Plot showing the fraction of the overlapping surface areas of the green (αSyn) and red (LipidTOX) masks relatively to the total surface area of the green mask. The results represent the fraction of the αSyn inclusions that are not associated with lipid droplets. Data was analyzed through a one way ANOVA with test for linear trend. D. FRAP on lipid droplets after 16h of 600uM Oleic Acid or without Oleic Acid treatment. Lipid droplets were bleached simultaneously with 50 iterations of the 561nm and the 640nm lasers. Lipids are more mobile within lipid droplets in cells that have been treated with Oleic Acid versus untreated cells. Unpaired two tailed t-test. E. Cryo-electron tomography (cryo-ET) of cell lysates prepared from 3K M17D cells show a lipid droplet and fragmented membrane pieces meshed within amorphous αSyn aggregates. (i) Correlative light microscopy and low magnification electron microscopy (EM) image of a representative αSyn punctum. (ii) Slice view of a tomogram of the αSyn punctum in (i). (iii) Isosurface view of the tomogram. (iv) Zoom-in slice view of a lipid droplet and surrounding αSyn densities and membrane fragments as in orange box in (ii). (v) 3D Isosurface view of the lipid droplet in (iv). (vi) Isosurface view of upper left boxed in region from (iii), rotated 180° showing αSyn on the surface of membrane fragments and vesicles. (vii) Isosurface view of lower right boxed in region from (iii), rotated 45° showing αSyn densities on membranes with significant deformation. Blue: membrane; Pink: αSyn aggregate; Orange: lipid droplet; Purple: ribosomes. F. Cryo-ET of cell lysates show interactions between αSyn amorphous aggregates and mitochondrial outer membrane. (i) Correlative light microscopy and low magnification electron microscopy (EM) image of an αSyn punctum in cell lysate prepared from 3K M17D cells. (ii) Slice view of a tomogram of the αSyn punctum in (i). (iii) Isosurface view of the tomogram showing a mitochondrion with an amorphous αSyn aggregate associated with the outer membrane. Grey: mitochondria matrix; Blue: mitochondria membrane system; pink: αSyn. G. Representative confocal images of cells that were treated with dose-response concentrations of 1,6-Hexanediol (%v/v) after 16h of treatment with 600uM of Oleic Acid (OA) or no pre-treatment with OA. Yellow arrow: Swiss Cheese αSyn inclusion; Blue arrow: Solid αSyn inclusion; Purple arrows: single lipid droplet; White arrow: Clustered lipid droplets. H. Plots showing the number of individual lipid droplets per cell. For the Oleic Acid treated and untreated conditions separately, data was normalized to the untreated control within each independent experiment, which was arbitrarily assigned the value of 1. Data was analyzed through a one way ANOVA with test for linear trend. I. Plot showing the number of clustered lipid droplets per cell. For the Oleic Acid treated and untreated conditions, data was normalized to the untreated control within each independent experiment, which was arbitrarily assigned the value of 1. Data was analyzed through a one way ANOVA with test for linear trend. J. Plot showing the size of single lipid droplets. For the Oleic Acid treated and untreated conditions, data was normalized to the untreated control within each independent experiment, which was arbitrarily assigned the value of 1. Data was analyzed through a one way ANOVA with test for linear trend. K. Plot showing the normalized number of solid αSyn inclusions divided by the number of nuclei. Data was normalized to the 1000uM Spermine condition within each independent experiment, which was arbitrarily assigned the value of 1. OA-treated and untreated cells were analyzed separately through one way ANOVA with one way test for trend. This was significant only for the non OA treated condition (shown in red). L. Representative confocal images showing the effect of TAX1BP1 or ADAMTS19 knock-down on the lipid droplets in the presence or absence of αSyn protein. M. Plot showing the normalized proportion of Swiss cheese inclusions after knocking down TAX1BP1 or ADAMTS19, versus scrambled control, in the presence or absence of Oleic Acid treatment. Data was normalized to the untreated sample for each siRNA, which was designated arbitrarily as 1. Data was analyzed through one sample t-tests followed by Bonferroni correction for multiple tests. 8 biological replicates. N. Plot showing the normalized proportion of solid inclusions after knocking down TAX1BP1 or ADAMTS19, versus scrambled control, in the presence or absence of Oleic Acid treatment. Data was normalized to the untreated sample for each siRNA, which was designated arbitrarily as 1. Data was analyzed through one sample t-tests followed by Bonferroni correction for multiple tests. 8 biological replicates. O. Plot showing the normalized proportion of hollow inclusions after knocking down TAX1BP1 or ADAMTS19, versus scrambled control, in the presence or absence of Oleic Acid treatment. Data was normalized to the untreated sample for each siRNA, which was designated arbitrarily as 1. Data was analyzed through one sample t-tests followed by Bonferroni correction for multiple tests. 8 biological replicates. P. Number of lipid units (including single and clumped lipid droplets) per cell after knocking down TAX1BP1 or ADAMTS19 versus scrambled control, in the presence and absence of endogenous αSyn. Data was normalized to the SCR siRNA, which was designated arbitrarily as 1. Samples in the presence and absence of endogenous αSyn were analyzed separately through a one way ANOVA with Dunnett test correction for multiple testing. Q. Representative confocal images for (P). R. Flow cytometry experiments showed that knock down of TAX1BP1 or ADAMTS19 did not affect the amount of intracellular lipids (as indicated by the MFI of LipidTOX neutral lipid dye) 2 days after transfection, either with or without treatment with 600uM of Oleic Acid. One way ANOVA with Dunnett test correction for multiple testing. Data was normalized to the untreated control within each independent experiment, which was arbitrarily assigned the value of 1, unless stated otherwise. Plots containing normalized data are labelled as such on the Y axis. 5 biological replicates were done for each experiment, unless otherwise stated. P-values: *≤0.05, **≤0.01, ***≤0.001, ****≤0.0001. Only statistically significant differences are shown in the plots. Abbreviations: OA: Oleic Acid; SA: surface area; LDs: lipid droplets; DOX: doxycycline; MFI: mean fluorescence intensity.
Figure 4:
Figure 4:. The propensity of 3K αSyn to phase separate and interact with lipids.
A. Phase separation diagram showing the phase separation of αSyn at various concentrations of crowding agent PEG-8000 and αSyn protein (wild type versus 3K mutant). B. Diagrams of the amino acid sequence of αSyn showing the wild type (WT) version, as well as the artificial mutants studied. The repeat motifs are in blue rectangles. In red are the glutamic acid to lysine substitutions. In yellow are the valine to glutamic acid substitutions. C. Number of αSyn inclusions per cell for the three artificial mutants: 3K, KKTK, 3KVE. Data was normalized to the 3K sample without Oleic Acid treatment, which was arbitrarily designated as 1. Data was analyzed through a one way ANOVA with Dunnett test correction for multiple testing, separately for the OA-treated and untreated conditions. P-values: *≤0.05, **≤0.01, ***≤0.001, ****≤0.0001. Only statistically significant differences are indicated on the plot. D. Representative confocal images of the 3K, 3KVE and KKTK αSyn mutants, with and without Oleic Acid treatment. E. Diagrams showing the electrostatic charges for monomeric αSyn (wild type, 3K and G51D mutants). F. Plot showing the disorder score for the αSyn protein after sequentially mutating one by one every residue into an amino acid with opposite properties. G. Plot showing the disorder score for the αSyn protein after sequentially deleting one by one every residue. H. Diagram of the amino acid sequence of the αSyn protein showing the artificial mutations studied. Highlighted in pink are the imperfect KTKEGV repeat motifs and in yellow the mutations. In red font are the mutated residues in the 3K protein, in green and in purple are the residues whose deletion or substitution with amino acids with opposite properties, respectively, was found to profoundly impact disorder in silico. I. Side view of coarse-grained representation of the wild-type αSyn in the Martini model. Different regions of the protein including the N-Helix (residues 1–33), U-Link (residues 34–44), C-Helix (residues 45–92), and the C-Terminus (residues 93–140) are shown in blue, orange, yellow, and purple, respectively. The head groups of POPG lipids are shown in grey. J. The average distance of each residue to the nearest lipid during the 6μs-long simulation. Blue triangle markers correspond to the mutated residues 35, 46, 61, and green markers indicate the mutated residues 37, 48, 63, both with respect to the wild type alpha-synuclein. The inset shows the relative depth dr of the mutated residues and the centres of mass of the N- and C-Helices with respect to the lipid bilayer’s top surface for each mutant. Abbreviations: WT: Wild type; LLPS: liquid liquid phase separation; OA: Oleic Acid; POPG: palmitoyloleoylphosphatidylglycerol.
Figure 5:
Figure 5:. Mitochondrial bioenergetics are impacted by TAX1BP1 or ADAMTS19 knock down.
A. Plot showing the mean fluorescence intensity (MFI) of TMRM (tetramethylrhodamine methyl ester) after knock-down of TAX1BP1 or ADAMTS19, versus scrambled (SCR) control. CCCP (carbonyl cyanide m-chlorophenyl hydrazone) was used as a positive control, and showed a statistically significant reduction in TMRM MFI in comparison to the untreated control. Z-stacks were acquired and the maximum intensity projection images quantified. Data was analyzed through a one way ANOVA with Dunnett test correction for multiple testing, separately for the OA-treated and untreated conditions; only the SCR, ADAMTS19 and TAX1BP1 samples were included. B. Representative confocal images for the data plotted in (A). C. Timecourse experiment measuring the MFI of TMRM after treatment with oligomycin, rotenone and FCCP. Single plane images were taken for each timepoint. D. FRET (Forster Resonance Energy Transfer) of the ATP FRET reporter used to quantify the amount of intracellular ATP. E. Representative confocal images of the ATP FRET reporter and FRET channel from (D). Ratiometric image of FRET channel normalized to CFP channel is also shown. F. Timecourse ATP FRET measurements for each of the knockdowns versus scrambled control after treatment with oligomycin and iodoacetic acid (IAA). The timepoints for each siRNA were internally normalized to the first timepoint, which was arbitrarily designated as 1. To facilitate illustration of any differences between the slopes for each sample, it was easier for each curve to start at the same value on the Y axis. G. Timecourse DHE (dihydroethidium) MFI measurements for each of the knockdowns versus scrambled control and positive control (menadione). Timepoints were normalized to the first timepoint within each sample separately, as described in (F). H. Plot showing the slopes for each condition analyzed in (G). I. Timecourse of the MitoTrackerRed CM-H2XRos MFI for each of the siRNAs studied. Timepoints were normalized to the first timepoint within each sample separately, as described in (F). J. Plot showing the slopes for each condition analyzed in (I). K. Timecourse of the C11-Bodipy 581/591 MFI ratio for each of the siRNAs studied. Timepoints were normalized to the first timepoint within each sample separately, as described in (F). L. Plot showing the slopes for each condition analyzed in (K). M. Representative confocal images for (K,L). N. Mitochondrial mass as assessed through the volumetric ratio of TMRM/calcein through z-stack experiments. O. Representative confocal images for (N). P. 2-NBDG (2-(N-(7-Nitrobenz-2-oxa-1,3-diazol-4-yl)Amino)-2-Deoxyglucose) MFI for 500uM and Q. 250uM of the fluorescent glucose analogue to assess the impact of knocking-down the genes of interest on the efficiency of the glucose uptake. R. Representative confocal images for (P,Q). S. Plot showing the percentage of dead cells after transfection of each siRNA. 5%v/v of 1,6-Hexanediol was used as a positive control. Dead cells take up propidium iodide (PI) dye, but alive ones do not. T. Representative confocal images for (S). Data was normalized to the scrambled (SCR) control within each independent experiment, which was arbitrarily assigned the value of 1, unless stated otherwise in the legend. Plots containing normalized data are labelled as such on the Y axis. 5 biological replicates were done for each experiment, unless otherwise stated. P-values: *≤0.05, **≤0.01, ***≤0.001, ****≤0.0001. Only statistically significant differences are shown in the plots. Abbreviations: MFI: Mean fluorescence intensity; TMRM: tetramethylrhodamine methyl ester; CCCP: carbonyl cyanide m-chlorophenyl hydrazone; UT: untreated; SCR: scrambled; FRET: Forster Resonance Energy Transfer; A.U.: arbitrary units; FCCP: Carbonyl cyanide p-trifluoromethoxyphenylhydrazone; IAA: iodoacetic acid; DHE: dihydroethidium; PI: propidium iodide; 2-NBDG: 2-(N-(7-Nitrobenz-2-oxa-1,3-diazol-4-yl)Amino)-2-Deoxyglucose.
Figure 6:
Figure 6:. Effect of Chloroquine treatment on αSyn inclusions.
A. Cells were treated with 50uM of chloroquine for 2h at 48h after doxycycline induction and the number of αSyn inclusions per cell B. And lysosomal surface area was quantified. Unpaired two tailed t-tests. C. Number of αSyn inclusions per cell D. and lysosomal surface area with and without treatment with 50uM of chloroquine at 48h after doxycycline induction and siRNA knock-down of ADAMTS19 and TAX1BP1. Unpaired two tailed t-tests. E. Representative confocal images for (A,B). F. Uninduced M17D cells were transfected with a construct encoding GFP-LC3-RFP-LC3ΔG; the protein product is cleaved by endogenous ATG4 proteases into GFP-LC3 and RFP-LC3ΔG. GFP-LC3 is digested through autophagy, whereas RFP-LC3ΔG remains in the cytoplasm. The GFP/RFP ratio is a measure of autophagy activation, with a lower ratio representing a higher autophagy rate. Chloroquine treatment resulted in an increased GFP/RFP ratio in comparison to untreated control, indicating a blockage in autophagy. One sample t-test. G. Representative confocal images of (F). H. Flow cytometry experiments showed that the MFI of YFP did not change after 5h of chloroquine treatment, indicating that chloroquine treatment does not affect the amount of αSyn per cell. One sample t test. I. Effect of 2h chloroquine treatment at 48h after doxycycline induction on the immobile fraction of αSyn inclusions, as determined by FRAP experiments. Unpaired two tailed t-test. J. Effect of 5h chloroquine treatment at 48h after doxycycline induction on the immobile fraction of αSyn inclusions, as determined by FRAP experiments. Unpaired two tailed t-test. K. Representative confocal images showing αSyn inclusions that formed 16h after simultaneous doxycycline induction and chloroquine treatment. L. Quantification of (K) showing that chloroquine treated cells showed a larger number of αSyn inclusions per cell, M. but there was no difference in the average size of the inclusions. N. FRAP measurements showed that chloroquine treatment significantly increased the immobile fraction of the inclusions. (L-M) were analyzed through one sample t-tests and (N) by unpaired two tailed t-test. O. Representative confocal images of 3K cells after 16h of 600uM Oleic Acid treatment and 5h of 50uM chloroquine treatment. All four combinations of treatment statuses were tested. P. Plot showing the total number of αSyn inclusions per cell, Q. the number of solid αSyn inclusions per cell and R. the number of Swiss cheese αSyn inclusions per cell after 5h of chloroquine treatment in comparison to the untreated condition, and in the presence or absence of pre-treatment with 600uM of Oleic Acid. Samples that were and were not pre-treated with Oleic Acid were normalized separately to the non-chloroquine treated condition, which was arbitrarily designated as 1. One sample t-tests. S. Diagram showing the workflow of the chloroquine experiment in cultured cells that were transfected with the GFP-2A-αSyn-RFP or the GFP-2A-RFP constructs to monitor αSyn propagation. Cells were seeded in coverglass bottom chamberslides on day 1. T. Propagation ratio of αSyn-RFP and RFP alone. To determine the propagation ratio, the green mask was subtracted from the red mask to identify the regions that contained only RFP (and thereby propagating protein); the surface area of those regions was divided with the surface area of the green mask for within-image normalization. Prior to putting all the data from independent experiments together, data was normalized to the GFP-2A-RFP negative control at day 6, which was arbitrarily designated as 1. For an explanation on what the number of days correspond to, please refer to panel S. 6 biological replicates. Two way ANOVA with Tukey’s correction. Data was normalized to the untreated control within each independent experiment, which was arbitrarily assigned the value of 1, unless stated otherwise. 5 biological replicates were done for each tissue culture experiment, unless otherwise stated. Plots containing normalized data are labelled as such on the Y axis. P-values: *≤0.05, **≤0.01, ***≤0.001, ****≤0.0001. Only statistically significant differences are shown in the plots. Abbreviations: WT: wild type; CQ: chloroquine; FRAP: fluorescence recovery after photobleaching; OA: Oleic Acid; UT: untreated.
Figure 7:
Figure 7:. TAX1BP1 genetic networks.
A. Gene expression modules containing TAX1BP1 that are enriched in mitochondrial genes. Blue module in the caudate. B. Medium purple 3 module in the hippocampus. C. Ivory module in the nucleus accumbens. D. Gene expression networks in which differentially expressed genes, as determined through RNA sequencing after TAX1BP1 knock down, cluster more significantly than expected by random chance. Blue module in the caudate. E. Black module in the putamen. F. Light cyan module in the cerebral hemisphere. G. Brown module in the frontal cortex.

References

    1. S A. (2010) Visualization and analysis of atomistic simulation data with OVITO–the Open Visualization Tool. Modelling Simul Mater Sci Eng 18
    1. Agarwal A, Chandran A, Raza F, Ungureanu IM, Hilcenko C, Stott K, Bright NA, Morone N, Warren AJ, Lautenschlager J (2024) VAMP2 regulates phase separation of alpha-synuclein. Nat Cell Biol - PMC - PubMed
    1. Banfi S, Servadio A, Chung MY, Kwiatkowski TJ Jr., McCall AE, Duvick LA, Shen Y, Roth EJ, Orr HT, Zoghbi HY (1994) Identification and characterization of the gene causing type 1 spinocerebellar ataxia. Nat Genet 7: 513–520 - PubMed
    1. Bartels T, Choi JG, Selkoe DJ (2011) alpha-Synuclein occurs physiologically as a helically folded tetramer that resists aggregation. Nature 477: 107–110 - PMC - PubMed
    1. Bauerlein FJB, Saha I, Mishra A, Kalemanov M, Martinez-Sanchez A, Klein R, Dudanova I, Hipp MS, Hartl FU, Baumeister W, Fernandez-Busnadiego R (2017) In Situ Architecture and Cellular Interactions of PolyQ Inclusions. Cell 171: 179–187 e110 - PubMed

Publication types

LinkOut - more resources