[Preprint]. 2024 Aug 30:2024.08.30.610426.
doi: 10.1101/2024.08.30.610426.

Self-Assembled Generation of Multi-zonal Liver Organoids from Human Pluripotent Stem Cells

Affiliations

Self-Assembled Generation of Multi-zonal Liver Organoids from Human Pluripotent Stem Cells

Hasan Al Reza et al. bioRxiv. .

Update in

Abstract

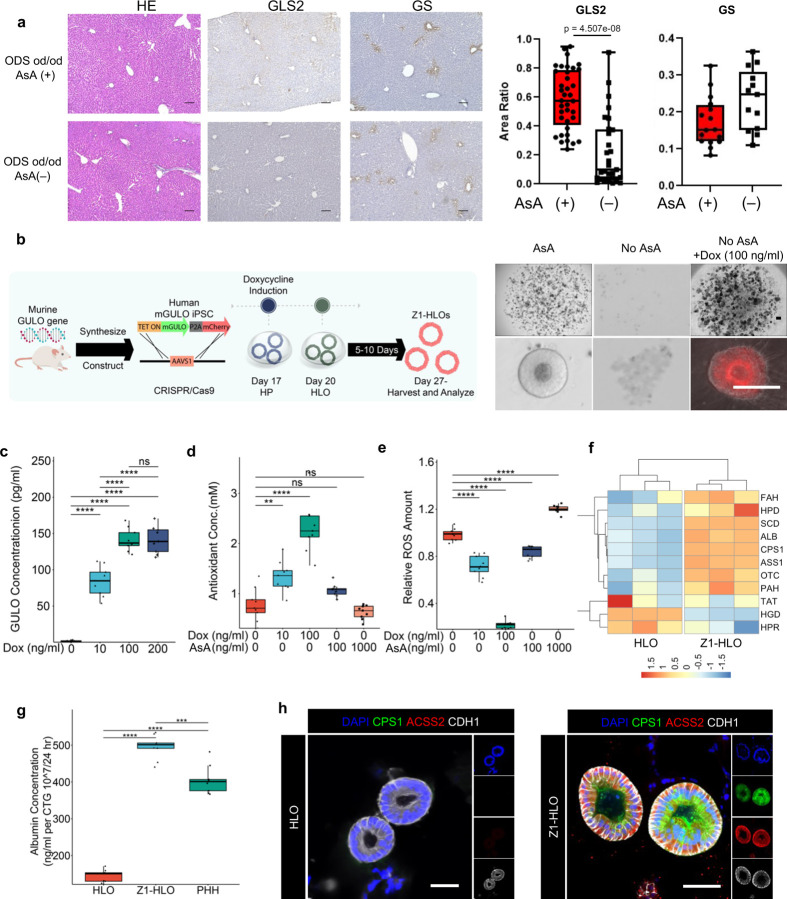
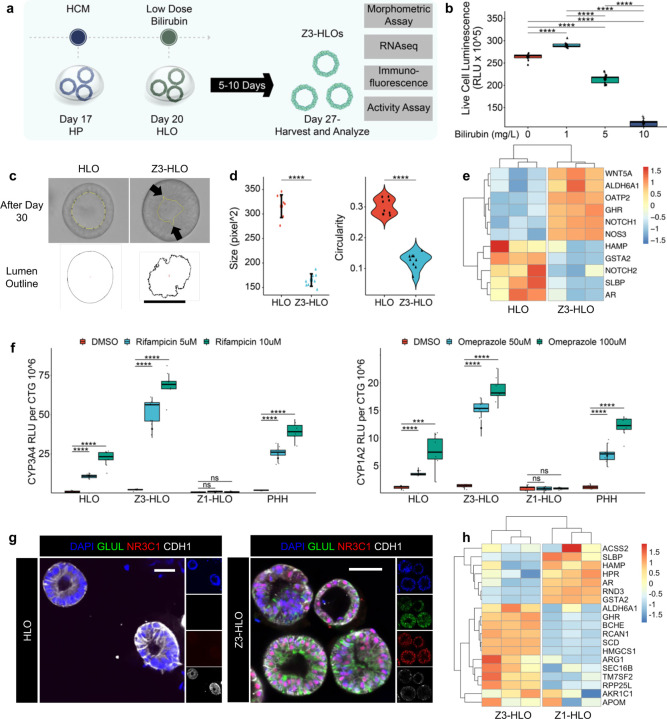
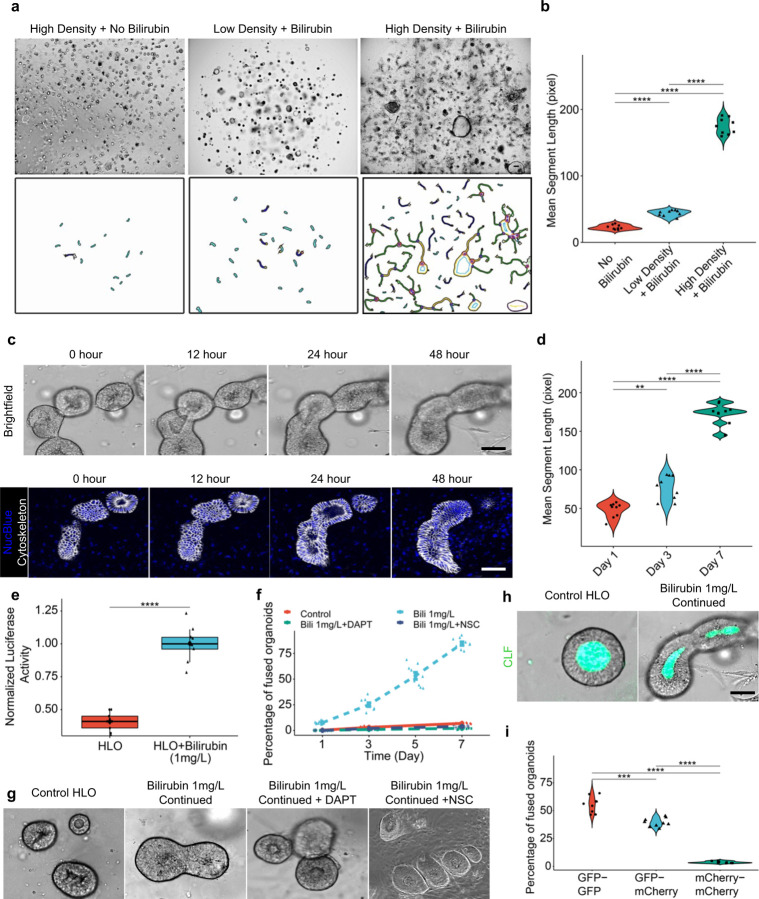
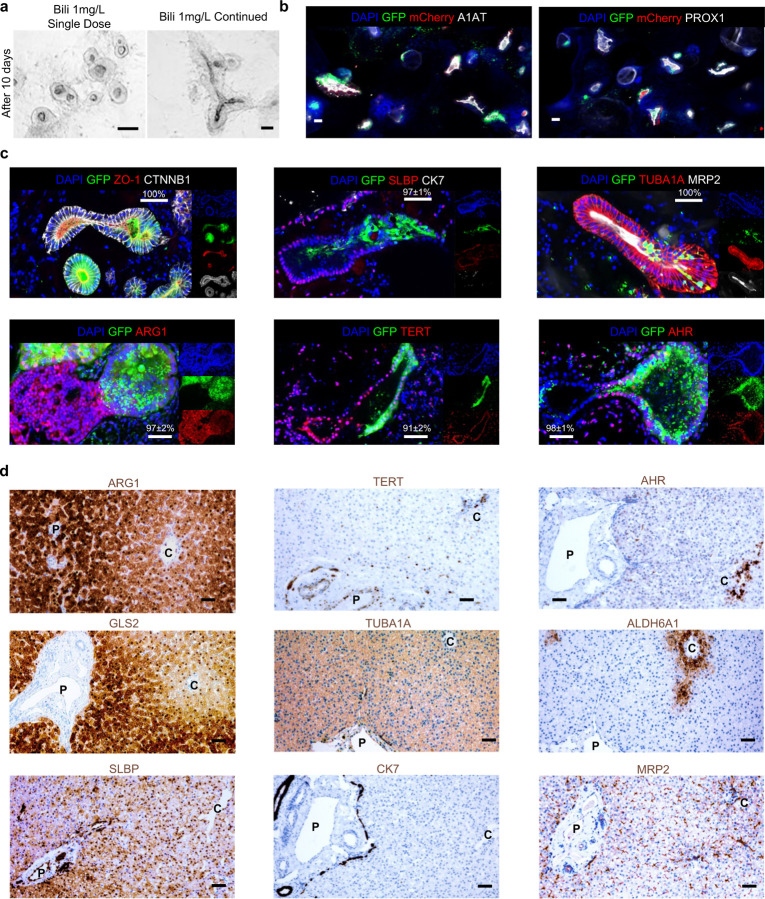
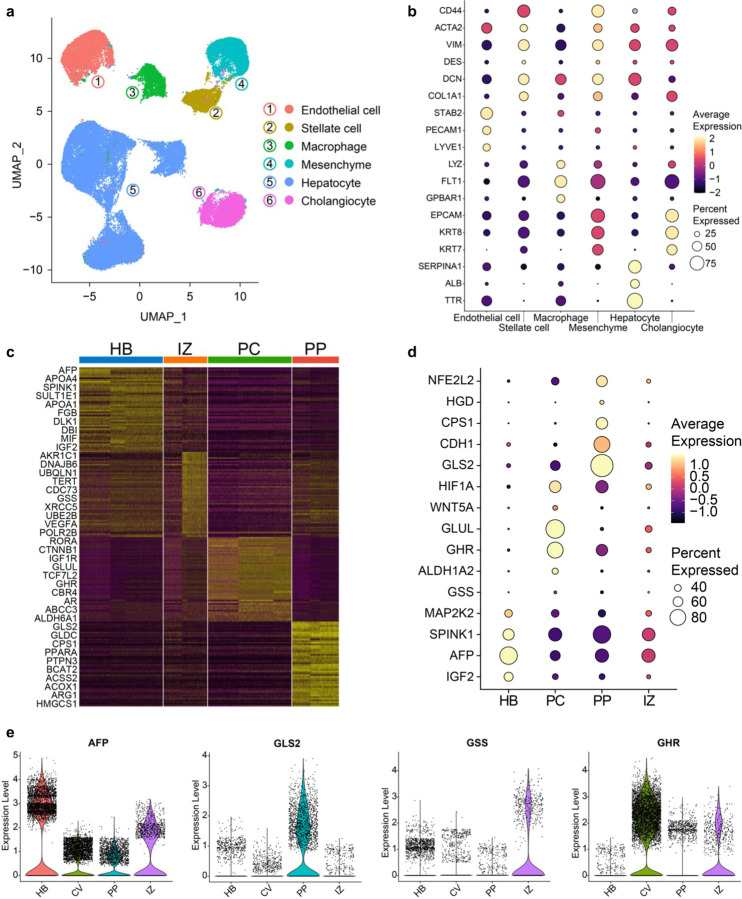
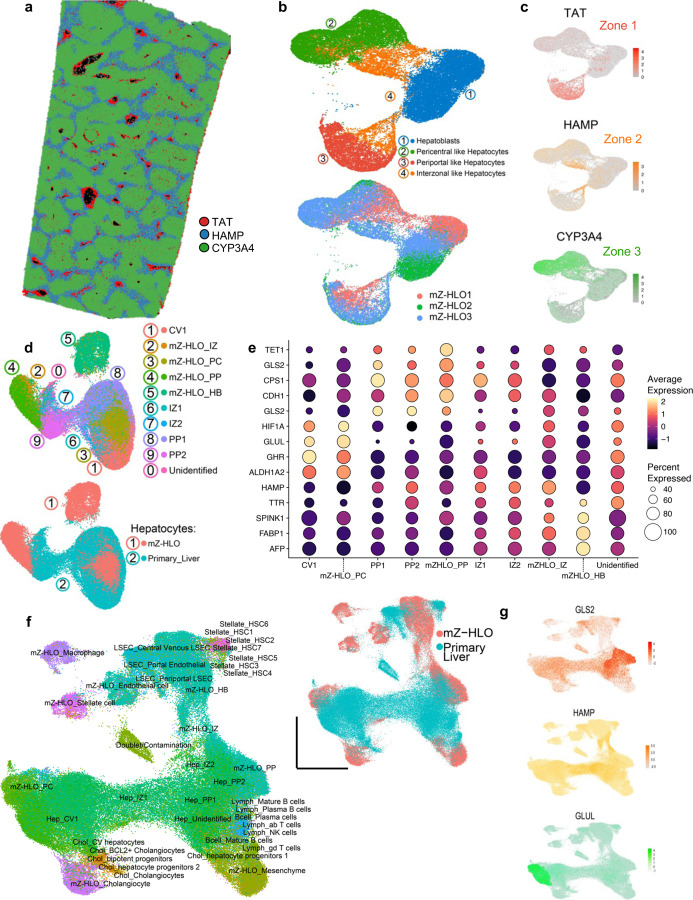
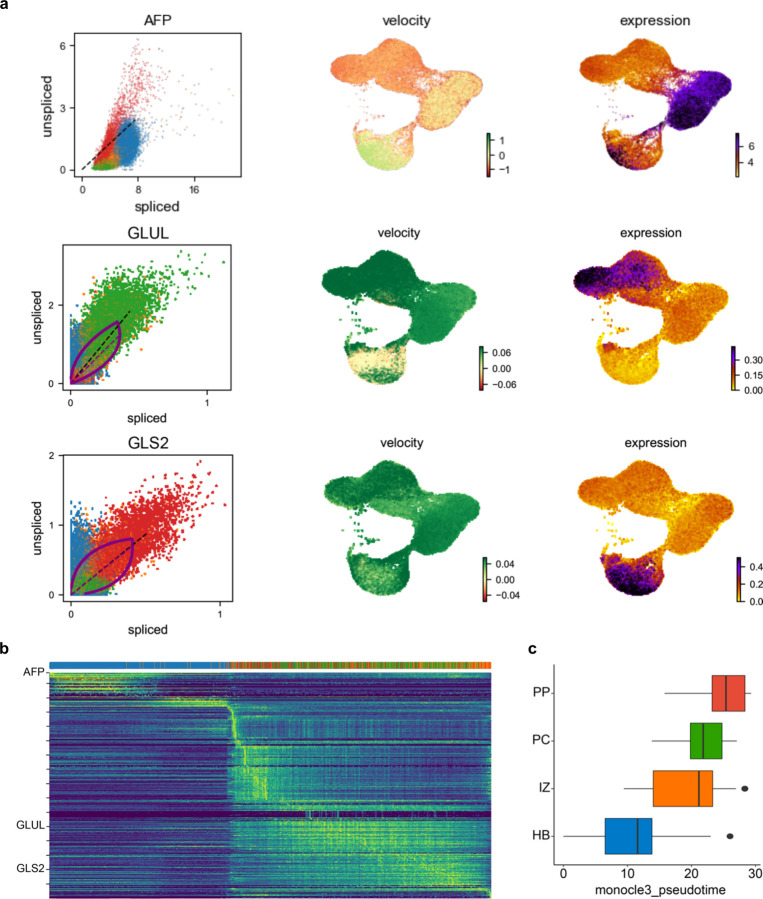
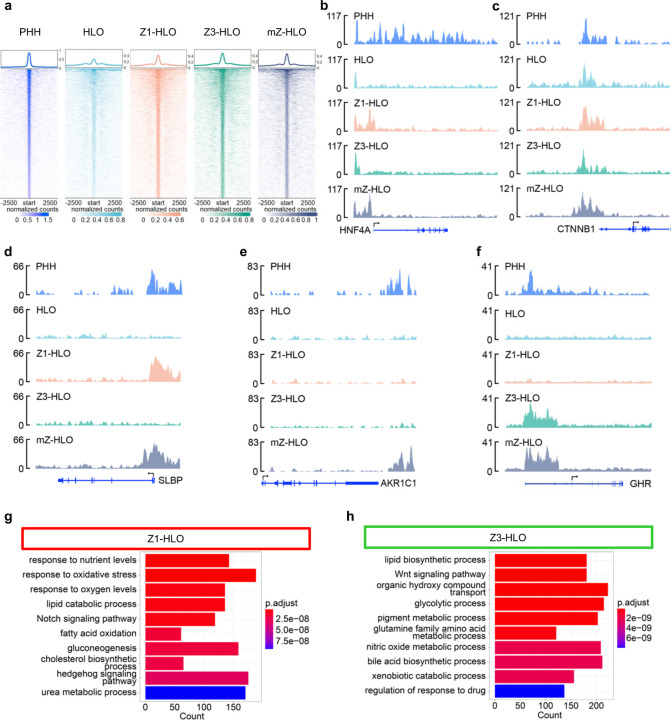
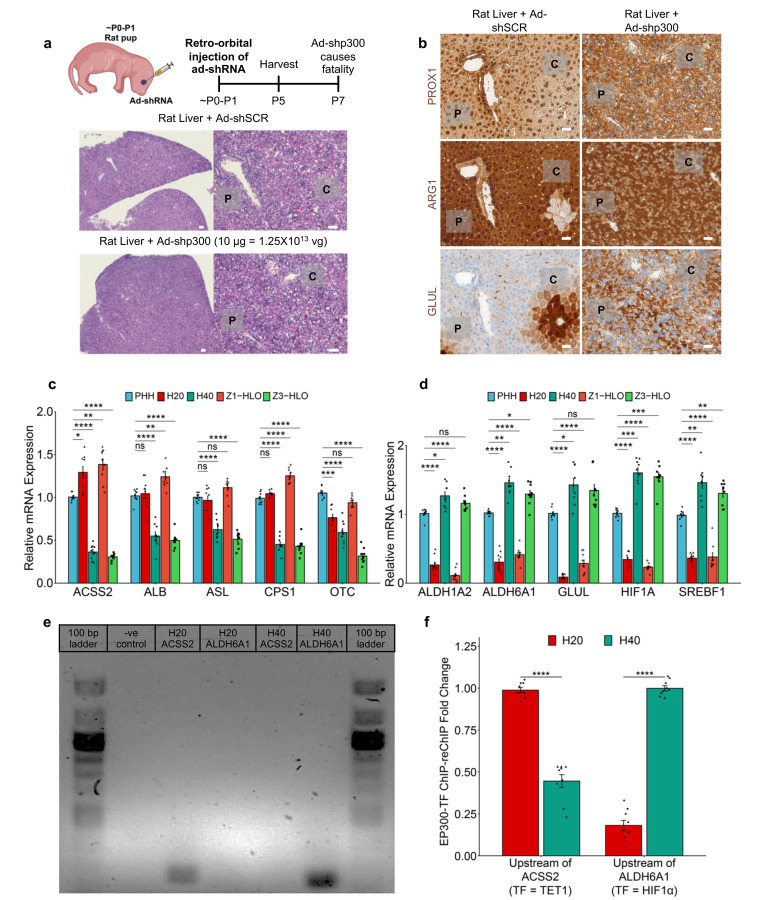
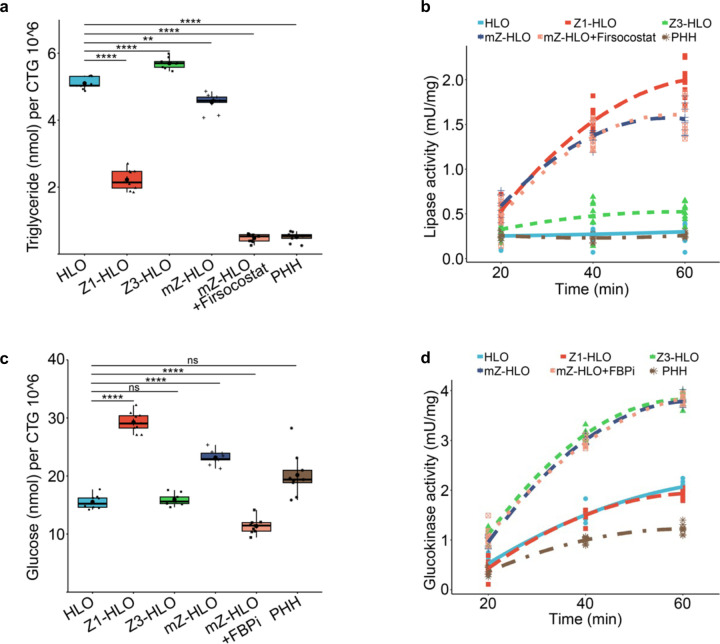
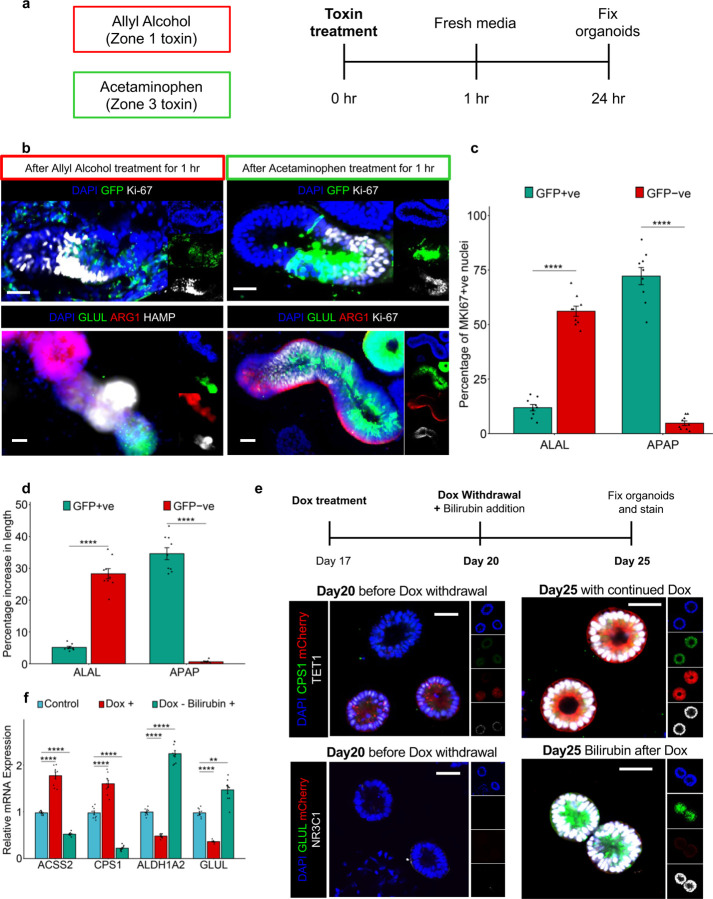
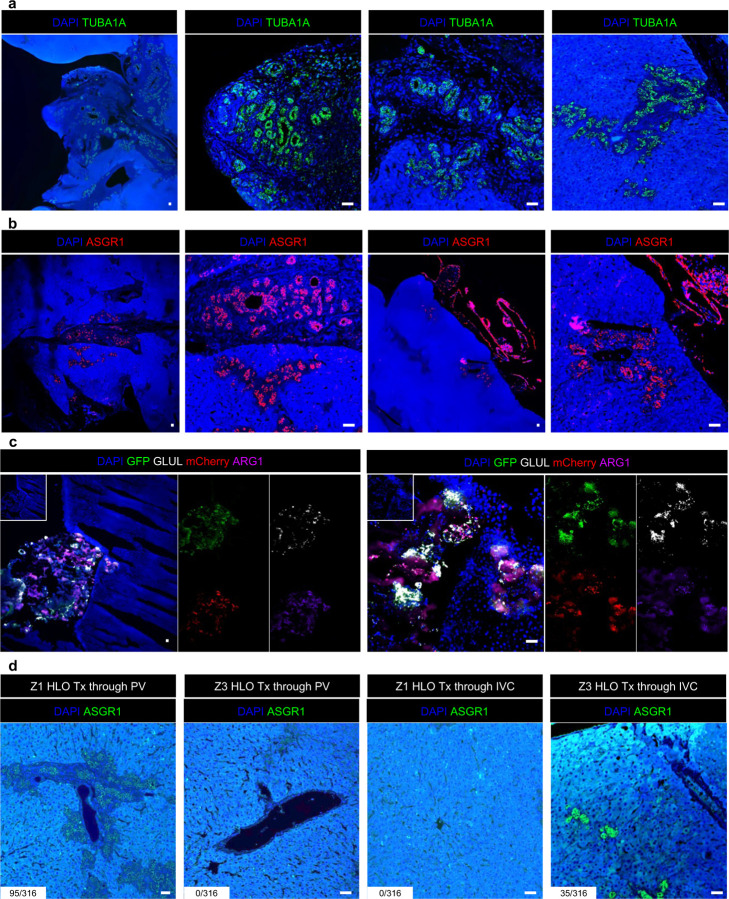
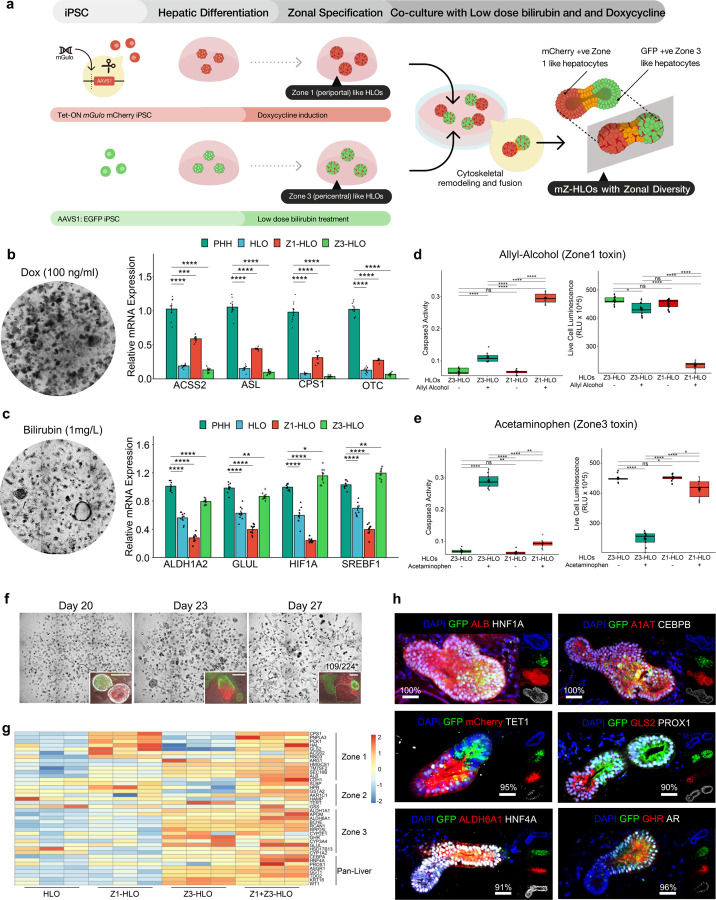
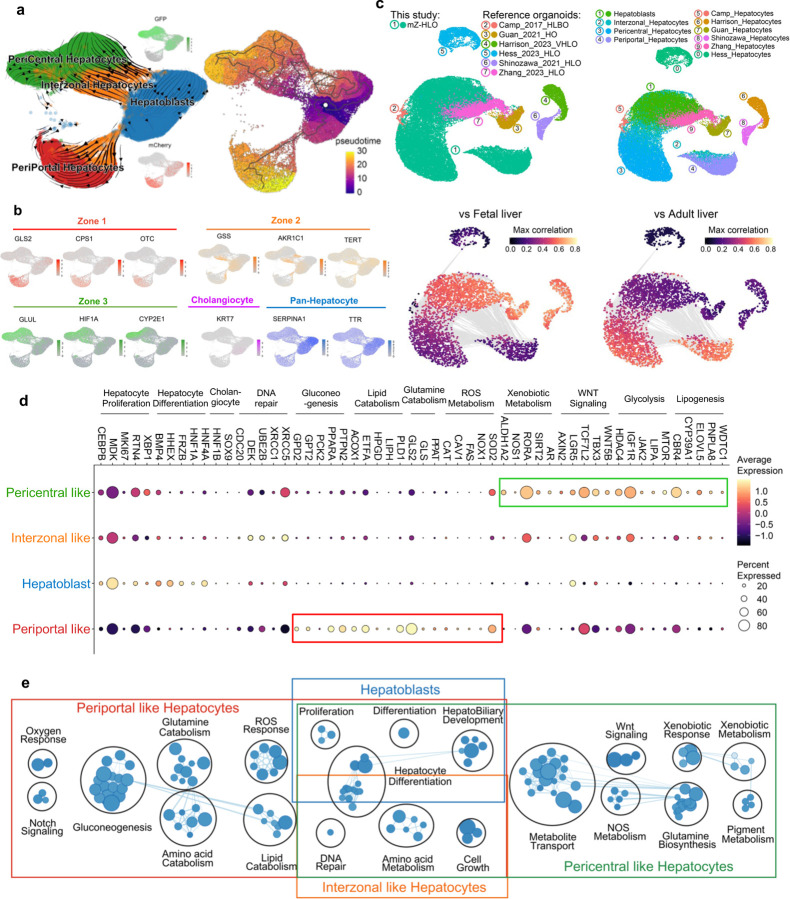
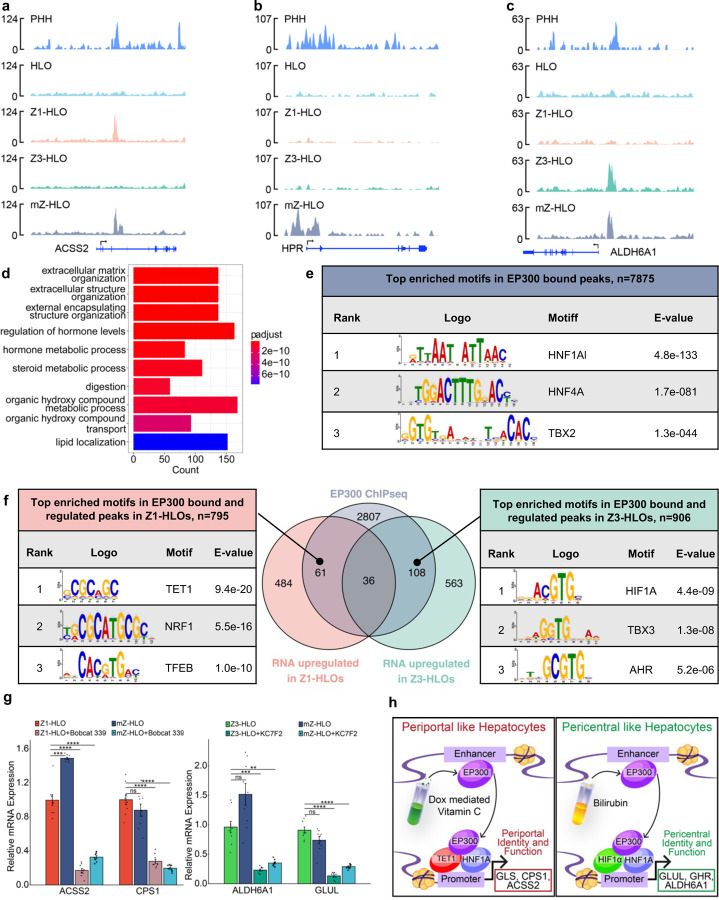
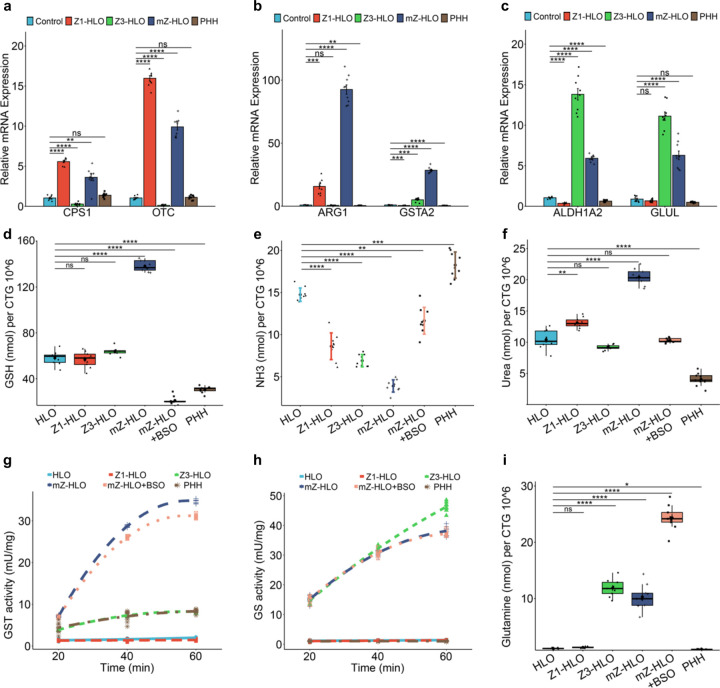
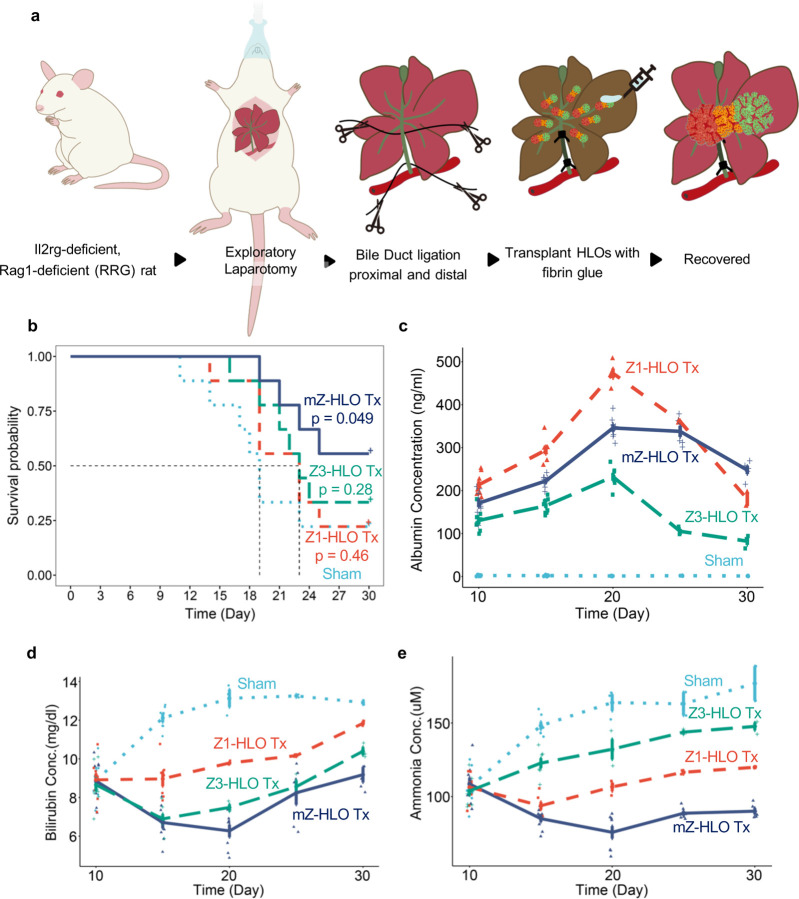
Distinct hepatocyte subpopulations are spatially segregated along the portal-central axis and critical to understanding metabolic homeostasis and liver injury. While several bioactive molecules have been described to play a role in directing zonal fates, including ascorbate and bilirubin, in vitro replication of zonal liver architecture has not been achieved to date. In order to evaluate hepatic zonal polarity, we developed a self-assembling zone-specific liver organoid culture by co-culturing ascorbate and bilirubin enriched hepatic progenitors derived from human induced pluripotent stem cells. We found that preconditioned hepatocyte-like cells exhibited zone-specific functions associated with urea cycle, glutathione synthesis and glutamate synthesis. Single nucleus RNA sequencing analysis of these zonally patterned organoids identifies hepatoblast differentiation trajectory that mimics periportal-, interzonal-, and pericentral human hepatocytes. Epigenetic and transcriptomic analysis showed that zonal identity is orchestrated by ascorbate or bilirubin dependent binding of histone acetyltransferase p300 (EP300) to methylcytosine dioxygenase TET1 or hypoxia-inducible factor 1-alpha (HIF1α). Transplantation of the self-assembled zonally patterned human organoids improved survival of immunodeficient rats who underwent bile duct ligation by ameliorating the hyperammonemia and hyperbilirubinemia. Overall, this multi-zonal organoid system serves as an in vitro human model to better recapitulate hepatic architecture relevant to liver development and disease.


Conflict of interest statement

Competing interests The authors declare no competing interests.

Figures

Extended Data Fig. 1.
Extended Data Fig. 1.. Intracellular redox management enables CPS1+ hepatocyte specification in HLOs.
a) H&E histology, GLS2 IHC, and GS IHC images of liver sections are shown in panels (ODS od/od (GULO mutant) rat treated with 0.2% Ascorbic acid (AsA), ODS od/od rat treated without AsA. Scale bars indicate 100µm. The graph shows the GLS2 or GS positive area ratio versus the hematoxylin positive area in ODS od/od (GULO mutant) rat treated with 0.2% Ascorbic acid (AsA) and ODS od/od rat treated without AsA (n=2; Mean +-SD, Mann-Whitney U test, p = 4.507e-08) Data points are shown GLS2 area at portal vein (37 portal vein sections of + AsA rats, 27 portal vein sections of - AsA rats) and GS area in 8 images of +/− AsA rat for analysis with Fiji. b) Schematic for development of Z1-HLOs and doxycycline induction to induce CPS1+ hepatocyte specification (left). Brightfield and fluorescence images of mCherry expression in ascorbate depleted Dox (100 ng/ml) treated Z1-HLOs compared to HLOs with ascorbic acid depletion at day 20 and control HLOs (right). c) ELISA for mGULO protein concentration in Dox treated Z1-HLOs compared to control HLOs. (n = 9 independent experiments) d) Cellular Antioxidant concentration in Dox treated Z1-HLOs compared to control HLOs. (n = 9 independent experiments) e) ROS levels in Dox treated and extracellular ascorbate induced Z1-HLOs compared to control HLOs. (n = 9 independent experiments) f) Heatmap of Zone 1 genes from RNAseq dataset for Dox treated Z1-HLOs compared to control. g) Albumin ELISA for Z1-HLOs treated with Dox compared to control HLOs and PHH normalized by cell viability. (n = 9 independent experiments) h) Immunofluorescence images of Dox treated Z1-HLOs for CPS1, ACSS2 and CDH1 compared to control HLOs. Scale bar indicates 200 µm.
Extended Data Fig. 2.
Extended Data Fig. 2.. Low dose bilirubin promotes GLUL+ hepatocyte specification in HLOs.
a) Schematic for low dose bilirubin treatment and Z3-HLO development to induce GLUL+ expression. b) Cell viability assay with different concentration of bilirubin to titrate dose for maximal viability. (n = 9 independent experiments). c) Brightfield image of Z3-HLOs treated with low dose bilirubin (1mg/L) compared to control, and luminal outline using ImageJ, arrows indicate luminal projections that are similar to bile canaliculi found in human liver. Scale bar indicates 200 µm. d) Comparison of size and circularity of lumen of the control and 1 mg/L bilirubin treated Z3-HLOs. (n = 9 independent experiments) e) Heatmap of Zone 3 genes from RNAseq dataset for bilirubin treated Z3-HLOs compared to control. f) CYP3A4 activity assay in response to Rifampicin in control, Z1-, Z3-HLOs, and PHH (left). CYP1A2 activity assay in response to Omeprazole in control, Z1-, Z3-HLOs, and PHH (right). (n = 9 independent experiments). g) Immunofluorescence images of Z3-HLOs for GLUL, NR3C1 and CDH1 compared to control HLOs. Scale bar indicates 200 µm. h) Heatmap of Z1- and Z3-HLOs depicting expression of zonal genes and lack of consensus expression of markers such as ARG1 and AKR1C1.
Extended Data Fig. 3.
Extended Data Fig. 3.. Bilirubin induced fusion requires close proximity and cytoskeletal signaling.
a) Brightfield images of bilirubin induced fusion in high density HLOs compared to low density and no bilirubin treatment. Scale bar indicates 200 µm. b) Comparison of mean segment length in high density HLOs compared to low density and no bilirubin treatment. (n = 9 independent experiments) c) Brightfield and live staining images (NucBlue: Blue, Cytoskeleton: White) show progression of organoid fusion after continued treatment with bilirubin (1 mg/L). Scale bar indicates 200 µm. d) Comparison of mean segment length of the HLOs from Day 1 to Day 7. (n = 9 independent experiments). e) NOTCH activity assay in bilirubin treated HLOs compared to control. (n = 9 independent experiments). f) Percentage of fused organoids after bilirubin treatment in DAPT (Notch inhibitor) and NSC (Ezrin Inhibitor, NSC668394) treated HLOs compared to control. (n = 9 independent experiments). g) Brightfield images of bilirubin induced fused HLOs compared to DAPT or NSC668394 treatment and control HLOs. Scale bar indicates 200 µm. h) CLF assay for self-assembled organoids compared to control. Scale indicates 200 µm. i) Percentage of fused organoids for each type of organoid. (n = 9 independent experiments).
Extended Data Fig. 4.
Extended Data Fig. 4.. Immunostaining of mZ-HLOs compared to neonatal liver show similar features.
a) Brightfield images of fused HLOs following continued treatment with bilirubin compared to single dose treatment after 10 days. b) Immunofluorescence images (bottom) of mZ-HLOs depicting GFP, mCherry, PROX1 and A1AT. Scale bar indicates 200 µm. c) Immunofluorescence images of mZ-HLOs for pan liver markers: TUBA1A, CTNBB1, luminal marker: ZO-1 (depicting continuous lumen); Zone 1 markers: ARG1 and SLBP; Zone 2 marker TERT; Zone 3 markers: AHR, and MRP2; and Cholangiocyte marker CK7. Scale bar indicates 200 µm. Numbers indicate the ratio of correctly fused organoids and total number of organoids. d) Immunohistochemistry images of neonatal liver sections for pan liver marker TUBA1A; Cholangiocyte marker CK7; Zone 1 markers: ARG1, SLBP, and GLS2; Zone 2 marker TERT; and Zone 3 markers: AHR, ALDH6A1 and MRP2. Scale bar indicates 200 µm. (P: Portal vein, C: Central vein).
Extended Data Fig. 5.
Extended Data Fig. 5.. Single cell profiling of mZ-HLOs indicate the emergence of zonal like populations.
a) UMAP plot with the major populations (hepatocytes, cholangiocytes, endothelial cells, macrophages, stellate cells, and mesenchyme) of all nuclei in mZ-HLOs. b) Distinct expression profile all populations in mZ-HLOs. The size of the circle indicates the percentage of nuclei in each population expressing each gene. The color represents the average expression level for the indicated gene. c) Heatmap showing scaled mean expression of all genes in each cluster. Top 10 marker genes in each cluster have been added as labels. d) Expression of known hepatoblast and zonal hepatocyte marker genes in each population. e) Violin plot for expression of AFP (hepatoblast gene), GSS (interzonal hepatocytes), GHR (pericentral hepatocyte), and GLS2 (periportal hepatocyte).
Extended Data Fig. 6.
Extended Data Fig. 6.. Pseudo-spatial profiling of mZ-HLOs show similarity of zonal expression to primary liver tissue.
a) Spatial plot for TAT (zone 1), HAMP (zone 2), and CYP3A4 (zone 3) markers in 10X Xenium healthy human liver dataset (publicly available dataset). b) UMAP plot of mZ-HLO with hepatocyte populations (top) and distribution of replicate data (bottom). c) Feature plot for TAT (zone 1), HAMP (zone 2), and CYP3A4 (zone 3) markers. d) UMAP plot for zonal hepatocyte populations from primary liver (Andrews et al., 2022) and mZ-HLOs integrated together (top). UMAP plot depicting distribution for total hepatocyte populations from primary liver and mZ-HLOs integrated together (bottom). e) Expression of known hepatoblast and zonal hepatocyte marker genes in mZ-HLOs benchmarked against Andrews et al., 2022 snRNAseq dataset. f) UMAP plot for all cell types (inset: sample distribution) from primary liver datasets and mZ-HLOs integrated together. g) Feature plot for GLS2 (zone 1), HAMP (zone 2), and GLUL (zone 3) markers.
Extended Data Fig. 7.
Extended Data Fig. 7.. RNA velocity and pseudotime analysis in mZ-HLOs.
a) Phase portrait of AFP, GLUL, and GLS2 depicting the dynamics of the gene splicing in the nuclei with the velocity and expression of AFP, GLUL, and GLS2 in nuclei as feature plots. b) SOM (Self Organizing Map) of single-nuclei transcriptome-derived zonation profiles for mZ-HLOs based on the different populations. c) Boxplot showing the pseudotime of each nuclei population in mZ-HLOs.
Extended Data Fig. 8.
Extended Data Fig. 8.. EP300 differentially regulates zonal genes in mZ-HLOs in conjunction to distinct transcription factors.
a) Peak density plots showing EP300 bound loci, a marker of active enhancers. Profile plot of all peaks are in the top panel. b) Genome browser view of HNF4A (pan marker) showing the EP300 ChIPseq peak. c) Genome browser view of CTNNB1 (pan marker) showing the EP300 ChIPseq peak. d) Genome browser view of SLBP (zone 1 gene) showing the EP300 ChIPseq peak. e) Genome browser view of AKR1C1 (zone 2 gene) showing the EP300 ChIPseq peak. f) Genome browser view of GHR (zone 3 gene) showing the EP300 ChIPseq peak. g) Top 10 upregulated Gene Ontology terms (Biological Process) for the gene regulated bound by EP300 in the Z1-HLOs. h) Top 10 upregulated Gene Ontology terms (Biological Process) for the gene regulated bound by EP300 in the Z3-HLOs.
Extended Data Fig. 9.
Extended Data Fig. 9.. EP300 and partner transcription factors are important for zonal liver development.
a) Experimental timeline for testing role of EP300 in zonal liver development using Ad-shp300 (adenoviral vector for p300 shRNA, top). H&E stain for sections from rat liver injected with Ad-shSCR (adenoviral vector for scrambled shRNA, middle) and Ad-shp300 (adenoviral vector for p300 shRNA, bottom). Scale bar indicates 200 µm. (P: Portal vein, C: Central vein) b) ICH stain for PROX1, ARG1, and GLUL of sections from rat liver injected with Ad-shSCR (adenoviral vector for scrambled shRNA, top) and Ad-shp300 (adenoviral vector for p300 shRNA, bottom). Scale bar indicates 200 µm. (P: Portal vein, C: Central vein) c) RT-qPCR of ALB, ACSS2, ASL, CPS1, and OTC (zone 1) gene for Z1- and Z3-HLOs compared to freshly isolated PHH, H20 (20 um periportal hepatocytes) and H40 (40 um pericentral hepatocytes) (Data is mean ± SD, n = 9 independent experiments). d) RT-qPCR of ALDH1A2, ALDH6A1, HIF1A, SREBF1, and GLUL (zone 3) gene for Z1- and Z3-HLOs compared to freshly isolated PHH, H20 (20 um periportal hepatocytes) and H40 (40 um pericentral hepatocytes) (Data is mean ± SD, n = 9 independent experiments). e) EP300-TF ChIP-reChIP-PCR for H20 (20 um periportal hepatocytes) and H40 (40 um pericentral hepatocytes). f) NR3C1-MECP2 ChIP-reChIP-qPCR for samples in (e). Data are mean ± SD, n = 9 independent experiments.
Extended Data Fig. 10.
Extended Data Fig. 10.. Interzonal dependent lipid and glucose metabolism in mZ-HLOs.
a) Triglyceride assay for mZ-HLOs with and without Firsocostat treatment compared to Z1-, Z3-, control HLOs, and PHH (n = 9 independent experiments). b) Lipase activity assay for mZ-HLOs with and without Firsocostat treatment compared to Z1-, Z3-, control HLOs, and PHH (n = 9 independent experiments). c) Glucose assay for mZ-HLOs with and without FBPi treatment compared to Z1-, Z3-, control HLOs, and PHH (n = 9 independent experiments). d) Glucokinase activity assay for mZ-HLOs with and without FBPi treatment compared to Z1-, Z3-, control HLOs, and PHH (n = 9 independent experiments).
Extended Data Fig. 11.
Extended Data Fig. 11.. mZ-HLOs exhibit zone specific regenerative potential in response to toxins.
a) Experimental timeline for testing zonal regenerative potential of mZ-HLOs in response to zone specific toxins. b) Immunofluorescence images of mZ-HLOs for proliferative marker Ki-67, GLUL, ARG1 and HAMP in response to Allyl Alcohol (Zone 1 toxin, left). Immunofluorescence images of mZ-HLOs for proliferative marker Ki-67, GLUL and ARG1 in response to Acetaminophen (Zone 3 toxin). Scale bar indicates 200 µm. c) Comparison of Ki-67 + nuclei in different fluorescent regions in response to zone specific toxins. (n = 9 independent experiments) d) Comparison of length of different fluorescent regions in response to zone specific toxins. (n = 9 independent experiments) e) Immunofluorescence images of CPS1, TET1, GLUL, NR3C1, and mCherry in Z1-HLOs with Dox treatment and after Dox withdrawal and persistent bilirubin treatment at Day 20 and 25. Scale bar indicates 200 µm. f) RT-qPCR of ACSS2, CPS1, ALDH1A2 and GLUL gene for Z3-HLOs with Dox (Dox +) and with bilirubin after Dox withdrawal (Dox – Bilirubin +) compared to control HLOs (Data is mean ± SD, n = 9 independent experiments).
Extended Data Fig. 12.
Extended Data Fig. 12.. mZ-HLOs invade into the liver parenchyma of RRG rats after transplantation.
a) Immunofluorescence images for human TUBA1A of mZ-HLOs transplanted in RRG rat liver. Scale bar indicates 200 µm. b) Immunofluorescence images for human ASGR1 of mZ-HLOs transplanted in RRG rat liver. Scale bar indicates 200 µm. c) Immunofluorescence images for GFP, mCherry, human ARG1 and GLUL of mZ-HLOs transplanted in RRG rat liver. Scale bar indicates 200 µm. d) Immunofluorescence images for human ASGR1 of Z1 and Z3-HLOs transplanted in RRG rat liver through the portal vein and inferior vena cava. Scale bar indicates 200 µm. Numbers indicate the ratio of the area of integrated organoids and total area of the liver parenchyma in view in 103 pixel2.
Fig. 1 |
Fig. 1 |. Engineering PSC-derived human liver organoids with multizonal hepatocyte features.
a,Schematic for development of mZ-HLOs from doxycycline induced Z1-HLOs and low dose bilirubin treated Z3-HLOs. b,Brightfield images of Dox (100 ng/ml) treated Z1-HLOs (left). RT-qPCR of ACSS2, ASL, CPS1 and OTC gene for Z1-HLOs compared to Primary Human Hepatocytes (PHH), Z3- and control HLOs (right). (Data is mean ± SD, n = 9 independent experiments). c,Brightfield image of Z3-HLOs treated with low dose bilirubin (1mg/L) (left). RT-qPCR of ALDH1A2, GLUL, HIF1A and SREBF1 gene for Z3-HLOs compared to PHH, Z1- and control HLOs (right). (Data is mean ± SD, n = 9 independent experiments). d, Caspase 3 activity assay in Z3-HLOs compared to Z1-HLOs after treatment with Zone 1 toxin, Allyl alcohol, compared to control (left). Cell viability assay in Z3-HLOs compared to Z1-HLOs after treatment with Zone 1 toxin, Allyl alcohol, compared to control (right). (n = 9 independent experiments). e,Caspase 3 activity assay in Z3-HLOs compared to Z1-HLOs after treatment with Zone 3 toxin, Acetaminophen, compared to control (left). Cell viability assay in Z3-HLOs compared to Z1-HLOs after treatment with Zone 3 toxin, Acetaminophen, compared to control (right). (n = 9 independent experiments). f, Brightfield images (top) of progression of bilirubin induced fusion from Day 1 to Day 7. Fluorescent images of progression of organoid fusion from day 1 to day 7 when GFP+ Z3-HLOs were co-cultured with dox treated mCherry+ Z1-HLOs (inset). Scale bar indicates 200 µm. Numbers on the bar indicate the ratio of correctly fused organoids and total number of organoids. g, Heatmap of fused organoid compared to Z1-, Z3-, and control HLOs depicting expression of all zonal genes in the fused organoids. h, Immunofluorescence images of mZ-HLOs for pan liver markers: ALB, HNF4A, PROX1, HNF1A, A1AT, and CEBPB; Zone 1 markers: mCherry, TET1, and GLS2; Zone 3 markers: GHR, AR, and ALDH6A1. Scale bar indicates 200 µm. Numbers on the bar indicate the percentage of fused organoids that express dual and single positivity for the indicated antigen staining.
Fig. 2 |
Fig. 2 |. Single cell analysis of multi-zonal human liver organoids (mZ-HLO).
a,UMAP plot with the major populations (Hepatoblasts, Interzonal like hepatocytes, Pericentral like hepatocytes, and Periportal like hepatocytes) of parenchymal nuclei in mZ-HLOs. Velocyto force field showing the average differentiation trajectories (velocity) for nuclei located in different parts of the UMAP plot (left). Pseudotime trajectory graph showing the differentiation trajectory for nuclei in the UMAP plot (right). The color represents the pseudotime development stage. b, Feature plots for pan liver makers: TTR and SERPINA1; Cholangiocyte marker: KRT7; Zone 1 marker: mCherry, GLS2, CPS1 and OTC; Zone 2 marker: GSS, TERT, and AKR1C1; and Zone 3 maker: GFP, GLUL, CYP2E1 and HIF1A. c, UMAPs for human hepatocytes from PSC-derived liver organoid cell atlas colored by organoid source and cell type. UMAPs displaying the maximum spearman correlation of fetal liver (left) and adult liver (right) dataset. d, Expression of genes related to zone specific functions in each population. The size of the circle indicates the percentage of nuclei in each population expressing each gene. The color represents the average expression level for the indicated gene. e, Pathway enrichment analysis examining which cellular pathways represented in the hepatoblast, pericentral, periportal, and interzonal hepatocyte populations. Circles (nodes) represent pathways, sized by the number of genes included in that pathway. Related pathways, indicated by light blue lines, are grouped into a theme (black circle) and labeled. Intra-pathway and inter-pathway relationships are shown in light blue and represent the number of genes shared between each pathway.
Fig. 3 |
Fig. 3 |. Bilirubin and Ascorbate regulate EP300 differentially in a spatial manner to evoke zonation.
a, Genome browser view of ACSS2 (zone 1 gene) showing the EP300 ChIPseq peak. b,Genome browser view of HPR (zone 2 gene) showing the EP300 ChIPseq peak. c, Genome browser view of ALDH6A1 (zone 3 gene) showing the EP300 ChIPseq peak. d, Top 10 upregulated Gene Ontology terms (Biological Process) for the gene regulated bound by EP300 in the mZ-HLOs. e, Motif enrichment analysis of EP300 bound peaks analyzed by MEME-ChIP. f, Venn diagram depicting the intersection between EP300 bound peaks and upregulated genes obtained from RNAseq in Z1- and Z3-HLOs linked to motif enrichment analysis of EP300 bound peaks for upregulated genes in dox treated Z1-HLOs and in bilirubin treated Z3-HLOs analyzed by MEME-ChIP. g, RT-qPCR of ACSS2, and CPS1 gene for Z1-HLOs compared to mZ-HLOs with and without treatment with Bobcat 339 (TET inhibitor) (left). RT-qPCR of ALDH6A1, and GLUL gene for Z3-HLOs compared to mZ-HLOs with and without treatment with KC7F2 (HIF1A inhibitor) (right). (Data is mean ± SD, n = 9 independent experiments). h, Schematic for bilirubin and ascorbate mediated distinct epigenetic regulation leading to differential gene expression.
Fig. 4 |
Fig. 4 |. Interzonal dependent nitrogen handling in mZ-HLOs.
a, RT-qPCR of OTC and CPS1 (zone 1) gene for mZ-HLOs compared to Z1-, Z3-, control HLOs, and PHH in response to 10mM NH4CL (Data is mean ± SD, n = 9 independent experiments). b, RT-qPCR of ARG1 (zone 1+2) and GSTA2 (zone 2) gene for mZ-HLOs compared to Z1-, Z3-, control HLOs, and PHH in response to 10mM NH4CL (Data is mean ± SD, n = 9 independent experiments). c, RT-qPCR of ALDH1A2 and GLUL (zone 3) gene for mZ-HLOs compared to Z1-, Z3-, control HLOs, and PHH in response to 10mM NH4CL (Data is mean ± SD, n = 9 independent experiments). d, Glutathione assay for mZ-HLOs with and without BSO treatment compared to Z1-, Z3-, control HLOs, and PHH (n = 9 independent experiments). e, Ammonia assay for mZ-HLOs with and without BSO treatment compared to Z1-, Z3-, control HLOs, and PHH (n = 9 independent experiments). f, Urea assay for mZ-HLOs with and without BSO treatment compared to Z1-, Z3-, control HLOs, and PHH (n = 9 independent experiments). g, Glutathione S-Transferase assay for mZ-HLOs with and without BSO treatment compared to Z1-, Z3-, control HLOs, and PHH (n = 9 independent experiments). h, Glutamine synthetase activity assay for mZ-HLOs with and without BSO treatment compared to Z1-, Z3-, control HLOs, and PHH (n = 9 independent experiments). i, Glutamine assay for mZ-HLOs with and without BSO treatment compared to Z1-, Z3-, control HLOs, and PHH (n = 9 independent experiments).
Fig. 5 |
Fig. 5 |. Orthotopic transplantation of mZ-HLOs improves multiple hepatocyte functions.
a, Schematic for orthotopic transplantation of HLOs in bile duct ligated immunocompromised RRG rats. b, Kaplan-Meier survival curve for Z1-, Z3-, and mZ-HLO transplanted bile duct ligated RRG rats compared to sham. c, Human Albumin ELISA on blood serum collected from rats at different time points after transplantation. (n = 9 independent experiments). d, Bilirubin assay on blood serum collected from rats at different time points after transplantation. (n = 9 independent experiments). e, Ammonia assay on blood serum collected from rats at different time points after transplantation. (n = 9 independent experiments).

References

    1. Ben-Moshe S. & Itzkovitz S. Spatial heterogeneity in the mammalian liver. Nature Reviews Gastroenterology & Hepatology 16, 395–410 (2019). 10.1038/s41575-019-0134-x - DOI - PubMed
    1. Martini T., Naef F. & Tchorz J. S. Spatiotemporal Metabolic Liver Zonation and Consequences on Pathophysiology. Annual Review of Pathology: Mechanisms of Disease 18, 439–466 (2023). 10.1146/annurev-pathmechdis-031521-024831 - DOI - PubMed
    1. Bartl M. et al. Optimality in the zonation of ammonia detoxification in rodent liver. Archives of Toxicology 89, 2069–2078 (2015). 10.1007/s00204-015-1596-4 - DOI - PubMed
    1. Husson A., Brasse-Lagnel C., Fairand A., Renouf S. & Lavoinne A. Argininosuccinate synthetase from the urea cycle to the citrulline–NO cycle. European Journal of Biochemistry 270, 1887–1899 (2003). 10.1046/j.1432-1033.2003.03559.x - DOI - PubMed
    1. Häussinger D. Nitrogen metabolism in liver: structural and functional organization and physiological relevance. Biochem J 267, 281–290 (1990). 10.1042/bj2670281 - DOI - PMC - PubMed

Publication types