

Assessing the precision of machine learning for diagnosing pulmonary arterial hypertension: a systematic review and meta-analysis of diagnostic accuracy studies
- PMID: 39257851
- PMCID: PMC11385608
- DOI: 10.3389/fcvm.2024.1422327
Assessing the precision of machine learning for diagnosing pulmonary arterial hypertension: a systematic review and meta-analysis of diagnostic accuracy studies
Abstract
Introduction: Pulmonary arterial hypertension (PAH) is a severe cardiovascular condition characterized by pulmonary vascular remodeling, increased resistance to blood flow, and eventual right heart failure. Right heart catheterization (RHC) is the gold standard diagnostic technique, but due to its invasiveness, it poses risks such as vessel and valve injury. In recent years, machine learning (ML) technologies have offered non-invasive alternatives combined with ML for improving the diagnosis of PAH.
Objectives: The study aimed to evaluate the diagnostic performance of various methods, such as electrocardiography (ECG), echocardiography, blood biomarkers, microRNA, chest x-ray, clinical codes, computed tomography (CT) scan, and magnetic resonance imaging (MRI), combined with ML in diagnosing PAH.
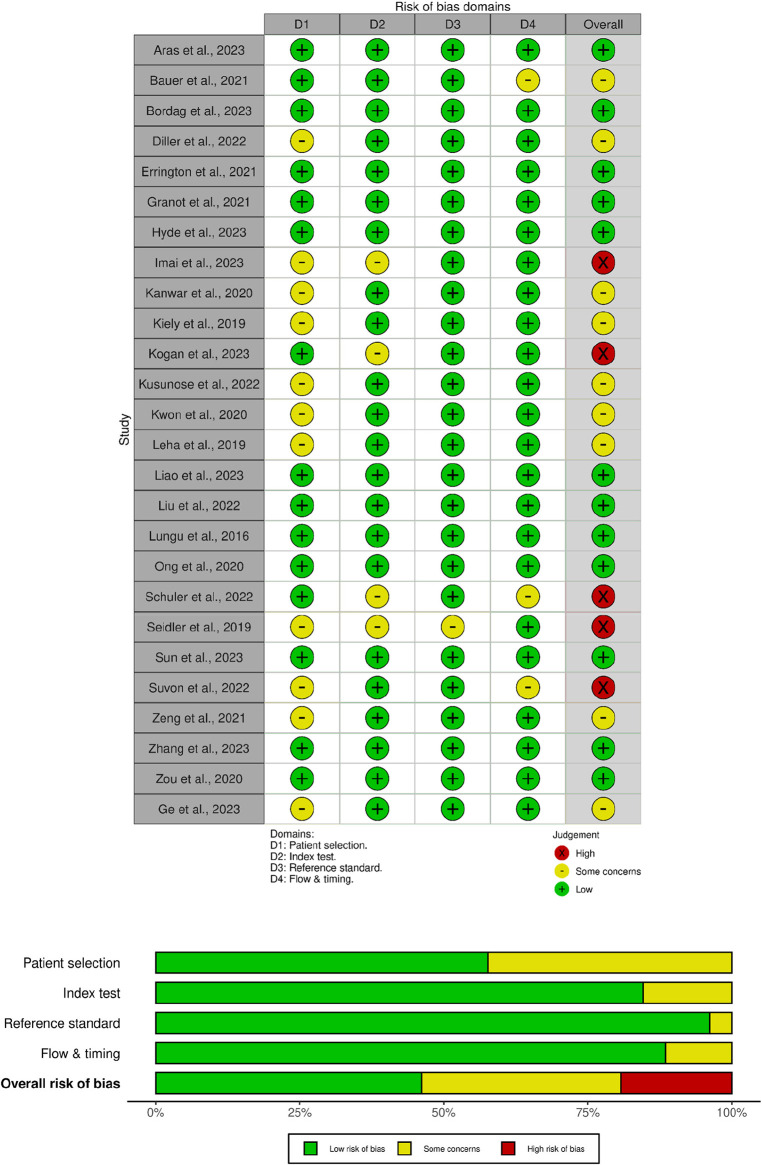
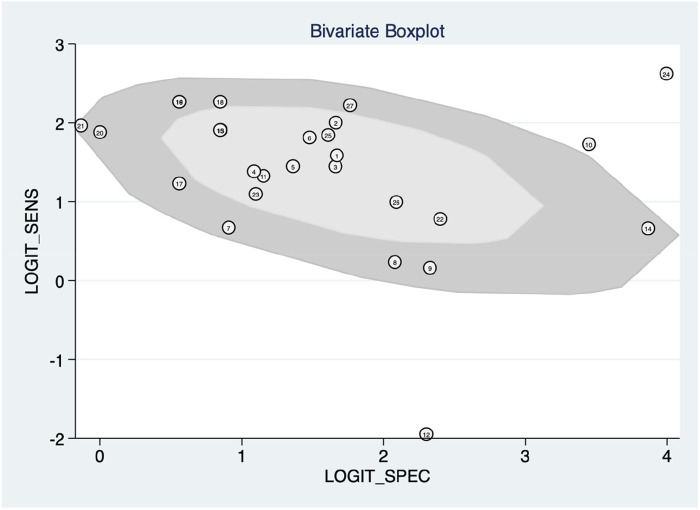
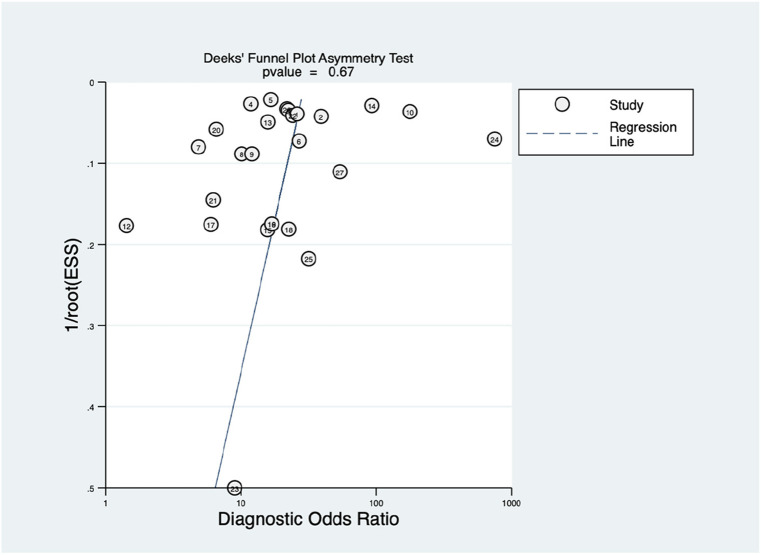
Methods: The outcomes of interest included sensitivity, specificity, area under the curve (AUC), positive likelihood ratio (PLR), negative likelihood ratio (NLR), and diagnostic odds ratio (DOR). This study employed the Quality Assessment of Diagnostic Accuracy Studies-2 (QUADAS-2) tool for quality appraisal and STATA V.12.0 for the meta-analysis.
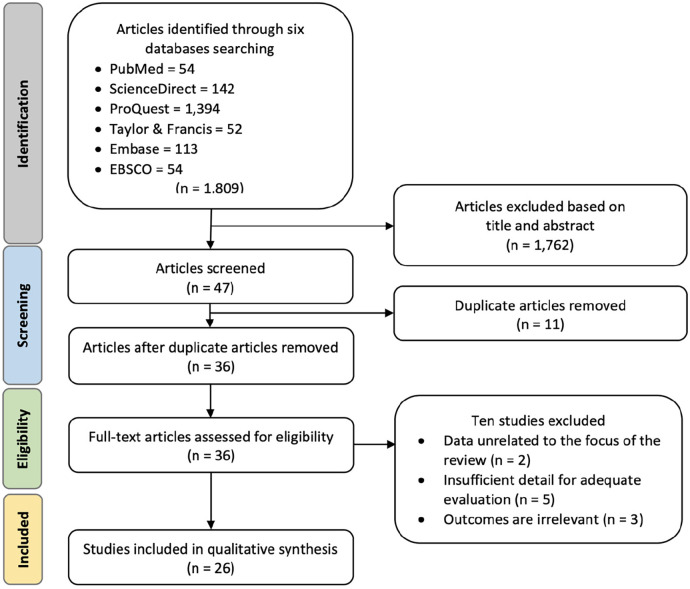
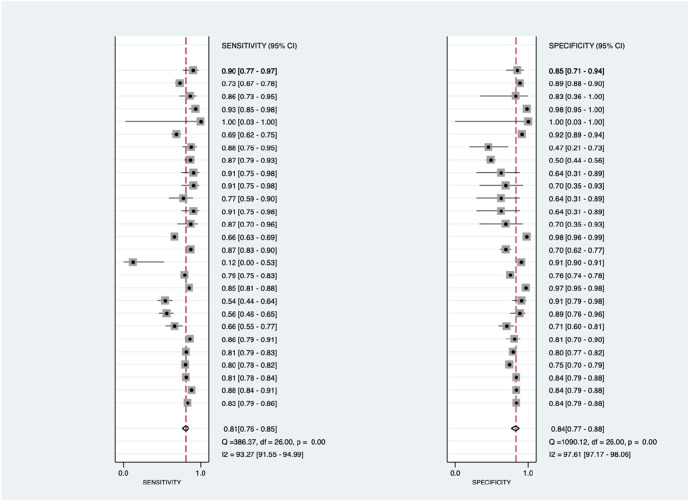
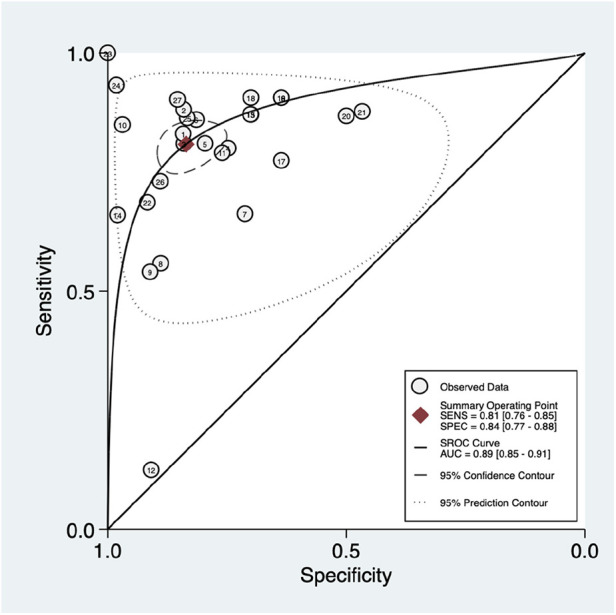
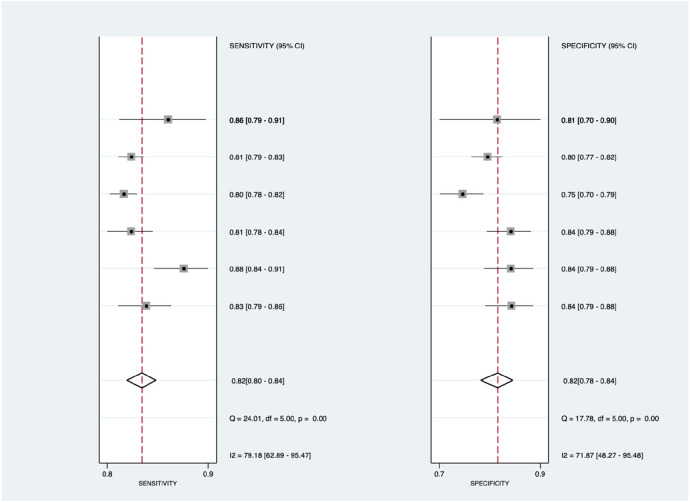
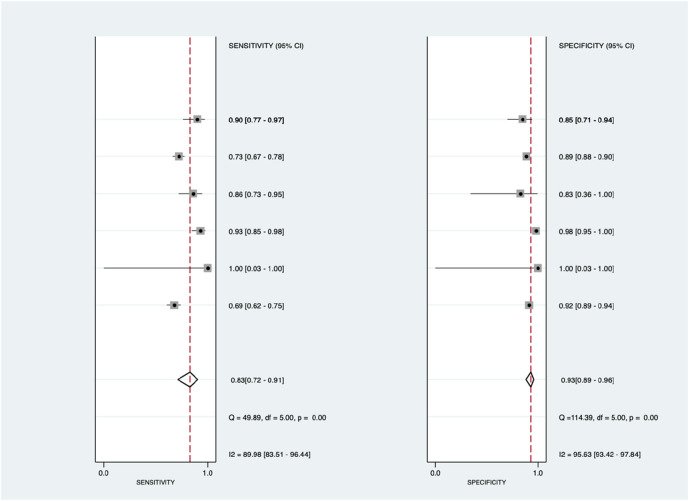
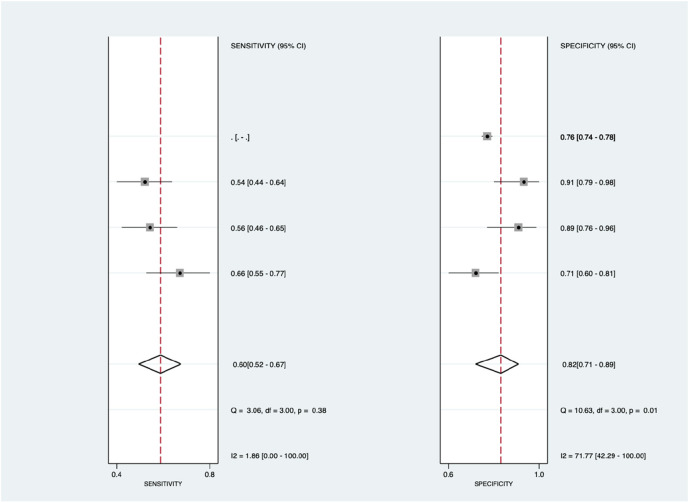
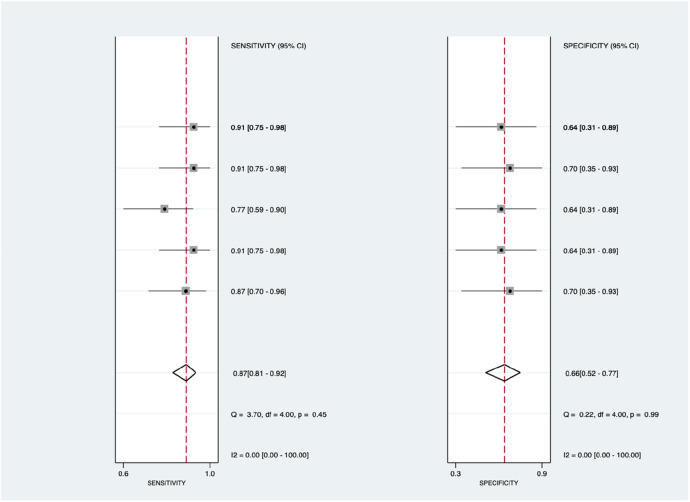
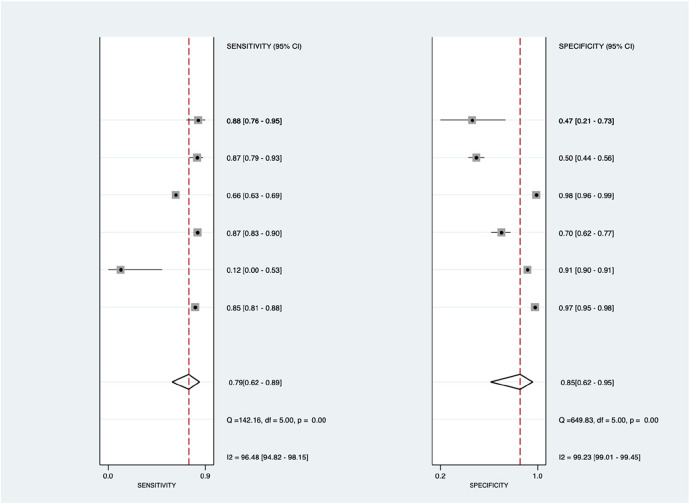
Results: A comprehensive search across six databases resulted in 26 articles for examination. Twelve articles were categorized as low-risk, nine as moderate-risk, and five as high-risk. The overall diagnostic performance analysis demonstrated significant findings, with sensitivity at 81% (95% CI = 0.76-0.85, p < 0.001), specificity at 84% (95% CI = 0.77-0.88, p < 0.001), and an AUC of 89% (95% CI = 0.85-0.91). In the subgroup analysis, echocardiography displayed outstanding results, with a sensitivity value of 83% (95% CI = 0.72-0.91), specificity value of 93% (95% CI = 0.89-0.96), PLR value of 12.4 (95% CI = 6.8-22.9), and DOR value of 70 (95% CI = 23-231). ECG demonstrated excellent accuracy performance, with a sensitivity of 82% (95% CI = 0.80-0.84) and a specificity of 82% (95% CI = 0.78-0.84). Moreover, blood biomarkers exhibited the highest NLR value of 0.50 (95% CI = 0.42-0.59).
Conclusion: The implementation of echocardiography and ECG with ML for diagnosing PAH presents a promising alternative to RHC. This approach shows potential, as it achieves excellent diagnostic parameters, offering hope for more accessible and less invasive diagnostic methods.
Systematic review registration: PROSPERO (CRD42024496569).
Keywords: area under receiving operator curve; area under the curve; diagnostic method; machine learning; pulmonary arterial hypertension.
© 2024 Fadilah, Putri, Puling and Willyanto.
Conflict of interest statement
The authors declare that the research was conducted in the absence of any commercial or financial relationships that could be construed as a potential conflict of interest.
Figures
Similar articles
-
Meta-analysis of the value of dual-energy computed tomography in the diagnosis of anterior cruciate ligament injuries of the knee.BMC Musculoskelet Disord. 2024 Jul 18;25(1):557. doi: 10.1186/s12891-024-07632-6. BMC Musculoskelet Disord. 2024. PMID: 39020351 Free PMC article.
-
Predicting radiation pneumonitis in lung cancer using machine learning and multimodal features: a systematic review and meta-analysis of diagnostic accuracy.BMC Cancer. 2024 Nov 5;24(1):1355. doi: 10.1186/s12885-024-13098-5. BMC Cancer. 2024. PMID: 39501204 Free PMC article.
-
MRI versus CT for the detection of pulmonary nodules: A meta-analysis.Medicine (Baltimore). 2021 Oct 22;100(42):e27270. doi: 10.1097/MD.0000000000027270. Medicine (Baltimore). 2021. PMID: 34678861 Free PMC article. Review.
-
Long noncoding RNAs and circular RNAs as potential diagnostic biomarkers of inflammatory bowel diseases: a systematic review and meta-analysis.Front Immunol. 2024 Mar 8;15:1362437. doi: 10.3389/fimmu.2024.1362437. eCollection 2024. Front Immunol. 2024. PMID: 38524131 Free PMC article.
-
MicroRNA panels as diagnostic biomarkers for colorectal cancer: A systematic review and meta-analysis.Front Med (Lausanne). 2022 Nov 7;9:915226. doi: 10.3389/fmed.2022.915226. eCollection 2022. Front Med (Lausanne). 2022. PMID: 36419785 Free PMC article.
Cited by
-
The Diagnostic Accuracy of an Electrocardiogram in Pulmonary Hypertension and the Role of "R V1, V2 + S I, aVL - S V1".J Clin Med. 2024 Dec 13;13(24):7613. doi: 10.3390/jcm13247613. J Clin Med. 2024. PMID: 39768536 Free PMC article.
-
Experimental animal models and patient-derived platforms to bridge preclinical discovery and translational therapeutics in pulmonary arterial hypertension.J Transl Med. 2025 Jun 17;23(1):665. doi: 10.1186/s12967-025-06709-7. J Transl Med. 2025. PMID: 40528193 Free PMC article. Review.
References
-
- Bordag N, Nagy BM, Zügner E, Ludwig H, Foris V, Nagaraj C, et al. Lipidomics for diagnosis and prognosis of pulmonary hypertension. medRxiv. (2023):1–18. 10.1101/2023.05.17.23289772 - DOI
-
- Bhavsar KA, Singla J, Al-Otaibi YD, Song OY, Bin ZY, Bashir AK. Medical diagnosis using machine learning: a statistical review. Computers. Materials & Continua. (2021) 67(1):107–25. 10.32604/cmc.2021.014604 - DOI
Publication types
LinkOut - more resources
Full Text Sources