. 2024 Aug 27:15:1397034.
doi: 10.3389/fendo.2024.1397034. eCollection 2024.

Effect of oral metformin on gut microbiota characteristics and metabolite fractions in normal-weight type 2 diabetic mellitus patients

Affiliations

Effect of oral metformin on gut microbiota characteristics and metabolite fractions in normal-weight type 2 diabetic mellitus patients

Xiaohong Niu et al. Front Endocrinol (Lausanne). .

Abstract

Background and aims: To analyze the effect of oral metformin on changes in gut microbiota characteristics and metabolite composition in normal weight type 2 diabetic patients.

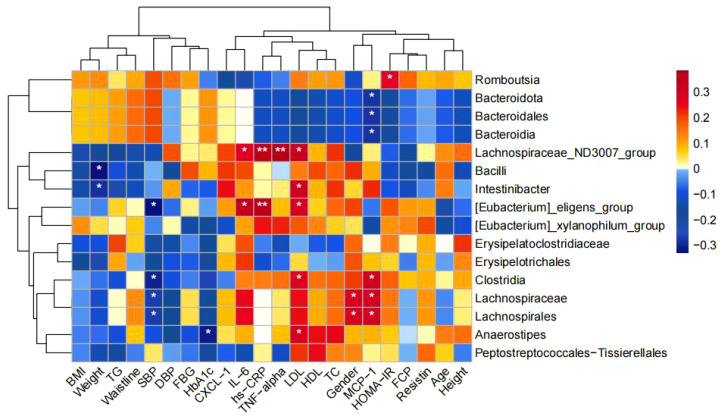
Methods: T2DM patients in the cross-sectional study were given metformin for 12 weeks. Patients with unmedicated T2DM were used as a control group to observe the metrics of T2DM patients treated with metformin regimen. 16S rDNA high-throughput gene sequencing of fecal gut microbiota of the study subjects was performed by llumina NovaSeq6000 platform. Targeted macro-metabolomics was performed on 14 cases of each of the gut microbiota metabolites of the study subjects using UPLC-MS/MS technology. Correlations between the characteristics of the gut microbiota and its metabolites, basic human parameters, glycolipid metabolism indicators, and inflammatory factors were analyzed using spearman analysis.

Results: Glycolipid metabolism indexes and inflammatory factors were higher in normal-weight T2DM patients than in the healthy population (P<0.05), but body weight, BMI, waist circumference, and inflammatory factor concentrations were lower in normal-weight T2DM patients than in obese T2DM patients (P<0.05). Treatment with metformin in T2DM patients improved glycolipid metabolism, but the recovery of glycolipid metabolism was more pronounced in obese T2DM patients. None of the differences in α-diversity indexes were statistically significant (P>0.05), and the differences in β-diversity were statistically significant (P <0.05). Community diversity and species richness recovered after metformin intervention compared to before, and were closer to the healthy population. We found that Anaerostipes/Xylose/Ribulose/Xylulose may play an important role in the treatment of normal-weight T2DM with metformin by improving glycemic lipids and reducing inflammation. And Metformin may play a role in obese T2DM through Romboutsia, medium-chain fatty acids (octanoic acid, decanoic acid, and dodecanoic acid).

Conclusion: Gut microbial dysbiosis and metabolic disorders were closely related to glucose-lipid metabolism and systemic inflammatory response in normal-weight T2DM patients. Metformin treatment improved glucose metabolism levels, systemic inflammation levels in T2DM patients, closer to the state of healthy population. This effect may be mediated by influencing the gut microbiota and microbial host co-metabolites, mainly associated with Anaerostipes and xylose/Ribulose/Xylulose. Metformin may exert its effects through different pathways in normal-weight versus obese T2DM patients.

Keywords: body mass index; gut microbiota; metabolomics; metformin; type 2 diabetes mellitus.


Conflict of interest statement

The authors declare that the research was conducted in the absence of any commercial or financial relationships that could be construed as a potential conflict of interest.

Figures

Figure 1
Figure 1
Analysis of the gut microflora diversity .(A) Venn diagram of ASVs for the five sample groups。(B) Comparison of α-diversity indices. Box plots depicting differences in fecal microbiome diversity among the five groups assessed using the Shannon, Simpson, and Chao1 indices, respectively, are shown. Each box plot represents the median, interquartile range, minimum, and maximum values. (C) PCoA analysis of five groups of gut microbiota bray analysis and unweighted unifrac. R-value, used to compare whether there is a difference between different groups; P-value, used to indicate whether there is a significant difference. R-value is between (-1, 1), R-value > 0 indicates that the difference between groups is greater than the difference within groups, R-value < 0 indicates that the difference between groups is less than the difference within groups, R is only a numerical indication of whether there is a difference between the groups and does not provide an indication of significance. The confidence level of the statistical analysis is expressed as P-value, with P< 0.05 indicating statistical significance.
Figure 2
Figure 2
Bacterial features most likely explain differences among groups identified by LEfSe based on ASV level. The letter in the former of the name of bacteria indicates different taxa levels (‘‘g’’ indicates genus; ‘‘f’’ indicates family; ‘‘o’’ indicates order;’’c’’ indicates class; ‘‘p’’ indicates phylum). (A)Evolutionary branching diagram of LEfse analysis for three sets of samples of NCP, NNT and NMT. (B) LDA SCORE (log 10) plots for the three sets of samples of NCP, NNT and NMT. (C) Evolutionary branching diagram of LEfse analysis for four sets of samples of NNT, NMT, UNT and MET. (D) LDA SCORE (log 10) plots for the four groups of samples of NNT, NMT, UNT and MET.
Figure 3
Figure 3
Correlation between the four groups comparing differential bacteria and clinical indicators. (*p<0.05, **p<0.01).
Figure 4
Figure 4
Comparison of KEGG pathway analysis results.
Figure 5
Figure 5
Analysis of metabolomics results. (A) Principal component analysis graph. The figure shows a plot of the 2D principal component scores of the analyzed samples and a box plot of the corresponding principal component scores. The box plots provide a more intuitive view of the differences in the first and second principal component scores for different groups of samples. Each point in the graph represents a sample, and different colors indicate different groups. The principal components shown in the figure are the combinations of principal components that have the largest distance from each other among all the subgroups. The percentage in parentheses after the principal component represents the overall rate at which that component explains the data. (B–D)The vertical dashed line indicates the dotted line corresponding to the FC threshold taken logarithmically and log2FC as the horizontal coordinate; the horizontal dashed line indicates the dotted line corresponding to P=0.05 and the corresponding -logeP value as the vertical coordinate. Meanwhile, the points that meet the requirements above the horizontal dashed line and on both sides of the vertical dashed line will be highlighted, (B) where the red highlights on the right side indicate the metabolites whose concentration increased, i.e., up-regulated, in the NCP group of the observation group compared to the NNT group of the control group and the blue highlights on the left side indicate the metabolites whose concentration decreased, i.e., down-regulated, in the NCP group of the observation group compared to the NNT group of the control group; (C) where the red highlights on the right side indicate the metabolites that were up-regulated by increasing concentrations in the UNT group compared to the control NCP group and the metabolites that were down-regulated by decreasing concentrations in the UNT group compared to the control NCP group. (D)The blue highlights on the left side indicate metabolites that were down-regulated by decreasing concentrations in the UNT group compared to the control NNT group; the gray dots indicate metabolites that did not meet the requirements of the set threshold. (E) Comparison of differential metabolites among the five groups.
Figure 6
Figure 6
(A) Metabolic pathway and influence analysis. Each circle corresponds to a metabolic pathway, the horizontal coordinate indicates the degree of pathway impact, the size of the circle is related to the pathway impact of the pathway, the larger the Impact value the larger the circle, the vertical coordinate indicates the negative logarithm of the P-value obtained from the enrichment analysis of the pathway, and the change of the yellow-red color of the point is positively related to the negative logarithm of the P-value of the pathway change. Correlation. Pathways with P<0.05 are labeled with their names in the figure, and pathways that do not meet the above conditions are not labeled with their names in the figure. (B) Network diagram for pathway analysis of aminoacyl-tRNAs biosynthesis. (C) Network diagram for pathway analysis of Pentose and glucuronate interconversions.
Figure 7
Figure 7
Correlation between differential metabolites and clinical indicators. Heatmaps show the correlation between differential metabolites and clinical indicators. Red color represents positive correlation and blue color represents negative correlation. The darker the color, the stronger the correlation. (*p<0.05, **p<0.01, ***p<0.001).
Figure 8
Figure 8
Correlation between changes in fecal metabolites and changes in gut bacteria abundance. Heatmap showing the correlation between changes in fecal metabolite concentrations and changes in the relative abundance of enteric bacteria. Red color represents positive correlation and blue color represents negative correlation. Darker colors indicate stronger correlations. (*p<0.05, **p<0.01, ***p<0.001).

References

    1. Chilunga FP, Henneman P, Meeks KA, Beune E, Requena-Méndez A, Smeeth L, et al. Prevalence and determinants of type 2 diabetes among lean African migrants and non-migrants: the RODAM study. J Glob Health. (2019) 9:020426. doi: 10.7189/jogh.09.020426 - DOI - PMC - PubMed
    1. Galán BSM, Serdan TDA, Rodrigues LE, Manoel R, Gorjão R, Masi LN, et al. Reviewing physical exercise in non-obese diabetic Goto-Kakizaki rats. Braz J Med Biol Res. (2022) 55:e11795. doi: 10.1590/1414-431x2022e11795 - DOI - PMC - PubMed
    1. Kibirige D, Sekitoleko I, Lumu W, Jones AG, Hattersley AT, Smeeth L, et al. Understanding the pathogenesis of lean non-autoimmune diabetes in an African population with newly diagnosed diabetes. Diabetologia. (2022) 65:675–83. doi: 10.1007/s00125-021-05644-8 - DOI - PMC - PubMed
    1. Yoshida N, Watanabe S, Yamasaki H, Sakuma H, Takeda AK, Yamashita T, et al. Average gut flora in healthy Japanese subjects stratified by age and body mass index. Biosci Microbiota Food Health. (2022) 41:45–53. doi: 10.12938/bmfh.2021-056 - DOI - PMC - PubMed
    1. Lee H, Ko G. Effect of metformin on metabolic improvement and gut microbiota. Appl Environ Microbiol. (2014) 80:5935–43. doi: 10.1128/AEM.01357-14 - DOI - PMC - PubMed

LinkOut - more resources