. 2024 Aug 28:4:108.
doi: 10.12688/openreseurope.17624.2. eCollection 2024.

Lockbox enrichment facilitates manipulative and cognitive activities for mice

Affiliations

Lockbox enrichment facilitates manipulative and cognitive activities for mice

Katharina Hohlbaum et al. Open Res Eur. .

Abstract

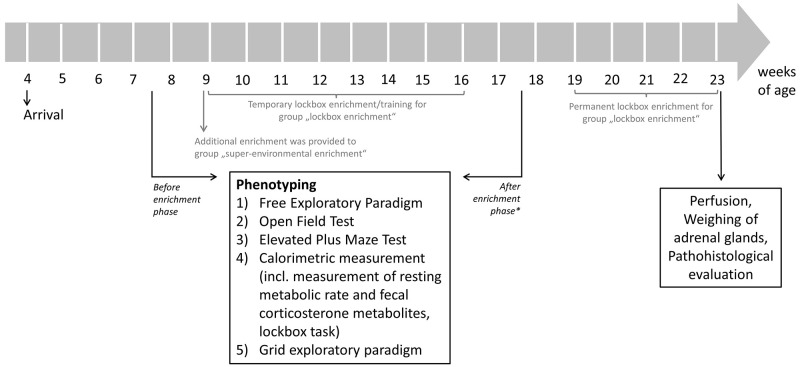
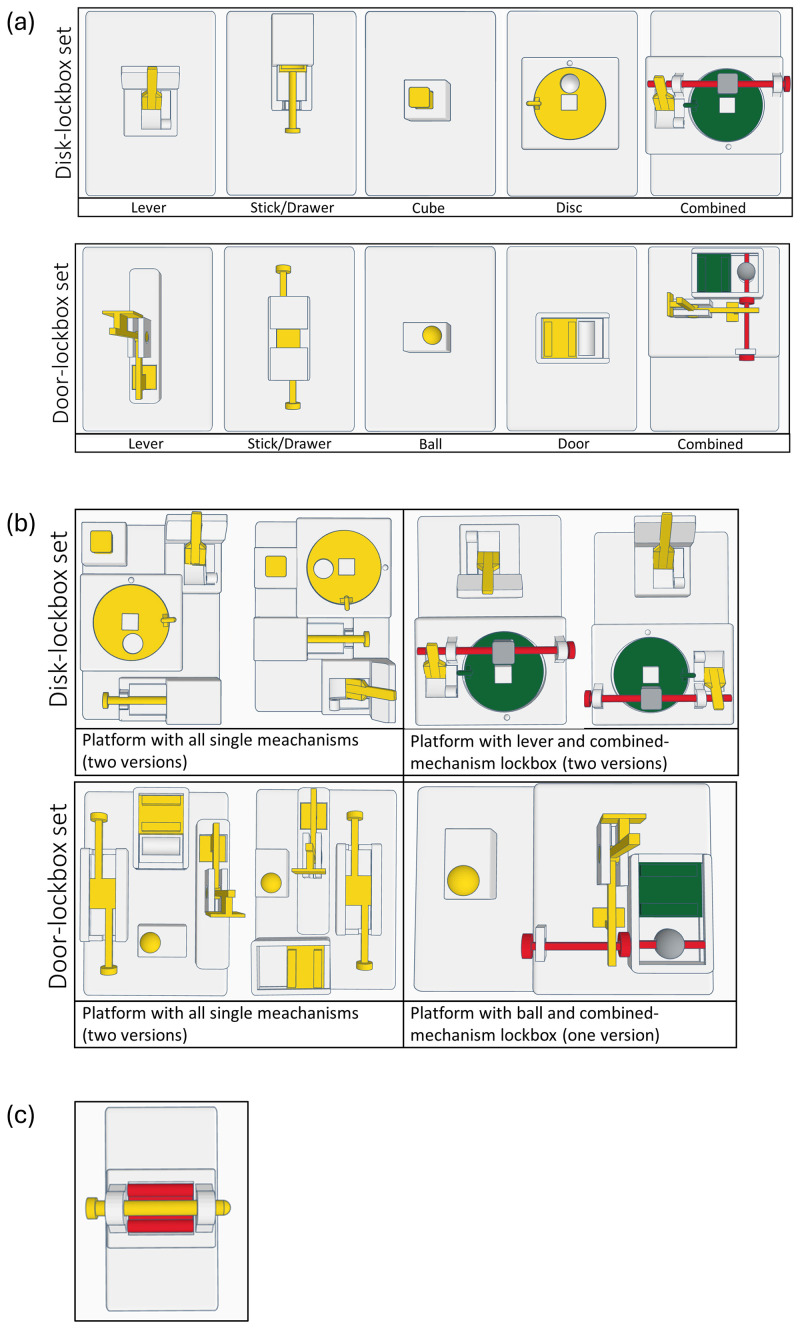
Background: Due to the lack of complexity and variety of stimuli, conventional housing conditions of laboratory mice do not allow these animals to fully express their behavioral repertoire, including manipulative and cognitive activities. Therefore, we designed mechanical puzzles, so-called lockboxes, for mice that can be provided in their home cages. We investigated the impact of the lockbox enrichment on their phenotype and affective state when compared to conventional housing (CH) and super-environmental enrichment (SEE).

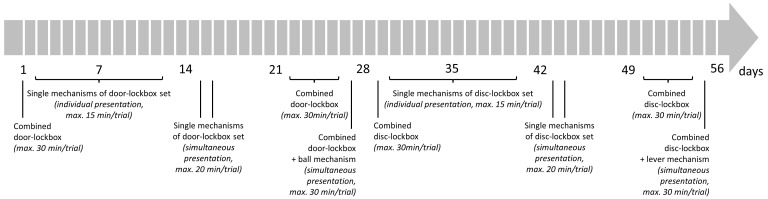
Methods: Young adult female C57BL/6JCrl mice were examined before and after 2-month exposure to the different types of enrichment in a phenotyping test battery, including tests for trait and state anxiety-related behavior, calorimetric measurements, body weight measurements, the analysis of stress hormone metabolite concentrations, and sequential problem-solving abilities with a novel lockbox. At the end of the study, adrenal gland weights were determined and pathohistological evaluation was performed. For all continuous variables, the relative variability was calculated.

Results: While the different types of enrichment affected trait anxiety-related behavior, neither state anxiety-related behavior nor physiological variables (i.e., bodyweight, resting metabolic rate, stress hormone metabolite concentrations, adrenal gland weights) were influenced. LE improved sequential problem-solving (i.e., solving novel lockboxes) when compared to SEE. Regardless of the housing condition, the relative variability increased in most variables over time, although the coefficient of variation decreased for some variables, especially in animals with access to LE. There was no evidence of toxicopathological effects associated with the material from which the lockboxes were made.

Conclusions: All lockboxes are available as open-source tool. LE revealed beneficial effects on the affective state of laboratory mice and their performance in solving novel lockboxes. Neither relevant phenotype of the mice nor reproducibility of the data were compromised by LE, similar to SEE. The lockboxes may also be used as novel approach for assessing cognition in mice.

Keywords: Mice; animal welfare; cognition; enrichment; home cage; phenotyping; refinement; sequential problem-solving.


Conflict of interest statement

No competing interests were disclosed.

Figures

Figure 1.
Figure 1.. Home cage apparatuses of the study groups.
The cage grid with food pellets and water bottle, as well as the filter tops were removed for the photographs. In the super-environmentally enriched cages, the tunnel attached to the cage grid with a clip was positioned on top of the wood board for photography purposes. The inserted images of the enrichment items illustrate the contents of cage A. The cages were connected with a gate comprising three transparent tubes with barriers and two door systems. The doors were placed next to the gate for the photographs and can be used to open or lock the gate. The only difference between the conventional housing and the lockbox enrichment group was the (temporary and permanent) access to the lockboxes in cage B.
Figure 2.
Figure 2.. Flow chart of testing schedule.
The phenotyping test battery was conducted before and after the 2-month enrichment phase. * While the name of the phase may suggest otherwise, it's important to note that the enrichment was not removed from either the lockbox enrichment group or the super-environmental enrichment group after the mice were tested for the second time.
Figure 3.
Figure 3.
( a) Lockbox sets comprising of four single-mechanism lockboxes and a combined-mechanism lockbox. ( b) Multiple-lockbox platforms. For each lockbox set, two versions of a platform with all single mechanisms were designed, allowing to present all lockboxes simultaneously to the mice. For the door-lockbox set one version and for the disc lockbox set two versions of a platform with a single-mechanism and the combined-mechanism lockbox were created. The different versions allowed the mechanisms to be positioned at a different spot within the cage in each trial. ( c) 2-step lockbox presented to all mice at the end of the calorimetric measurement.
Figure 4.
Figure 4.. Lockbox training schedule.
A trial was defined as the period in which the mouse was allowed the interact with a lockbox. It ended when the mouse opened the lockbox or when the maximum trial time expired.
Figure 5.
Figure 5.. Grid Exploratory Paradigm and Free Exploratory Paradigm before and after exposure to the different types of enrichment.
Boxplots: The box represents the interquartile range (IQR), box edges are the 25 th and 75 th quartile, and the whiskers represent values which are no greater than 1.5 × IQR. Additionally, individual data points representing each animal are overlaid on the boxplot as dots. It's important to note that these dots may overlap due to multiple animals having the same or very similar values. Grid Exploratory Paradigm: ( a) Total time of exploration, ( b) latency to explore, ( c) number of explorations; Free Exploratory Paradigm: ( d) distance travelled in the arena, ( e) percentage of time moving in the center, ( f) percentage of time moving in the periphery, ( g) number of mice entering the arena (i.e., a mouse entered the arena when all four paws left the tunnel and were placed on the floor of the arena on at least on day out of the three days on which the test was performed), ( h) latency to enter the arena (i.e., entering the arena was defined as placing all paws on the floor of the arena; if a mouse did not enter the arena, the latency was set to 1500 s). * p < 0.05 (linear mixed-effects model or generalized linear mixed-effects model, post-hoc pairwise comparisons of interaction between group and time), n = 12 animals per group. An asterisk (*) indicates a significant difference between two groups before or after the enrichment phase, or a significant difference within a group before and after the enrichment phase (details are given in the results section). For ( e) and ( f) applied: if the DLCAnalyzer did not detect a mouse moving in the center or in the periphery on all three days, the mouse was excluded; n = 12 animals both before and after the enrichment phase in the CH group, n = 10 before and n = 9 animals after the enrichment phase in the SEE group, n = 10 animals both before and after the enrichment phase in the LE group were included in this analysis. This number may vary from the number of mice entering the arena with all four paws since we did not track the paws but only the body center using DLC.
Figure 6.
Figure 6.. Open Field Test before and after the enrichment phase.
Boxplots: The box represents the interquartile range (IQR), box edges are the 25 th and 75 th quartile, and the whiskers represent values which are no greater than 1.5 × IQR. Additionally, individual data points representing each animal are overlaid on the boxplot as dots. It's important to note that these dots may overlap due to multiple animals having the same or very similar values. ( a) Distance travelled, ( b) time spent in the center, ( c) time spent in the periphery; n = 12 animals per group.
Figure 7.
Figure 7.. Elevated Plus Maze Test before and after the enrichment phase.
Boxplots: The box represents the interquartile range (IQR), box edges are the 25 th and 75 th quartile, and the whiskers represent values which are no greater than 1.5 × IQR. Additionally, individual data points representing each animal are overlaid on the boxplot as dots. It's important to note that these dots may overlap due to multiple animals having the same or very similar values. ( a) Distance travelled in the arena, ( b) number of protected stretch attend, ( c) time spent on open arms, ( d) time spent on closed arms, ( e) number of transitions to open arms, ( f) number of transitions to closed arms; n = 12 animals per group.
Figure 8.
Figure 8.. Calorimetric measurement before and after the enrichment phase.
Boxplots: The box represents the interquartile range (IQR), box edges are the 25 th and 75 th quartile, and the whiskers represent values which are no greater than 1.5 × IQR. Additionally, individual data points representing each animal are overlaid on the boxplot as dots. It's important to note that these dots may overlap due to multiple animals having the same or very similar values. ( a) Resting metabolic rate (convention housing: n = 12 animals, super-environmental enrichment: n = 12 animals, lockbox enrichment: n = 8 animals; 4 animals of the LE group were excluded because not enough data points of the measurement before the enrichment phase were available for analysis), ( b) number of mice solving the lockbox: n = 12 animals per group (data were analyzed using Chi-square test or McNemar test: * p < 0.05), ( c) total interaction time with the lockbox (n = 12 animals per group), ( d) interaction time with the lockbox until solved (only mice that were able to solve the lockbox were included; for n number see ( b)); ( e) oxygen consumption during lockbox trials in the calorimetric apparatus (only mice that interacted with the lockboxes and did not rest were included; before enrichment phase: n = 5 animals in the CH group, n = 6 animals in the SEE group, and n = 5 animals in the LE group; after the enrichment phase: n = 11 animals per group), ( f) fecal corticosterone metabolite concentrations (n = 12 animals per group). An asterisk (*) indicates a significant difference between two groups before or after the enrichment phase, or a significant difference within a group before and after the enrichment phase (details are given in the results section).
Figure 9.
Figure 9.. Bodyweight throughout the entire experiment.
Data are given as mean ± standard deviation.

Similar articles

References

    1. Mieske P, Hobbiesiefken U, Fischer-Tenhagen C, et al. : Bored at home?-A systematic review on the effect of environmental enrichment on the welfare of laboratory rats and mice. Front Vet Sci. 2022;9: 899219. 10.3389/fvets.2022.899219 - DOI - PMC - PubMed
    1. Cait J, Cait A, Scott RW, et al. : Conventional laboratory housing increases morbidity and mortality in research rodents: results of a meta-analysis. BMC Biol. 2022;20(1): 15. 10.1186/s12915-021-01184-0 - DOI - PMC - PubMed
    1. Directive 2010/63/EU of the European Parliament and of the council of 22 September 2010 on the protection of animals used for scientific purposes. Official Journal of the European Union ABI. L276/33-L276/79,2010. Reference Source
    1. Hobbiesiefken U, Mieske P, Lewejohann L, et al. : Evaluation of different types of enrichment - their usage and effect on home cage behavior in female mice. PLoS One. 2021;16(12): e0261876. 10.1371/journal.pone.0261876 - DOI - PMC - PubMed
    1. Olsson IA, Dahlborn K: Improving housing conditions for laboratory mice: a review of "environmental enrichment". Lab Anim. 2002;36(3):243–70. 10.1258/002367702320162379 - DOI - PubMed

LinkOut - more resources