[Preprint]. 2024 Aug 27:rs.3.rs-4876596.
doi: 10.21203/rs.3.rs-4876596/v1.

Mitochondrial RNA cytosolic leakage drives the SASP

Affiliations

Mitochondrial RNA cytosolic leakage drives the SASP

Stella Victorelli et al. Res Sq. .

Update in

  • Mitochondrial RNA cytosolic leakage drives the SASP.
    Victorelli S, Eppard M, Martini H, Woo SH, Everts SPA, Lee G, Pirius N, Han N, Liang EY, Franco AC, Han Y, Saul D, Nóvoa E, Nogueiras R, Splinter PL, O'Hara SP, Morgenthaler O, Valenzuela-Pérez L, Kim Lee HS, Jurk D, LaRusso NF, Hirsova P, Passos JF. Victorelli S, et al. Nat Commun. 2025 Dec 15;16(1):10992. doi: 10.1038/s41467-025-66159-z. Nat Commun. 2025. PMID: 41398033 Free PMC article.

Abstract

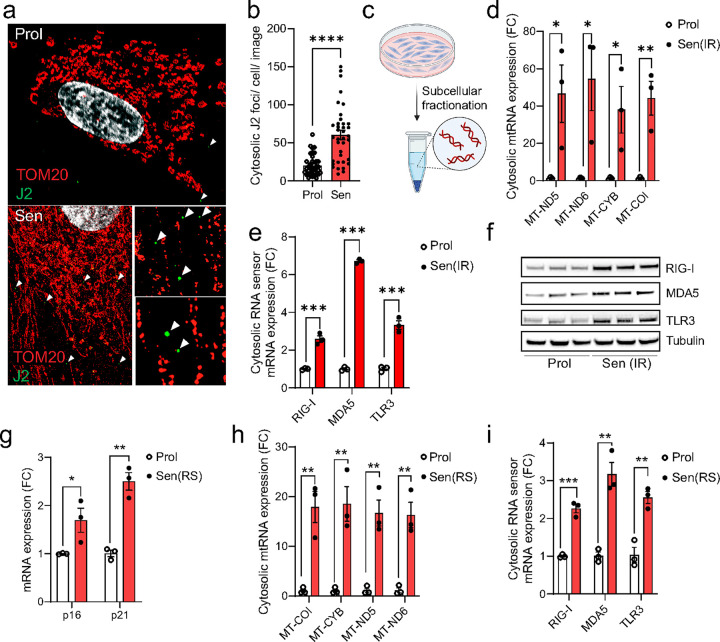
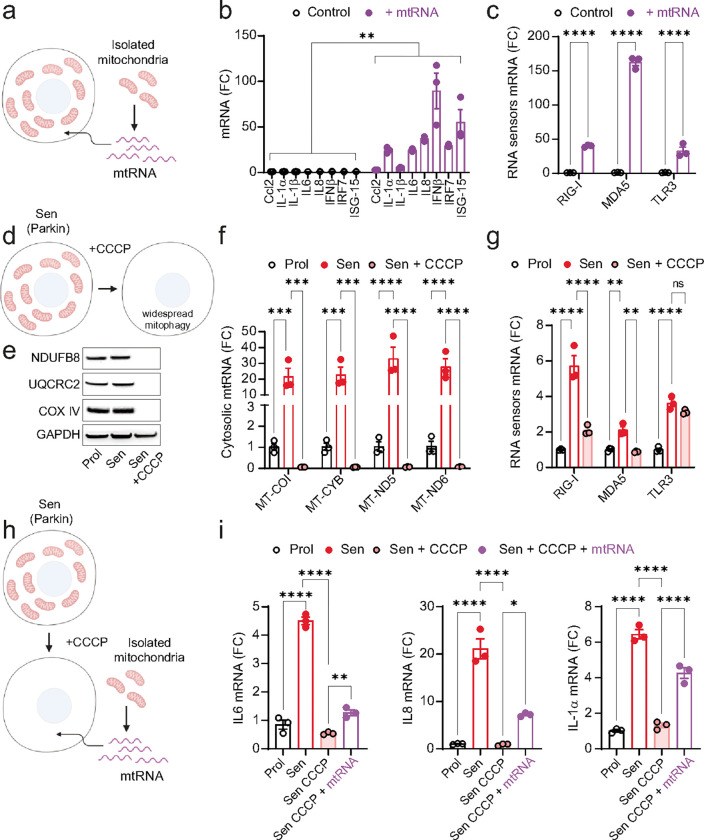
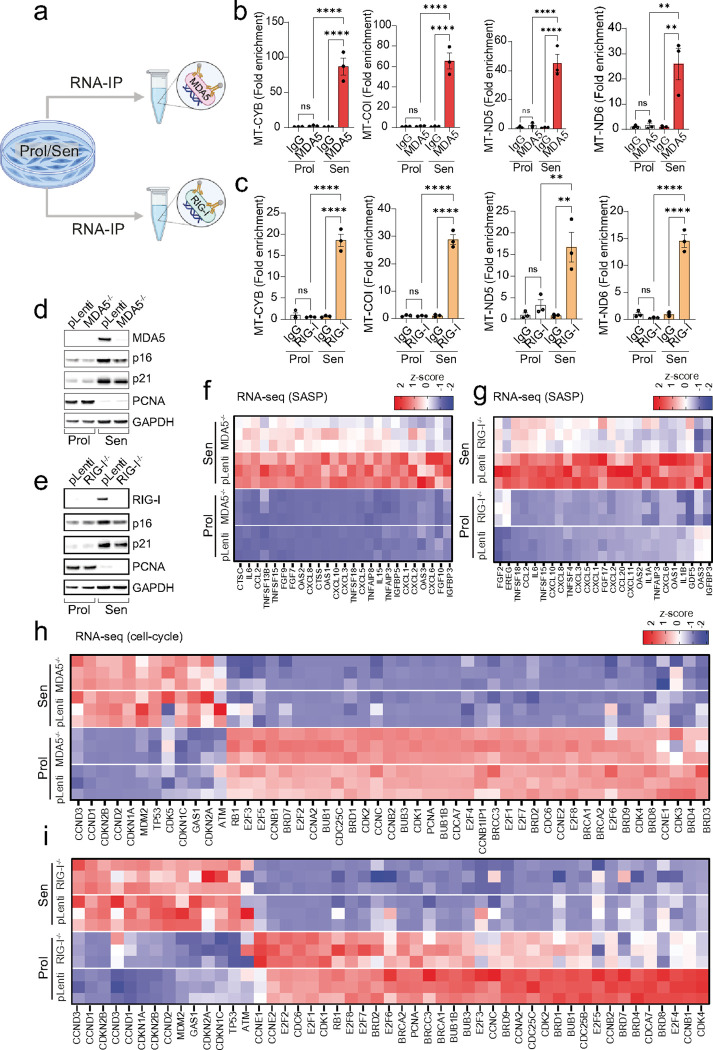
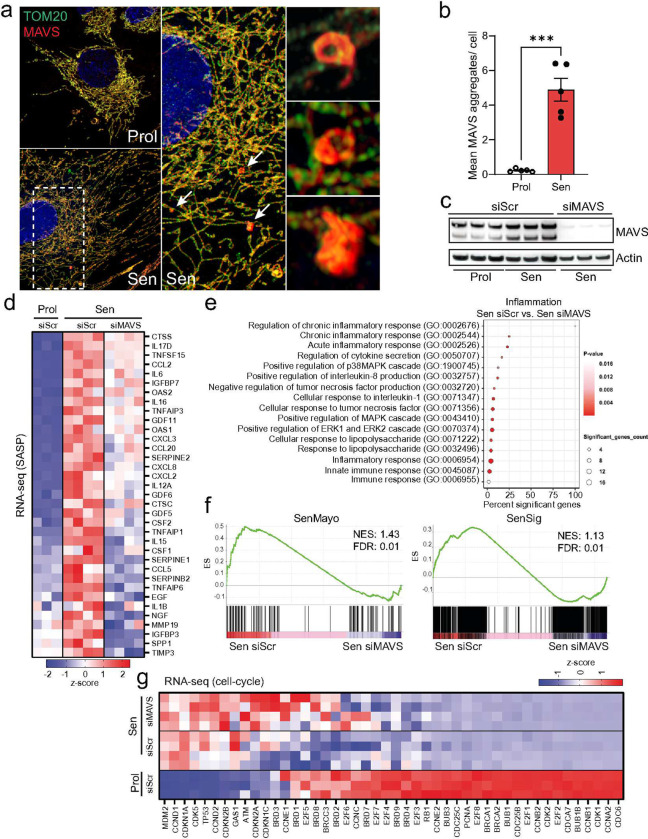
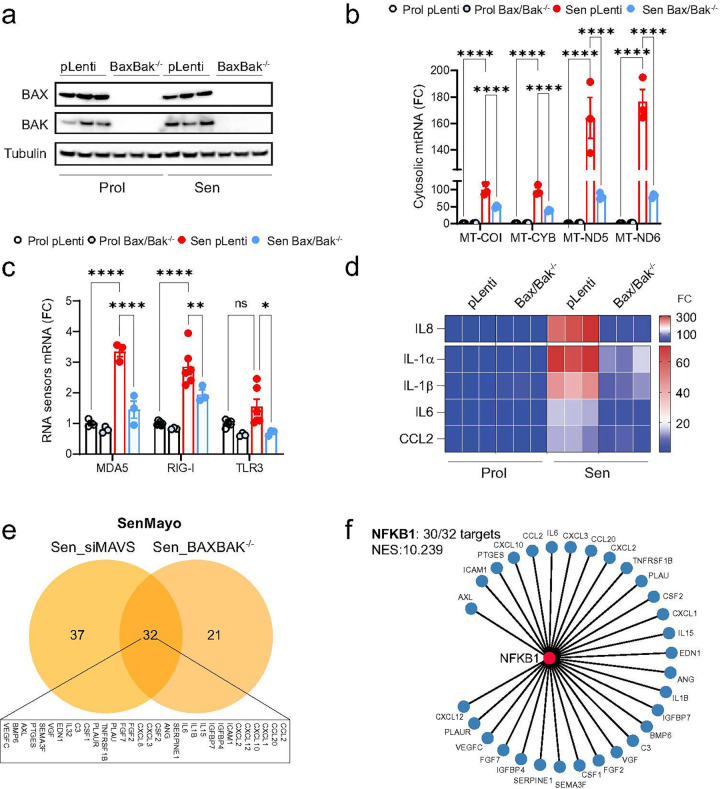
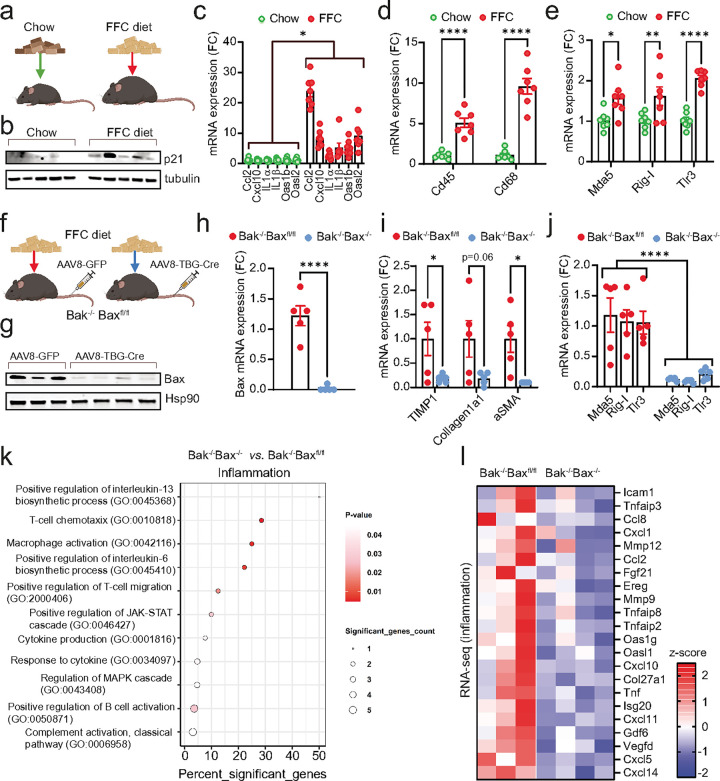
Senescent cells secrete proinflammatory factors known as the senescence-associated secretory phenotype (SASP), contributing to tissue dysfunction and aging. Mitochondrial dysfunction is a key feature of senescence, influencing SASP via mitochondrial DNA (mtDNA) release and cGAS/STING pathway activation. Here, we demonstrate that mitochondrial RNA (mtRNA) also accumulates in the cytosol of senescent cells, activating RNA sensors RIG-I and MDA5, leading to MAVS aggregation and SASP induction. Inhibition of these RNA sensors significantly reduces SASP factors. Furthermore, BAX and BAK plays a key role in mtRNA leakage during senescence, and their deletion diminishes SASP expression in vitro and in a mouse model of Metabolic Dysfunction Associated Steatohepatitis (MASH). These findings highlight mtRNA's role in SASP regulation and its potential as a therapeutic target for mitigating age-related inflammation.


Figures

Figure 1:
Figure 1:
Cytosolic mtRNA leakage is a feature of senescent cells. (a) Representative super-resolution Airyscan microscopy image of TOM20 (red) and J2 (dsRNA; green) in proliferating and senescent (IR) MRC5 human fibroblasts showing that dsRNA foci are enriched in the cytoplasm of senescent cells. (b) The number of cytosolic dsRNA foci in the cytosol of proliferating and senescent (IR) MRC5 human fibroblasts. (c) Representative scheme of subcellular fractionation method. (d, e) qPCR quantification of (d) cytosolic mtRNA transcripts and (e) cytosolic RNA sensors in proliferating and senescent (IR) MRC5 human fibroblasts. n=3 independent experiments. (f) Western blot showing expression of RNA sensors RIG-I, MDA5, and TLR3 in proliferating and senescent (IR) MRC5 human fibroblasts. n=3 independent experiments. (g) mRNA levels of senescence markers p16 and p21 in proliferating and senescent (IR) MRC5 human fibroblasts. (h, i) qPCR quantification of (h) cytosolic mtRNA transcripts and (i) cytosolic RNA sensors in proliferating and senescent (IR) MRC5 human fibroblasts. n=3 independent experiments. Data are mean ± s.e.m. Statistical significance was assessed by a two-sided Student’s unpaired t-test. *p<0.05, **p<0.01, ***p<0.001, ****p<0.0001.
Figure 2:
Figure 2:
Cytosolic mtRNA is a driver of the SASP. (a) Scheme showing the isolation of mitochondrial RNA (mtRNA) and its subsequent transfection into cells. (b, c) qPCR quantification of (b) SASP factors and (c) RNA sensors in proliferating MRC5 fibroblasts and following transfection with mtRNA. n=3 independent experiments. (d) Scheme representing Parkin-mediated widespread mitophagy following CCCP treatment. (e) Western blot showing the expression levels of mitochondrial proteins NDUFB8, UQCRC2 and COX IV, demonstrating the absence of mitochondrial proteins following Parkin-mediated clearance. (f, g) qPCR quantification of (f) cytosolic mtRNA genes MT-COI, MT-CYB, MT-ND5, MT-ND6 and (g) RNA sensors in Parkin-expressing IMR90 fibroblasts after widespread mitophagy. n=3 independent experiments. (h) Experimental scheme showing senescent Parkin-expressing IMR90 fibroblasts being transfected with mtRNA following Parkin-mediated widespread mitophagy. (i) mRNA expression of SASP genes in senescent Parkin-expressing IMR90 fibroblasts following widespread mitophagy and after transfection with mtRNA. n=3 independent experiments. Statistical significance was assessed by a two-sided Student’s unpaired t-test (b, c) and a oneway ANOVA followed by Tukey’s multiple comparison test (f, g, i). *p<0.05, **p<0.01, ***p<0.001, ****p<0.0001.
Figure 3:
Figure 3:
Cytosolic RNA sensors MDA5 and RIG-I are regulators of the SASP. (a) Scheme representing experimental design for RNA immunoprecipitation (RIP). (b, c) qPCR quantification of mtRNA genes following RNA-IP of (b) MDA5 and (c) RIG-I in proliferating and senescent cells. (d, e) Western blot showing the successful deletion of (d) MDA5 and (e) RIG-I, as well as expression of senescence markers p16, p21 and PCNA in proliferating and senescent fibroblasts. Representative of n=3 independent experiments. (f, g) Column-clustered heatmap of SASP genes that are upregulated in senescence and significantly downregulated upon (f) MDA5 and (g) RIG-I deletion. The color intensity represents the column z-score. (h, i) Column-clustered heatmap of cell-cycle related genes that are differentially expressed in senescent cells and not changed by (h) MDA5 and (i) RIG-I deletion. Color intensity represents the z-score. n=3 independent experiments. Statistical significance was assessed by a one-way ANOVA followed by Tukey’s multiple comparison test (b, c).
Figure 4:
Figure 4:
Aggregation of MAVS is a feature of senescent cells and plays a role in SASP regulation. (a) Representative super-resolution Airyscan microscopy image of TOM20 (green) and MAVS (red) in proliferating and senescent (IR) MRC5 fibroblasts showing MAVS aggregation in senescent cells. Arrows indicate MAVS aggregates that are amplified on the right. (b) The mean number of MAVS aggregates observed in proliferating and senescent MRC5 human fibroblasts. n=5 independent experiments. (c) Western blot showing successful small interfering RNA (siRNA) knockdown of MAVS in senescent MRC5 human fibroblasts. n=3 independent experiments. (d) Column-clustered heatmap of SASP genes upregulated in senescent cells and significantly downregulated upon knockdown of MAVS. Color intensity represents the z-score. n=3–4 independent experiments. (e) Gene ontology (GO) term enrichment analysis showing pathways related to inflammation that are significantly altered between senescent control (Sen siScr) and senescent cells lacking MAVS (Sen siMAVS). (f) The GSEA plots for Sen siScr and Sen siMAVS show an enrichment of SenMayo and SenSign genes in senescent control cells. (g) Columnclustered heatmap of cell-cycle genes upregulated in senescent cells and not changed by MAVS siRNA knockdown. Color intensity represents the column z-score. n=3–4 independent experiments. Statistical significance was assessed by a two-sided Student’s unpaired t-test (b). ***p<0.001.
Figure 5:
Figure 5:
BAX and BAK mediate the leakage of mtRNA into the cytosol of senescent cells. Human fibroblasts deficient in BAX and BAK (BAX−/− BAK−/−) were generated using CRISPR-Cas9 gene editing. (a) Western blot showing successful deletion of BAX and BAK in proliferating and senescent MRC5 fibroblasts. n=3 independent experiments. (b) qPCR quantification of cytosolic mtRNA transcripts in the cytosol of proliferating and senescent BAX−/− BAK−/− cells. (c) mRNA expression of cytosolic RNA sensors in proliferating and senescent BAX−/− BAK−/− cells. (d) mRNA levels of SASP-related genes that are significantly increased in senescence and decreased by deletion of BAX/BAK. n=3 independent experiments. (e) Venn diagram depicting the overlap of commonly downregulated genes between senescent cells lacking MAVS (Sen_siMAVS) and deficient for BAX/BAK (Sen_BAXBAK−/−). (f) Using iRegulon, the transcription factor NF-κB1 was found to control 30 of the 32 overlapping target genes from (e), indicating it is the most likely key regulator (NES 10.239) for these SASP factors. Data are mean ± s.e.m. Statistical significance was assessed by a one-way ANOVA followed by Tukey’s multiple comparison test (b, c).
Figure 6:
Figure 6:
Hepatocyte-specific deletion of BAX/BAK reduces expression of RNA sensors and inflammation in the liver during MASH. (a) Wild-type mice (10–12 weeks old) were fed either a chow or high fat, fructose and cholesterol (FFC) diet for 24 weeks to induce MASH. (b) Western blot showing expression of the senescence marker, p21, in the liver of chow- and FFCfed mice. n=5 mice per group. (c-e) mRNA expression levels of (c) SASP-related genes, (d) immune cell markers, Cd45 and Cd68 and (e) cytosolic RNA sensors in the livers from chow and FFC-fed mice. n=7 mice per group. (f) Bak−/− Baxfl/fl mice (10–12 weeks old) were fed an FFC diet for 16 weeks to induce MASH. Mice were then injected with either AAV8-GFP (control) or AAV8-TBG-Cre virus via the tail vein to induce deletion of Bax specifically in hepatocytes. (g) Western blot showing successful deletion of Bax in the liver following AAV8-TBG-Cre injection. n=3–4 mice per group. (h-j) qPCR quantification of (h) Bax, (i) markers of fibrosis and (j) RNA sensors in livers of FFC-fed Bak−/− Baxfl/fl and Bak−/− Bax−/− mice. n=5 mice per group. (k) Gene ontology (GO) term enrichment analysis showing pathways related to inflammation that are significantly altered between livers from FFC-fed Bak−/− Baxfl/fl and Bak−/− Bax−/− mice. (l) Columnclustered heatmap of inflammation genes that are significantly downregulated in the liver of FFC-fed mice upon deletion of Bax and Bak. Color intensity represents the column z-score. Statistical significance was assessed by a two-sided Student’s unpaired t-test (c-e, h-j). *p<0.05, **p<0.01, ****p<0.0001.

References

    1. Hernandez-Segura A., Nehme J. & Demaria M. Hallmarks of Cellular Senescence. Trends in Cell Biology 28, 436–453 (2018). 10.1016/j.tcb.2018.02.001 - DOI - PubMed
    1. López-Otín C., Blasco M. A., Partridge L., Serrano M. & Kroemer G. The hallmarks of aging. Cell 153, 1194–1217 (2013). 10.1016/j.cell.2013.05.039 - DOI - PMC - PubMed
    1. Campisi J. Aging, cellular senescence, and cancer. Annu Rev Physiol 75, 685–705 (2013). 10.1146/annurev-physiol-030212-183653 - DOI - PMC - PubMed
    1. Coppé J.-P., Desprez P.-Y., Krtolica A. & Campisi J. The senescence-associated secretory phenotype: the dark side of tumor suppression. Annu Rev Pathol 5, 99–118 (2010). 10.1146/annurev-pathol-121808-102144 - DOI - PMC - PubMed
    1. Kuilman T., Michaloglou C., Mooi W. J. & Peeper D. S. The essence of senescence. Genes & Development 24, 2463–2479 (2010). 10.1101/gad.1971610 - DOI - PMC - PubMed

Publication types

LinkOut - more resources