. 2024 Dec;13(32):e2402688.
doi: 10.1002/adhm.202402688. Epub 2024 Sep 11.

PEI-Engineered Lipid@PLGA Hybrid Nanoparticles for Multimodal Delivery of Antigens and Immune Adjuvants to the Respiratory Mucosa

Affiliations

PEI-Engineered Lipid@PLGA Hybrid Nanoparticles for Multimodal Delivery of Antigens and Immune Adjuvants to the Respiratory Mucosa

Susy Brusco et al. Adv Healthc Mater. 2024 Dec.

Abstract

Antigen delivery via respiratory mucosal surfaces is an interesting needle-free option for vaccination. Nonetheless, it demands for the design of especially tailored formulations. Here, lipid/poly(lactic-co-glycolic) acid (PLGA) hybrid nanoparticles (hNPs) for the combined delivery of an antigen, ovalbumin (Ova), and an adjuvant, synthetic unmethylated cytosine-phosphate-guanine oligodeoxynucleotide (CpG) motifs, is developed. A panel of Ova/CpG-loaded lipid@PLGA hNPs with tunable size and surface is attained by exploiting two lipid moieties, 1,2 distearoil-sn-glycero-3-phosphoethanolamine-poly(ethylene glycol) (DSPE-PEG) and monophosphoryl lipid A (MPLA), with or without polyethyleneimine (PEI). It is gained insights on the lipid@PLGA hNPs through a combination of techniques to analytically determine the specific moiety on the surface, the spatial distribution of the components and the internal structure of the nanoplatforms. The collected results suggest that PEI plays a role of paramount importance not only in promoting in vitro antigen escape from lysosomes and enhancing antigen cross-presentation, but also in determining the arrangement of the moieties in the final architecture of the hNPs. Though multicomponent PEI-engineered lipid@PLGA hNPs turn out as a viable strategy for delivery of antigens and adjuvant to the respiratory mucosa, tunable nanoparticle features are achievable only through the optimal selection of the components and their relative amounts.

Keywords: PLGA; antigen presentation; lipid/polymer hybrid nanoparticles; mucosal vaccination; poly(ethylenimine).


Conflict of interest statement

The authors declare no conflict of interest.

Figures

Figure 1
Figure 1
Schematic representation of Ova/CpG‐loaded MPLA@PLGA and DSPE‐PEG@PLGA hNPs.
Figure 2
Figure 2
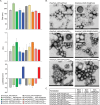
Characterization of Ova/CpG‐loaded MPLA@PLGA and DSPE‐PEG@PLGA hNPs. A) Size, polydispersity index (PDI) and zeta potential of the different formulations. B) TEM images of optimized Ova/CpG‐loaded hNPs. Field is representative of the formulation. C) NTA characterization. Mean, Span and Particle concentration (hNPs/ml) as calculated by the NTA software. Results are reported as mean of three measurements on three different batches (n = 9) ± standard deviation (SD).
Figure 3
Figure 3
In vitro release profiles at pH 7.2 and 37 °C of Ova and CpG from MPLA@PLGA hNPs A and C) and DSPE‐PEG@PLGA hNPs B and D). The release profiles of Ova and CpG from bare PLGA nanoparticles (Ova/CpG@PLGA) in the same experimental conditions are reported for comparison. Results are reported as mean of two measurements on three different batches (n = 6) ± standard deviation (SD).
Figure 4
Figure 4
Surface analysis of Ova/CpG‐loaded lipid@PLGA nanoparticles. A,B) FALT measurements of the shell thickness, derived from the slopes of the corresponding linear regressions. B) Percentage of MPLA associated to MPLA@PLGA hNPs. C) Amount of PEG quantified in DSPE‐PEG@PLGA hNPs through ELISA. Results are reported as mean of two measurements on three different batches (n = 6) ± standard deviation (SD).
Figure 5
Figure 5
In vitro evaluation of the interactions of Ova/CpG‐loaded lipid@PLGA hNPs with the mucus barrier. A) Scattering at 650 nm of hNP/mucin dispersions at time 0 and after incubation for 30 and 60 min at 37 °C. The scattering profile of control hNP dispersions in water and Ova/CpG_PLGA nanoparticles in the same conditions are reported for comparison. B) Size distribution profile of nanoparticle dispersions in water and mucin as evaluated by DLS. C,D) In vitro transport of Ova/CpG‐loaded fluorescent hNPs through artificial mucus (AM) as determined by the Transwell® multiplate assay. Results are presented as the percentage of fluorescent hNPs permeating across AM as a function of time. Data are expressed as the mean ± standard deviation (SD) calculated for three different batches (n = 6).
Figure 6
Figure 6
DSC thermograms of MPLA@PLGA hNPs formulations in comparison to PLGA, Ova and PEI as raw materials in the temperature range from 20 to 80 °C at a constant heating rate of 5 °C min−1.
Figure 7
Figure 7
A) SAXS spectra and fitting of high PEI containing, CpG loaded (red circle) or unloaded (orange squares), MPLA@PLGA hNPs and of low PEI containing MPLA@PLGA hNPs (blue triangles). For the sake of visibility, Ova/CpG_MPLA@PLGA/PEIhigh and Ova_MPLA@PLGA/PEIhigh hPNs spectra are shifted by a factor of 100 and 10, respectively. Spectra are analyzed by core‐multishell form factor models. Particle radii were polydisperse with PDI = 0.15. Data are acquired at Austrian SAXS beamline of ELETTRA (IT). B) Data are acquired at Austrian SAXS beamline of ELETTRA (IT). B) Radial distribution of the Scattering Length Density for the three particles in A. C) SAXS spectra of Ova/CpG_DSPE‐PEG@PLGA/PEIhigh hNPs (green circles) with a core‐multishell form factor fit (black line) in comparison with the scattering profile of DSPE‐PEG@PLGA hNPs (gray line / rescaled). Data are acquired at the beamline ID02 of ESRF (FR). (*) previously studied.[ 26 ]
Figure 8
Figure 8
Molecular dynamics simulations of Ova/CpG_MPLA system. A) RMSD time series of 4 different replica Ova/CpG calculated on P‐DNA atoms with respect to docking output. B) RMSD time series of 4 different replicas of Ova/CpG_MPLA calculated on P‐DNA atoms with respect to top 1 C) 3D model structure Ova/CpG_MPLA of top1 after 200 ns of simulations. Ova proteins is represented as electrostatic surface ±5kT, CpG as brown cartoon and green sticks, MPLA molecules as yellow (fatty acyl group) and red licorice (sugar oxygen).
Figure 9
Figure 9
Antigen uptake and cross‐presentation. In vitro uptake of rhodamine‐labeled hNPs (red) in murine DCs (green: LAMP‐1, lysosomal marker), cell nuclei are stained blue with Hoechst. Representative color overlay images for 2, 6, and 24 h time points are shown.
Figure 10
Figure 10
Antigen cross‐presentation. IL‐2 production after B3Z cell activation by antigen‐loaded BMDC. 1, 5 and 10 µg ml−1 Ovalbumin loaded on different nanoparticle formulations were assayed. IL‐2 was measured by ELISA assay; each value represents average (± standard deviation) value of technical replicates. A representative experiment is reported.

References

    1. Bessa J., Schmitz N., Hinton H. J., Schwarz K., Jegerlehner A., Bachmann M. F., Eur. J. Immunol. 2008, 38, 114. - PubMed
    1. Dotiwala F., Upadhyay A. K., Vaccines 2023, 11, 1585. - PMC - PubMed
    1. Tsai C. J. Y., Loh J. M. S., Fujihashi K., Kiyono H., Expert Rev. Vaccines 2023, 22, 885. - PubMed
    1. Hellfritzsch S., Pharmaceutics 2019, 11, 375. - PubMed
    1. Chow M. Y.‐T., Lam J. K. W., in 2023, Respiratory Delivery of Biologics, Nucleic Acids, and Vaccines (Eds.: Lam J., Kwok P. C. L.), Springer International Publishing, Cham, 123.

MeSH terms