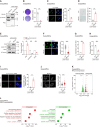
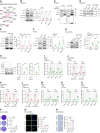
. 2024 Oct 28;52(19):11481-11499.
doi: 10.1093/nar/gkae740.

CRISPR screening uncovers nucleolar RPL22 as a heterochromatin destabilizer and senescence driver

Affiliations

CRISPR screening uncovers nucleolar RPL22 as a heterochromatin destabilizer and senescence driver

Hong-Yu Li et al. Nucleic Acids Res. .

Abstract

Dysfunction of the ribosome manifests during cellular senescence and contributes to tissue aging, functional decline, and development of aging-related disorders in ways that have remained enigmatic. Here, we conducted a comprehensive CRISPR-based loss-of-function (LOF) screen of ribosome-associated genes (RAGs) in human mesenchymal progenitor cells (hMPCs). Through this approach, we identified ribosomal protein L22 (RPL22) as the foremost RAG whose deficiency mitigates the effects of cellular senescence. Consequently, absence of RPL22 delays hMPCs from becoming senescent, while an excess of RPL22 accelerates the senescence process. Mechanistically, we found in senescent hMPCs, RPL22 accumulates within the nucleolus. This accumulation triggers a cascade of events, including heterochromatin decompaction with concomitant degradation of key heterochromatin proteins, specifically heterochromatin protein 1γ (HP1γ) and heterochromatin protein KRAB-associated protein 1 (KAP1). Subsequently, RPL22-dependent breakdown of heterochromatin stimulates the transcription of ribosomal RNAs (rRNAs), triggering cellular senescence. In summary, our findings unveil a novel role for nucleolar RPL22 as a destabilizer of heterochromatin and a driver of cellular senescence, shedding new light on the intricate mechanisms underlying the aging process.


Figures

Graphical Abstract
Graphical Abstract
Figure 1.
Figure 1.
CRISPR/Cas9-based screening for ribosome-associated genes in promoting hMPC senescence. (A) Schematic of CRISPR/Cas9-based screening of RAGs library to identify senescence-promoting genes in RS hMPCs. (B) Enrichment levels were estimated for each gene at 2, 5, 8 and 10 weeks after infection of RAGs lentiviral library in RS hMPCs. The red dots indicated the top 5 enriched genes. The dark gray dots indicate non-targeting control (NTC) sgRNAs. (C) Venn diagram showing enriched genes (left) from two replicative screenings (replicate 1 at 10 weeks; replicate 2 at 12 weeks). The overlapped 9 genes were showed in the table (right). (D) Western blot analysis of RPL22 protein level in RS hMPCs at early passage (EP, P3) and late passage (LP, P13). β-Tubulin was used as loading control. Data are presented as the means ± SEMs. n = 3 biological replicates. Two-tailed unpaired Student's ttest was performed. (E) Western blot analysis of RPL22 protein level in RS hMPCs after CRISPR-mediated knock-out of RPL22 using lentivirus with two sgRNAs. β-Tubulin was used as loading control. Data are presented as the means ± SEMs. n = 3 biological replicates. Two-tailed unpaired Student's ttest was performed. (F) Clonal expansion analysis of RS hMPCs after CRISPR-mediated knock-out of RPL22 using lentivirus with two sgRNAs. Data are presented as the means ± SEMs. n = 3 biological replicates. Two-tailed unpaired Student's ttest was performed. (G) Immunostaining analysis of Ki67 in RS hMPCs after CRISPR-mediated knock-out of RPL22 using lentivirus with two sgRNAs. Scale bar, 10 μm. Data are presented as the means ± SEMs. n = 3 biological replicates. The white arrows indicate Ki67-positive cells. Two-tailed unpaired Student's ttest was performed. (H) SA-β-Gal staining of RS hMPCs after CRISPR-mediated knock-out of RPL22 using lentivirus with two sgRNAs. Scale bar, 100 μm. Data are presented as the means ± SEMs. n = 3 biological replicates. Two-tailed unpaired Student's ttest was performed. (I) Western blot analysis of P16 and P21 protein levels in RS hMPCs after CRISPR-mediated knock-out of RPL22 using lentivirus with two sgRNAs. β-Tubulin was used as loading control. Data are presented as the means ± SEMs. n = 3 biological replicates. Two-tailed unpaired Student's ttest was performed. (J) ELISA analysis of IL-6 secretion in RS hMPCs after CRISPR-mediated knock-out of RPL22 using lentivirus with two sgRNAs. Data are presented as the means ± SEMs. n = 3 biological replicates. Two-tailed unpaired Student's t test was performed.
Figure 2.
Figure 2.
RPL22 deficiency alleviates hMPC senescence. (A) Schematic of generation of RPL22+/+ and RPL22-/- hMPCs derived from hESCs. (B) Western blot analysis of RPL22 protein level in RPL22+/+ and RPL22-/- hMPCs. β-Tubulin was used as loading control. (C) Growth curve analysis of RPL22+/+ and RPL22-/- hMPCs. (D) Clonal expansion analysis of RPL22+/+ and RPL22-/- hMPCs. Data are presented as the means ± SEMs. n = 3 biological replicates. Two-tailed unpaired Student's ttest was performed. (E) Immunostaining analysis of Ki67 in RPL22+/+ and RPL22-/- hMPCs. Scale bar, 10 μm. Data are presented as the means ± SEMs. n = 3 biological replicates. The white arrows indicate Ki67-positive cells. Two-tailed unpaired Student's ttest was performed. (F) EdU staining of RPL22+/+ and RPL22-/- hMPCs. Scale bar, 10 μm. Data are presented as the means ± SEMs. n = 3 biological replicates. The white arrows indicate EdU-positive cells. Two-tailed unpaired Student's ttest was performed. (G) SA-β-Gal staining of RPL22+/+ and RPL22-/- hMPCs. Scale bar, 100 μm. Data are presented as the means ± SEMs. n = 3 biological replicates. Two-tailed unpaired Student's t test was performed. (H) Western blot analysis of P16, Lamin B1 and LAP2 protein levels in RPL22+/+ and RPL22-/- hMPCs. β-Tubulin was used as loading control. Data are presented as the means ± SEMs. n = 3 biological replicates. Two-tailed unpaired Student's ttest was performed. (I) Immunostaining analysis of LAP2 in RPL22+/+ and RPL22-/- hMPCs. Scale bar, 10 μm. Data are presented as the means ± SEMs. n = 200 cells. Two-tailed unpaired Student's ttest was performed. (J) ELISA analysis of IL-6 secretion in RPL22+/+ and RPL22-/- hMPCs. Data are presented as the means ± SEMs. n = 3 biological replicates. Two-tailed unpaired Student's ttest was performed. (K) Real-time quantitative PCR (qPCR) analysis of telomere length in RPL22+/+ and RPL22-/- hMPCs. The expression level was normalized to 36B4. Data are presented as the means ± SEMs. n = 4 technical replicates. Two-tailed unpaired Student's t test was performed. Data are representative of three independent experiments. (L) Immunostaining analysis of γH2AX and 53BP1 in RPL22+/+ and RPL22-/- hMPCs. Scale bar, 5 μm. Data are presented as the means ± SEMs. n = 3 biological replicates. The white arrows indicate γH2AX and 53BP1-double-positive foci. Two-tailed unpaired Student's ttest was performed. (M) Nuclear size of RPL22+/+ and RPL22-/- hMPCs. Scale bar, 20 μm (left) and 5 μm (right). Data are presented as the means ± SEMs. n = 200 cells. Two-tailed unpaired Student's t test was performed. (N) Venn diagrams showing overlapped DEGs in both RS hMPCs (RPL22+/+ hMPCs, LP versus EP) and RPL22-/- hMPCs (LP versus RPL22+/+ hMPCs). (O) Bar plot showing GO terms and pathways associated with DEGs rescued by RPL22 knock-out. Downregulated DEGs in RS hMPCs that were reversed by RPL22 knock-out were colored in red. Upregulated DEGs in RS hMPCs that were reversed by RPL22 knock-out were colored in green.
Figure 3.
Figure 3.
Overexpression of RPL22 accelerates hMPC senescence. (A) Western blot analysis of RPL22 protein level in young hMPCs transduced with lentiviruses expressing Flag-Luc or Flag-RPL22. β-Tubulin was used as loading control. (B) Clonal expansion analysis of young hMPCs transduced with lentiviruses expressing Luc or RPL22. Data are presented as the means ± SEMs. n = 3 biological replicates. Two-tailed unpaired Student's ttest was performed. (C) Immunostaining analysis of Ki67 in young hMPCs transduced with lentiviruses expressing Luc or RPL22. Scale bar, 10 μm. Data are presented as the means ± SEMs. n = 3 biological replicates. The white arrows indicate Ki67-positive cells. Two-tailed unpaired Student's t test was performed. (D) SA-β-Gal staining of young hMPCs transduced with lentiviruses expressing Luc or RPL22. Scale bar, 100 μm. Data are presented as the means ± SEMs. n = 3 biological replicates. Two-tailed unpaired Student's ttest was performed. (E) Western blot analysis of P16, Lamin B1 and LAP2 protein levels in young hMPCs transduced with lentiviruses expressing Luc or RPL22. β-Tubulin was used as loading control. Data are presented as the means ± SEMs. n = 3 biological replicates. Two-tailed unpaired Student's ttest was performed. (F) Immunostaining analysis of LAP2 in young hMPCs transduced with lentiviruses expressing Luc or RPL22. Scale bar, 10 μm. Data are presented as the means ± SEMs. n = 200 cells. Two-tailed unpaired Student'st test was performed. (G) ELISA analysis of IL-6 secretion in young hMPCs transduced with lentiviruses expressing Luc or RPL22. Data are presented as the means ± SEMs. n = 3 biological replicates. Two-tailed unpaired Student's t test was performed. (H) Real-time quantitative PCR (qPCR) analysis of telomere length in young hMPCs transduced with lentiviruses expressing Luc or RPL22. The expression level was normalized to 36B4. Data are presented as the means ± SEMs. n = 4 technical replicates. Two-tailed unpaired Student's t test was performed. Data are representative of three independent experiments. (I) Immunostaining analysis of γH2AX and 53BP1 in young hMPCs transduced with lentiviruses expressing Luc or RPL22. Scale bar, 5 μm. Data are presented as the means ± SEMs. n = 3 biological replicates. The white arrows indicate γH2AX and 53BP1-double-positive foci. Two-tailed unpaired Student's t test was performed. (J) Nuclear size of young hMPCs transduced with lentiviruses expressing Luc or RPL22. Scale bar, 20 μm (left) and 5 μm (right). Data are presented as the means ± SEMs. n = 200 cells. Two-tailed unpaired Student's t test was performed. (K) Volcano plot showing upregulated (red) or downregulated (green) DEGs in young hMPCs transduced with lentiviruses expressing RPL22 compared to Luc. (L) Dot plots showing GO terms and pathways associated with upregulated (red) and downregulated DEGs (green) in young hMPCs transduced with lentiviruses expressing RPL22 compared to Luc.
Figure 4.
Figure 4.
RPL22 induces rRNA transcription during hMPC senescence. (A) Schematic of RPL22WT, RPL22ΔN9/C8 with nine amino acid residues deleted at the N-terminal and eight amino acid residues deleted at the C-terminal of RPL22, RPL22m88A with four mutations (lysine at 88, 89, 92 and 93 to alanine), and RPL22m13-16 with four mutations (lysine at 13, 14, 15 and 16 to alanine). (B) Clonal expansion analysis of RPL22-/- hMPCs transduced with lentiviruses expressing Luc, RPL22 or RPL22ΔN9/C8. Data are presented as the means ± SEMs. n = 3 biological replicates. Two-tailed unpaired Student's ttest was performed. (C) Immunostaining analysis of Ki67 in RPL22-/- hMPCs transduced with lentiviruses expressing Luc, RPL22WT or RPL22ΔN9/C8. Scale bar, 10 μm. Data are presented as the means ± SEMs. n = 3 biological replicates. The white arrows indicate Ki67-positive cells. Two-tailed unpaired Student's ttest was performed. (D) SA-β-Gal staining of RPL22-/- hMPCs transduced with lentiviruses expressing Luc, RPL22WT or RPL22ΔN9/C8. Scale bar, 100 μm. Data are presented as the means ± SEMs. n = 3 biological replicates. Two-tailed unpaired Student's ttest was performed. (E) 3D reconstruction of a Z-stack of RPL22 (green) and nucleolin (red) immunofluorescence images in RS hMPCs at early passage (EP, P3) and late passage (LP, P13). Scale bar, 5 μm. The intensity of RPL22 in nucleolus was quantified and presented as the means ± SEMs. n = 200 cells. Two-tailed unpaired Student's t test was performed. (F) The nucleolar size (left), and the percentage of cells with indicated nucleoli numbers (right) in RS hMPCs at early passage (EP, P3) and late passage (LP, P13). Data are presented as the means ± SEMs. n = 200 cells (left), or three biological replicates (right). Two-tailed unpaired Student's t test was performed. (G) 3D reconstruction of a Z-stack of nucleolin immunofluorescence images in young hMPCs transduced with lentiviruses expressing Luc or RPL22. The nucleolar size (middle) and the percentage of cells with indicated nucleoli numbers (right) were quantified. Scale bar, 5 μm. Data are presented as the means ± SEMs. n = 200 cells (left), or three biological replicates (right). Two-tailed unpaired Student's t test was performed. (H) Northern blot analysis of rRNAs (28S, 18S and 5.8S) levels in young hMPCs transduced with lentiviruses expressing Luc or RPL22. U1 snRNA was used as loading control. Data are presented as the means ± SEMs. n = 3 biological replicates. Two-tailed unpaired Student's t test was performed. (I) 3D reconstruction of a Z-stack of nucleolin immunofluorescence images in RPL22+/+ and RPL22-/- hMPCs at late passage (P10) (left). The nucleolar size (middle) and the percentage of cells with indicated nucleoli numbers (right) were quantified. Scale bar, 5 μm. Data are presented as the means ± SEMs. n = 200 cells (left), or three biological replicates (right). Two-tailed unpaired Student's t test was performed. (J) Northern blot analysis of rRNAs (28S, 18S and 5.8S) levels in RPL22+/+ and RPL22-/- hMPCs at late passage (P10). U1 snRNA was used as loading control. Data are presented as the means ± SEMs. n = 3 biological replicates. Two-tailed unpaired Student's t test was performed. (K) 3D reconstruction of a Z-stack of nucleolin immunofluorescence images in RPL22-/- hMPCs transduced with lentiviruses expressing Luc, RPL22WT or RPL22m88A (left). The nucleolar size (middle) and the percentage of cells with different nucleolar number (right) were quantified. Scale bar, 5 μm. Data are presented as the means ± SEM. n = 200 cells (left), or three biological replicates (right). Two-tailed unpaired Student's ttest was performed. (L) Immunostaining analysis of Ki67 in RPL22-/- hMPCs transduced with lentiviruses expressing Luc, RPL22WT or RPL22m88A. Scale bar, 10 μm. Data are presented as the means ± SEMs. n = 3 biological replicates. The white arrows indicate Ki67-positive cells. Two-tailed unpaired Student's ttest was performed. (M) SA-β-Gal staining of RPL22-/- hMPCs transduced with lentiviruses expressing Luc, RPL22WT or RPL22m88A. Scale bar, 100 μm. Data are presented as the means ± SEMs. n = 3 biological replicates. Two-tailed unpaired Student's t test was performed.
Figure 5.
Figure 5.
RPL22 binds rDNA and destabilizes HP1γ and KAP1 in senescent hMPCs. (A) Network diagram showing heterochromatin-associated proteins interacted with RPL22. The color key from white to red indicates coverage levels from low to high. (B) Western blot analysis of HP1γ, KAP1 and H3K9me3 protein levels in RS hMPCs. β-Tubulin was used as loading control for HP1γ and KAP1. Histone 3 (H3) was used as loading control for H3K9me3. Data are presented as the means ± SEMs. n = 3 biological replicates. Two-tailed unpaired Student's ttest was performed. (C) Co-IP analysis of the exogenous interaction between RPL22 and HP1γ or KAP1 in HEK293T cells transduced with Flag-Luc and Flag-RPL22. (D) Co-IP analysis showing that endogenous RPL22 is interacted with HP1γ or KAP1 in RPL22+/+ and RPL22-/- hMPCs at early passage (EP, P3). (E, F) Western blot analysis of HP1γ, KAP1 and H3K9me3 protein levels in young hMPCs transduced with lentiviruses expressing Luc or RPL22 (E) and in RPL22+/+ and RPL22-/- hMPCs (F). β-Tubulin was used as loading control for HP1γ and KAP1. Histone 3 (H3) was used as loading control for H3K9me3. Data are presented as the means ± SEMs. n = 3 biological replicates. Two-tailed unpaired Student's t test was performed. (G) Western blot analysis of HP1γ and KAP1 protein levels in RPL22-/- hMPCs transduced with lentiviruses expressing Luc, RPL22WT or RPL22m88A. β-Tubulin was used as loading control. Data are presented as the means ± SEMs. n = 3 biological replicates. Two-tailed unpaired Student's ttest was performed. (H) Western blot analysis of HP1γ and KAP1 protein levels in young hMPCs transduced with lentiviruses expressing Flag-Luc or Flag-RPL22 after treatment with or without MG132 (20 μM for 12 h). β-Tubulin was used as loading control. Data are presented as the means ± SEMs. n = 3 biological replicates. Two-tailed unpaired Student's ttest was performed. (I) Relative enrichment of RPL22 at rDNA regions in RPL22+/+ and RPL22-/- hMPCs. Data are presented as the means ± SEMs. n = 5 technical replicates. Two-tailed unpaired Student's ttest was performed. Data are representative of three independent experiments. (J–L) Relative enrichment of HP1γ (J), KAP1 (K) or H3K9me3 (L) at rDNA regions in young hMPCs transduced with lentiviruses expressing Luc or RPL22. Data are presented as the means ± SEMs. n = 5 technical replicates. Two-tailed unpaired Student's ttest was performed. Data are representative of three independent experiments. (M–O) Relative enrichment of HP1γ (M), KAP1 (N) or H3K9me3 (O) at rDNA regions in RPL22+/+ and RPL22-/- hMPCs. Data are presented as the means ± SEMs. n = 5 technical replicates. Two-tailed unpaired Student's t test was performed. Data are representative of three independent experiments. (P) Clonal expansion analysis of RPL22-/- hMPCs transduced with lentiviruses expressing sh-GL2, sh-HP1γ or sh-KAP1. Data are presented as the means ± SEMs. n = 3 biological replicates. Two-tailed unpaired Student's ttest was performed. (Q) Immunostaining analysis of Ki67 in RPL22-/- hMPCs transduced with lentiviruses expressing sh-GL2, sh-HP1γ or sh-KAP1. Scale bar, 10 μm. Data are presented as the means ± SEMs. n = 3 biological replicates. The white arrows indicate Ki67-positive cells. Two-tailed unpaired Student's t test was performed. (R) SA-β-Gal staining of RPL22-/- hMPCs transduced with lentiviruses expressing sh-GL2, sh-HP1γ or sh-KAP1. Scale bar, 100 μm. Data are presented as the means ± SEMs. n = 3 biological replicates. Two-tailed unpaired Student's t test was performed.
Figure 6.
Figure 6.
RPL22 depletion counteracts senescence of human cells. (A, C) Clonal expansion analysis of HGPS (A) and WS (C) hMPCs at late passage (P8) after lentivirus-mediated CRISPR knock-out with sgRPL22. Data are presented as the means ± SEMs. n = 3 biological replicates. Two-tailed unpaired Student's t test was performed. (B, D) SA-β-Gal staining of HGPS (B) and WS (D) hMPCs at late passage (P8) after lentivirus-mediated CRISPR knock-out with sgRPL22. Scale bar, 100 μm. Data are presented as the means ± SEMs. n = 3 biological replicates. Two-tailed unpaired Student's ttest was performed. (E, G) Clonal expansion analysis of UV- (E) or H2O2- (G) induced hMPC senescence after lentivirus-mediated CRISPR knock-out with sgRPL22. Data are presented as the means ± SEM. n = 3 biological replicates. Two-tailed unpaired Student's ttest was performed. (F, H) SA-β-Gal staining of UV- (F) or H2O2- (H) induced hMPC senescence after lentivirus-mediated CRISPR knock-out with sgRPL22. Scale bar, 100 μm. Data are presented as the means ± SEMs. n = 3 biological replicates. Two-tailed unpaired Student's ttest was performed. (I, K, M) Clonal expansion analysis of aged primary hMPCs (I) after lentivirus-mediated CRISPR knock-out with sgRPL22, hCAECs (K) and hUVECs (M) transduced with lentiviruses expressing Luc or RPL22. Data are presented as the means ± SEMs. n = 3 biological replicates. Two-tailed unpaired Student's ttest was performed. (J, L, N) SA-β-Gal staining of aged primary hMPCs (J) after lentivirus-mediated CRISPR knock-out with sgRPL22, hCAECs (L) and hUVECs (N) transduced with lentiviruses expressing Luc or RPL22. Scale bar, 100 μm. Data are presented as the means ± SEMs. n = 3 biological replicates. Two-tailed unpaired Student's t test was performed.

Similar articles

Cited by

  • RIG-I-driven CDKN1A stabilization reinforces cellular senescence.
    Wang C, Jiang X, Li HY, Hu J, Ji Q, Wang Q, Liu X, Huang D, Yan K, Zhao L, Fan Y, Wang S, Ma S, Belmonte JCI, Qu J, Liu GH, Zhang W. Wang C, et al. Sci China Life Sci. 2025 Jun;68(6):1646-1661. doi: 10.1007/s11427-024-2844-8. Epub 2025 Mar 24. Sci China Life Sci. 2025. PMID: 40133712
  • Gene therapy strategies for aging intervention.
    Jing Y, Ren J, Qu J, Liu GH. Jing Y, et al. Cell Insight. 2025 May 23;4(4):100254. doi: 10.1016/j.cellin.2025.100254. eCollection 2025 Aug. Cell Insight. 2025. PMID: 40677784 Free PMC article. Review.

References

    1. López-Otín C., Blasco M.A., Partridge L., Serrano M., Kroemer G.. The hallmarks of aging. Cell. 2013; 153:1194–1217. - PMC - PubMed
    1. Bao H., Cao J., Chen M., Chen M., Chen W., Chen X., Chen Y., Chen Y., Chen Y., Chen Z.et al. .. Biomarkers of aging. Sci. China Life Sci. 2023; 66:893–1066. - PMC - PubMed
    1. Cai Y., Song W., Li J., Jing Y., Liang C., Zhang L., Zhang X., Zhang W., Liu B., An Y.et al. .. The landscape of aging. Sci. China Life Sci. 2022; 65:2354–2454. - PMC - PubMed
    1. Lu H., Jing Y., Zhang C., Ma S., Zhang W., Huang D., Zhang B., Zuo Y., Qin Y., Liu G.H.et al. .. Aging hallmarks of the primate ovary revealed by spatiotemporal transcriptomics. Protein Cell. 2024; 15:364–384. - PMC - PubMed
    1. Zheng Z., Li J., Liu T., Fan Y., Zhai Q.-C., Xiong M., Wang Q.-R., Sun X., Zheng Q.-W., Che S.et al. .. DNA methylation clocks for estimating biological age in Chinese cohorts. Protein Cell. 2024; 15:575–593. - PMC - PubMed

MeSH terms