. 2024 Dec;11(45):e2404571.
doi: 10.1002/advs.202404571. Epub 2024 Sep 11.

A Novel Engineering Cell Therapy Platform Mimicking the Immune Thrombocytopenia-Derived Platelets to Inhibit Cytokine Storm in Hemophagocytic Lymphohistiocytosis

Affiliations

A Novel Engineering Cell Therapy Platform Mimicking the Immune Thrombocytopenia-Derived Platelets to Inhibit Cytokine Storm in Hemophagocytic Lymphohistiocytosis

Zhenyu Liu et al. Adv Sci (Weinh). 2024 Dec.

Abstract

Hemophagocytic lymphohistiocytosis (HLH) is a common and highly fatal hyperinflammatory syndrome characterized by the aberrant activation of macrophages. To date, there is a lack of targeted therapies for HLH. It is validated that macrophages in HLH efficiently phagocytose anti-CD41-platelets (anti-CD41-PLTs) from immune thrombocytopenia (ITP) patients in previous research. Hence, the pathological mechanisms of ITP are mimicked and anti-CD41-PLTs are utilized to load the macrophage-toxic drug VP16 to construct macrophage-targetable engineered platelets anti-CD41-PLT-VP16, which is a novel targeted therapy against HLH. Both in vitro and in vivo studies demonstrate that anti-CD41-PLT-VP16 has excellent targeting and pro-macrophage apoptotic effects. In HLH model mice, anti-CD41-PLT-VP16 prevents hemophagocytosis and inhibits the cytokine storm. Mechanistic studies reveal that anti-CD41-PLT-VP16 increases the cytotoxicity of VP16, facilitating precise intervention in macrophages. Furthermore, it operates as a strategic "besieger" in diminishing hyperinflammation syndrome, which can indirectly prevent the abnormal activation of T cells and NK cells and reduce the Ab-dependent cell-mediated cytotoxicity effect. The first platelet-based clinical trial is ongoing. The results show that after treatment with anti-CD41-PLT-VP16, HLH patients have a threefold increase in the overall response rate compared to patients receiving conventional chemotherapy. In conclusion, anti-CD41-PLT-VP16 provides a general insight into hyperinflammation syndrome and offers a novel clinical therapeutic strategy for HLH.

Keywords: cytokine storm; etoposide; hemophagocytic lymphohistiocytosis; living therapeutics platform; platelets.


Conflict of interest statement

The authors declare no conflict of interest.

Figures
Scheme 1
Scheme 1
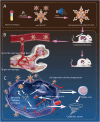
Schematic illustration of the anti‐CD41‐PLT‐VP16 process and relevant therapeutic effect on HLH mice. Anti‐CD41‐PLT‐VP16 blocks phagocytosis reduces cytokine storms, and indirectly inhibits the function of other hyperinflammation‐associated immune cells in the form of “besieger”.
Figure 1
Figure 1
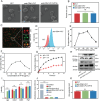
Characterization and properties of anti‐CD41‐PLT‐VP16. A) PLT morphology was assessed by electron microscopy. Bar = 2 µm. B) DLS was used to measure the size of the PLTs in each group. C) CLSM image showing the colocalization of anti‐CD41‐PLT‐VP16 components. (PLT: red, anti‐CD41: green, bar = 20 µm) D) FCM verified the labeling efficiency of anti‐CD41 on PLTs. E) HPLC was used to determine the encapsulation rate of anti‐CD41‐PLT‐VP16 at multiple concentrations. VP16 at 320 µg mL−1 resulted in the optimal encapsulation rate, so this concentration was used for constructing anti‐CD41‐PLT‐VP16 in subsequent experiments. F) HPLC was used to detect the loading rate of multiple concentrations of anti‐CD41‐PLT‐VP16. G) HPLC was used to detect the drug release rate from pharmacophores in different pH environments; pH 7.4 was used to simulate in vivo circulation, and pH 5.5 was used to simulate macrophage lysosomes. Anti‐CD41‐PLT‐VP16 is highly stable in a neutral environment, and the drug release rate can reach 85% at 35 h in an acidic environment. H) WB analysis was utilized to detect platelet function‐related proteins. I) WB detection of characteristic proteins on the surface of platelets from each group. J) The turbidimetric assay was utilized to determine platelet aggregation. The control group was untreated platelet‐rich plasma and PPP was platelet‐poor plasma, which had an absorbance value of 0 in the agglutination assay. The absorbance was measured after the addition of the procoagulant ADP to the remaining four groups, except for the control group, and the addition of the anti‐CD41‐PLT‐VP16 had no effect on platelet agglutination. K) Zeta potentials of the PLT, anti‐CD41‐PLT, and anti‐CD41‐PLT‐VP16 groups. *** < 0.001, ns = not significant.
Figure 2
Figure 2
The effect of anti‐CD41‐PLT‐VP16 on macrophages. A) CLSM observation of phagocytosis of PLT‐VP16 and anti‐CD41‐PLT‐VP16 by macrophages. (PLT: red, DAPI: blue, bar = 10 µm) B) Phagocytosis of PLT‐VP16 and anti‐CD41‐PLT‐VP16 by macrophages was photographed by CLSM after 1, 2, and 4 h of administration. (DAPI: blue, PLT: red, anti‐CD41: green, bar = 10 µm) C) CCK‐8 measurement of macrophage viability in different treatment groups after 12 h of administration. D) WB analysis was used to detect changes in the levels of mitochondrial apoptosis pathway‐related proteins, including Bax, Caspase‐3, and Bcl‐2, in the different treatment groups after 12 h of administration. E) FCM with Annexin V‐FITC/PI was used to detect the apoptosis of macrophages in different treatment groups 12 h after drug administration. F) Cycle detection was performed on macrophages from different treatment groups after 12 h of drug administration, and an increase in (S+G2)/G1 could indicate cycle arrest due to blockage of DNA replication. G) ROS levels were detected in macrophages from each treatment group 12 h after administration and observed by fluorescence microscopy. The green fluorescence intensity indicates the level of ROS in the cells. Bar = 50 µm. ** p < 0.01.
Figure 3
Figure 3
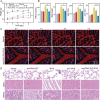
The therapeutic effect of anti‐CD41‐PLT‐VP16 in humanized mice with HLH. A) Treatment schedules for the different groups of the humanized HLH model mice. B) MR images of liver and spleen tissues from mice in different treatment groups before and after treatment (n = 6). The liver and spleen were photographed separately at the same level, and the regions circled by the red dotted line are the liver and spleen tissue. Bar = 5 mm. C) In vivo imaging of small animals showing the circulation and enrichment of anti‐CD41‐PLT‐VP16 in the tail vein over time after the injection of Cy5‐labeled anti‐CD41‐PLT‐VP16 (n = 6). D) Measurement of IL‐1β, IFN‐γ, IL‐6, and TNF‐α levels in the PB after treatment of mice in different treatment groups (n = 6). Dashed lines indicate normal values. E) Quantitative results of F4/80 in liver and spleen tissues determined by IHC after treatment of mice in different treatment groups (n = 6). F) IVM real‐time in vivo imaging of liver, spleen, and BM macrophage activity in different treatment groups of mice 12 h after the corresponding treatments. The blue fluorescence intensity indicates macrophage activity. (Blood: red, cathepsin K probe: blue, n = 6). G) Wright‐Giemsa staining of PB and BM from mice in different treatment groups. Arrows show hemophagy (n = 6). Bar = 50 µm. * p < 0.05, ** p < 0.01, *** p < 0.001.
Figure 4
Figure 4
Detection of the biosafety of anti‐CD41‐PLT‐VP16. A) Changes in the body weight of mice in different treatment groups (n = 6). The weight of the anti‐CD41‐PLT‐VP16 group after treatment converged on that of normal mice before modeling. B) Renal function measurements, including creatinine (CREA) and nitrogen (BUN), in mice in different treatment groups after treatment (n = 6). Liver function measurements, including aspartate aminotransferase (AST) and alanine aminotransferase (ALT) levels, in mice in different treatment groups after treatment (n = 6). C) In vivo real‐time imaging of large blood vessels in mice at 0, 1, 2, and 4 h after tail vein injection of anti‐CD41‐PLT‐VP16 (blood: red, cathepsin K probe: blue, n = 3, bar = 100 µm). D) H&E staining of mouse lung, heart, and kidney tissues in different treatment groups (n = 6). Bar = 50 µm. * p < 0.05, *** < 0.001.
Figure 5
Figure 5
Mechanism of inhibition of inflammation‐associated cytokine storm by anti‐CD41‐PLT‐VP16. A) Schematic illustration of the in vivo process in which anti‐CD41‐PLT‐VP16 prevents antigen presentation by occupying the Fc receptor on the surface of macrophages in HLH through ADCP; after being phagocytosed by macrophages, anti‐CD41‐PLT‐VP16 can induce the apoptosis of macrophages and inhibit cytokine release. B) Volcano plots show the upregulation and decrease in gene expression. The expression of some of the genes associated with Ras/MAPK, inflammation, and FcγR‐mediated phagocytosis are labeled in the figures (n = 3). C) Heatmap showing the expression of cytokine‐related genes in each group (n = 3, p < 0.05). D) KEGG enrichment analysis comparing the anti‐CD41‐PLT‐VP16 group with the VP16 group. Bubble plots showing the pathways in which differentially expressed proteins were concentrated (p < 0.05). E) Differentially expressed genes in the anti‐CD41‐PLT‐VP16 group versus the control group were analyzed by PPI (p < 0.05). F) Quantitative real‐time PCR (qPCR) was performed on the control, VP16, and anti‐CD41‐PLT‐VP16 groups, and the graph shows the expression levels of genes involved in the Ras‐MAPK pathway in each group. G) qPCR results showing the expression levels of genes involved in the FcγR‐mediated phagocytosis pathway. * p < 0.05, ** p < 0.01, *** p < 0.001.
Figure 6
Figure 6
Schematic diagram of the preliminary clinical trial. The control group was normally treated patients, and VP16 at the time of treatment was replaced with anti‐CD41‐PLT‐VP16 in equal final concentration in the trial group. A significantly higher disease remission rate was found in the anti‐CD41‐PLT‐VP16 group. “ORR” = Objective response rate; “NR” = No response.

Similar articles

References

    1. Canna S. W., Marsh R. A., Blood 2020, 135, 1332. - PMC - PubMed
    1. Jordan M. B., Allen C. E., Weitzman S., Filipovich A. H., McClain K. L., Blood 2011, 118, 4041. - PMC - PubMed
    1. Hayden A., Park S., Giustini D., Lee A. Y. Y., Chen L. Y. C., Blood Rev. 2016, 30, 411. - PubMed
    1. Chinnici A., Beneforti L., Pegoraro F., Trambusti I., Tondo A., Favre C., Coniglio M. L., Sieni E., Front. Immunol. 2023, 14, 1210041. - PMC - PubMed
    1. Tang L. V., Hu Y., J. Hematol. Oncol. 2021, 14, 87. - PMC - PubMed

MeSH terms

LinkOut - more resources