. 2024 Sep 11:13:RP98818.
doi: 10.7554/eLife.98818.

Developmental stage shapes the realized energy landscape for a flight specialist

Affiliations

Developmental stage shapes the realized energy landscape for a flight specialist

Elham Nourani et al. Elife. .

Abstract

The heterogeneity of the physical environment determines the cost of transport for animals, shaping their energy landscape. Animals respond to this energy landscape by adjusting their distribution and movement to maximize gains and reduce costs. Much of our knowledge about energy landscape dynamics focuses on factors external to the animal, particularly the spatio-temporal variations of the environment. However, an animal's internal state can significantly impact its ability to perceive and utilize available energy, creating a distinction between the 'fundamental' and the 'realized' energy landscapes. Here, we show that the realized energy landscape varies along the ontogenetic axis. Locomotor and cognitive capabilities of individuals change over time, especially during the early life stages. We investigate the development of the realized energy landscape in the Central European Alpine population of the golden eagle Aquila chrysaetos, a large predator that requires negotiating the atmospheric environment to achieve energy-efficient soaring flight. We quantified weekly energy landscapes using environmental features for 55 juvenile golden eagles, demonstrating that energetic costs of traversing the landscape decreased with age. Consequently, the potentially flyable area within the Alpine region increased 2170-fold during their first three years of independence. Our work contributes to a predictive understanding of animal movement by presenting ontogeny as a mechanism shaping the realized energy landscape.

Keywords: behavioral development; bio-logging; cost of transport; dispersal; ecology; golden eagle (aquila chrysaetos); ontogeny; soaring flight.


Conflict of interest statement

EN, LF, HB, MS, EB, WF, MG, JH, DJ, AR, PS, MT, MW, KS No competing interests declared

Figures

Figure 1.
Figure 1.. Coefficient estimates of the step selection function predicting the probability of use as a function of uplift proxies, week since emigration, and step length.
All variables were z-transformed prior to modeling. The error bars show 95% confidence intervals.
Figure 1—figure supplement 1.
Figure 1—figure supplement 1.. Individual-specific slopes for Topographic Ruggedness Index (TRI) and distance to ridge line.
The error bars show 95% confidence intervals. The difference between each individual’s estimate from the fixed effect estimate (Figure 1) is shown. Individuals are ordered based on their distance to ridge line estimates.
Figure 2.
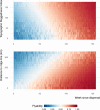
Figure 2.. Flyability index predicted using the step-selection model for combinations of topography and week since emigration values.
The interactions between Topographic Ruggedness Index (TRI) and distance to ridge lines with week are among the set of criteria that young eagles used for selecting where to fly during their commuting flights.
Figure 3.
Figure 3.. Hotspots of energy availability for golden eagles’ flight in the Alps.
Flyable areas were defined as cells within a 100 * 100 m grid with predicted flyability above 0.7 based on our step-selection model. The maps show the 2D kernel density estimation of flyable areas for golden eagles at different timestamps since dispersal: week 1, week 4 (1 month), week 24 (6 months), and week 52 (1 year). The raw prediction maps for every week since dispersal are shown in Video 1.
Figure 4.
Figure 4.. The flyable area for juvenile golden eagles in the Alpine region from the first week until 3 years after emigration.
Flyable area was defined as the total number of cells within a 100 * 100 m grid with predicted flyability larger than 0.7 based on the step-selection model. The positive trend shows that juvenile golden eagles can fly over a larger portion of the Alpine region as they age.
Figure 4—figure supplement 1.
Figure 4—figure supplement 1.. Cumulative area used by juvenile golden eagles during each week after emigration.
Used areas were calculated by extracting the commuting flights for each week, converting these to line objects, overlapping the lines with a raster of 100 * 100 km cell size, counting the number of overlapping cells and calculating the area that they covered. The predicted flyable area for juvenile golden eagles in the Alpine region for the same period of time is shown in Figure 4.
Author response image 1.
Author response image 1.. First passage times using a 50 km radius for two randomly selected individuals.
Author response image 2.
Author response image 2.. Golden eagle tracking points were either retained (used) or discarded (not used) for further data analysis based on the EmbC algorithm.
The point were clustered based on ground speed and height above ground.
Author response image 3.
Author response image 3.. Moulting schedule of golden eagles [12].

Update of

References

    1. Abrahms B, Hazen EL, Aikens EO, Savoca MS, Goldbogen JA, Bograd SJ, Jacox MG, Irvine LM, Palacios DM, Mate BR. Memory and resource tracking drive blue whale migrations. PNAS. 2019;116:5582–5587. doi: 10.1073/pnas.1819031116. - DOI - PMC - PubMed
    1. Abrahms B, Teitelbaum CS, Mueller T, Converse SJ. Ontogenetic shifts from social to experiential learning drive avian migration timing. Nature Communications. 2021;12:7326. doi: 10.1038/s41467-021-27626-5. - DOI - PMC - PubMed
    1. Avgar T, Potts JR, Lewis MA, Boyce MS. Integrated step selection analysis: Bridging the gap between resource selection and animal movement. Methods in Ecology and Evolution. 2016;7:619–630. doi: 10.1111/2041-210X.12528. - DOI
    1. Berti E, Rosenbaum B, Brose U, Vollrath F. Energy landscapes direct the movement preferences of elephants. Authorea. 2023;01:e39/v1. doi: 10.22541/au.168373276.62196439/v1. - DOI
    1. Binning SA, Shaw AK, Roche DG. Parasites and host performance: Incorporating infection into our understanding of animal movement. Integrative and Comparative Biology. 2017;57:267–280. doi: 10.1093/icb/icx024. - DOI - PubMed

LinkOut - more resources