. 2024 Nov;115(11):3622-3635.
doi: 10.1111/cas.16302. Epub 2024 Sep 11.

Identification of TPI1 As a potential therapeutic target in pancreatic cancer with dependency of TP53 mutation using multi-omics analysis

Affiliations

Identification of TPI1 As a potential therapeutic target in pancreatic cancer with dependency of TP53 mutation using multi-omics analysis

Tomoaki Toyoda et al. Cancer Sci. 2024 Nov.

Abstract

Mutations of KRAS, CDKN2A, TP53, and SMAD4 are the four major driver genes for pancreatic ductal adenocarcinoma (PDAC), of which mutations of KRAS and TP53 are the most frequently recognized. However, molecular-targeted therapies for mutations of KRAS and TP53 have not yet been developed. To identify novel molecular targets, we newly established organoids with the Kras mutation (KrasmuOR) and Trp53 loss of function using Cre transduction and CRISPR/Cas9 (Krasmu/p53muOR) from murine epithelia of the pancreatic duct in KrasLSL-G12D mice, and then analyzed the proteomic and metabolomic profiles in both organoids by mass spectrometry. Hyperfunction of the glycolysis pathway was recognized in Krasmu/p53muOR compared with KrasmuOR. Loss of function of triosephosphate isomerase (TPI1), which is involved in glycolysis, induced a reduction of cell proliferation in human PDAC cell lines with the TP53 mutation, but not in PDAC or in human fibroblasts without TP53 mutation. The TP53 mutation is clinically recognized in 70% of patients with PDAC. In the present study, protein expression of TPI1 and nuclear accumulation of p53 were recognized in the same patients with PDAC. TPI1 is a potential candidate therapeutic target for PDAC with the TP53 mutation.

Keywords: multi‐omics; organoid; p53; pancreatic cancer; triosephosphate isomerase 1 (TPI1).


Conflict of interest statement

Honda, Kazufumi is an editorial board member of Cancer Science. The other authors have no conflict of interest.

Figures
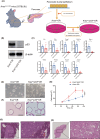
FIGURE 1
FIGURE 1
Establishment of organoids containing the Kras mutation and Trp53 mutation from murine pancreatic ductal cells. (A) Schematic view of the experimental design. (B) Western blot analyses of p53 protein in Kras muOR and Kras mu/p53 muOR. (C) Expression profiles of genes downregulated by p53 in Kras muOR and Kras mu/p53 muOR. *p < 0.05, **p < 0.01, and ***p < 0.001 (Student's t‐test). Error bars indicate standard deviation (SD). (D) Morphology of Kras muOR and Kras mu/p53 muOR; scale bars 250 μm. (E) Proliferation rate in organoid culture. The mean cell count of six wells ± standard deviation (SD) is shown. **p < 0.01 (Mann–Whitney U‐test). (F) Photomicrograph of thin sections of cell blocks in Kras muOR and Kras mu/p53 muOR with hematoxylin and eosin staining. Scale bars 100 μm. (G) Pathological photographs of orthotopic transplantation of Kras mu/p53 muOR with hematoxylin and eosin staining; scale bars 1 mm (left panel), and 500 μm (right panel). (H) Pathology images of subcutaneous transplantation of Kras mu/p53 muOR with hematoxylin and eosin staining; scale bars 1 mm (left panel), and 500 μm (right panel).
FIGURE 2
FIGURE 2
Multi‐omics analyses of Kras muOR and Kras mu/p53 muOR, and candidate targetable molecules for pancreatic cancer cells with the TP53 mutation by pathway analysis of proteomic and metabolomic profiles. (A, B) Volcano plots of changed proteins and metabolites. (C) Proteins that showed a tendency to increase in the proteome were extracted from the pathways that showed significant fluctuation in multi‐omics analysis of five candidate enzymes. Mean values of a minimum of three biological replicates are shown. Error bars represent SD. *p < 0.05, **p < 0.01, and ***p < 0.001 (Student's t‐test). Blue bars indicate Kras muOR, red bars indicate Kras mu/p53 muOR.
FIGURE 3
FIGURE 3
Identification of therapeutic targets from six candidate molecules using the siRNA technique, and protein expressions of several molecules involved in glycolysis in human pancreatic cancer cell lines. (A) Candidate proteins were knocked down by siRNA transfection, and changes in cell proliferation of human pancreatic cancer cell lines were confirmed by measuring ATP. Only TPI1 shows a significant decrease in cell proliferation upon knockdown in multiple pancreatic cancer cell lines. n = 6 biological replicates. Error bars indicate SD. *p < 0.05, **p < 0.01, ***p < 0.001, and ****p < 0.0001 (one‐way ANOVA Dunnett's test). Asterisks indicate significant reductions compared with siRNA controls. (B) Western blots showing proteins from TPI1 knockdown and control siRNA human pancreatic cancer cell lines. The reducing ratio of protein expression with siRNAs compared with control siRNA is shown under the western blot photographs. (C) Western blots showing glycolysis‐related proteins in human pancreatic cancer cell lines.
FIGURE 4
FIGURE 4
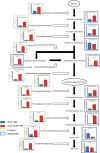
Mapping of proteomic and metabolomic profiles in Kras muOR and Kras mu/p53 muOR. Box blots; blue boxes Kras muOR, red boxes Kras muOR/p53 muOR. Green outlines; proteomic profile, blue outline; metabolomic profile. *p < 0.05, **p < 0.01 and ****p < 0.0001 (Student's t‐test).
FIGURE 5
FIGURE 5
Inhibition of cell proliferation with siRNAs of TPI1. (A) Measurements were taken every 24 h during the proliferation assay using ATP‐independent intracellular reducing power in human pancreatic cancer with the TP53 mutation. (B) Measurements were taken every 12 h during the proliferation assay using ATP‐independent intracellular reducing power in human pancreatic cancer cell lines without TP53 mutation. Western blot analyses of TPI1 confirm the reduction of protein expression of TPI1 in knockdown cell lines. (A) and (B), n = 6 biological replicates. Error bars indicate SD. *p < 0.05, **p < 0.01, ***p < 0.001, and ****p < 0.0001 (one‐way ANOVA Dunnett's test). The reducing ratio of protein expression with siRNAs compared with control siRNA is shown under the western blot photographs.
FIGURE 6
FIGURE 6
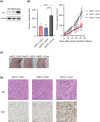
Subcutaneous murine inoculation model with knockdown human pancreatic cancer cell lines with the TP53 mutation of TPI1 by shRNA. (A) Western blots showing proteins from TPI1 knockdown and control shRNA AsPC‐1 s. (B) Growth curves of subcutaneous tumors derived from AsPC‐1‐KD1 and AsPC‐1‐KD2, and AsPC‐1‐Cont cells in nude mice (n = 10 or 11). Mean final tumor diameters are shown. Error bars represent SD. ****p < 0.0001 (one‐way ANOVA Dunnett's test). (C) Image showing mouse tumor size. (D) A significant reduction of protein expression of TPI in TPI1‐knocked‐down AsPC‐1 s is observed compared with AsPC‐1 control cells. Bars represent 100 μm.
FIGURE 7
FIGURE 7
Immunohistochemical evaluation of protein expression of TPI1 and nuclear accumulation of p53 in pathological samples of patients with pancreatic cancer. Expression of p53 and TPI1 is confirmed in clinical specimens using serial sections. Expression of p53 and TPI1 is observed at the same site. (A, E): 500 μm (B, D, F, H): 100 μm (C, G): 250 μm.

References

    1. Kamisawa T, Wood LD, Itoi T, Takaori K. Pancreatic cancer. Lancet. 2016;388:73‐85. - PubMed
    1. Dagher OK, Schwab RD, Brookens SK, Posey AD Jr. Advances in cancer immunotherapies. Cell. 2023;186(8): P1814‐1814.e1. - PubMed
    1. Springfeld C, Jäger D, Büchler MW, et al. Chemotherapy for pancreatic cancer. Presse Med. 2019;48:E159‐E174. - PubMed
    1. Di Federico A, Mosca M, Pagani R, et al. Immunotherapy in pancreatic cancer: why do we keep failing? A focus on tumor immune microenvironment, predictive biomarkers and treatment outcomes. Cancers (Basel). 2022;14:2429. - PMC - PubMed
    1. Cheng DT, Mitchell TN, Zehir A, et al. Memorial Sloan Kettering‐integrated mutation profiling of actionable cancer targets (MSK‐IMPACT): a hybridization capture‐based next‐generation sequencing clinical assay for solid tumor molecular oncology. J Mol Diagn. 2015;17:251‐264. - PMC - PubMed

MeSH terms

Substances