. 2024 Sep 11;20(9):e1011093.
doi: 10.1371/journal.pgen.1011093. eCollection 2024 Sep.

Direct targets of MEF2C are enriched for genes associated with schizophrenia and cognitive function and are involved in neuron development and mitochondrial function

Affiliations

Direct targets of MEF2C are enriched for genes associated with schizophrenia and cognitive function and are involved in neuron development and mitochondrial function

Deema Ali et al. PLoS Genet. .

Abstract

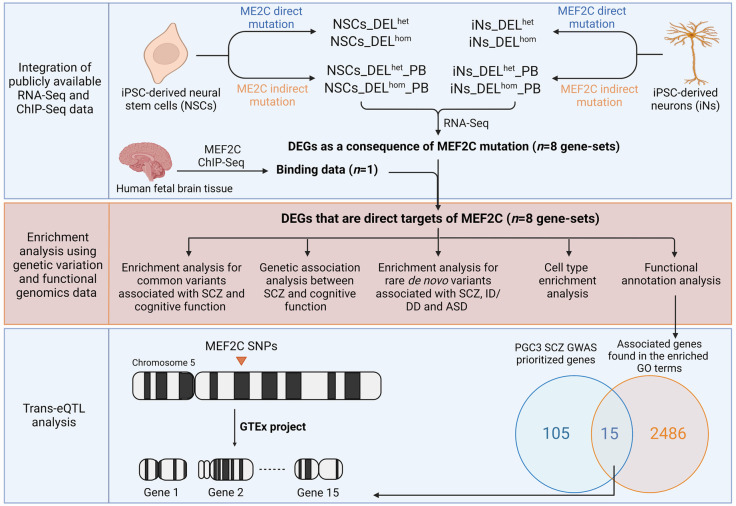
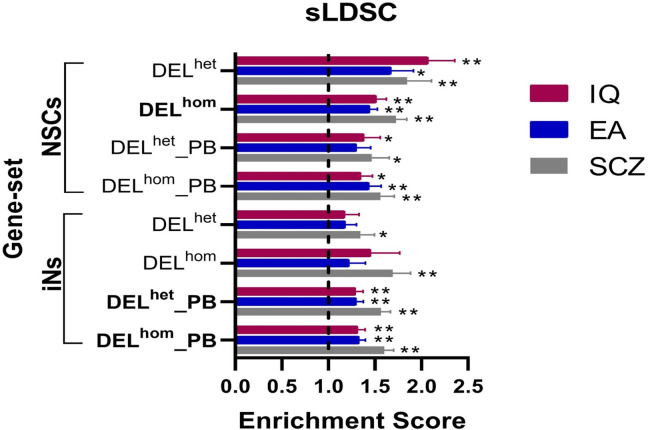
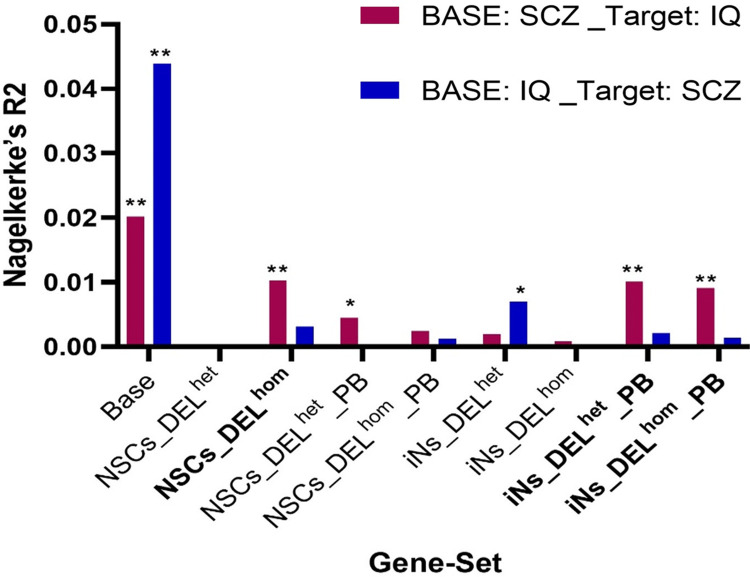
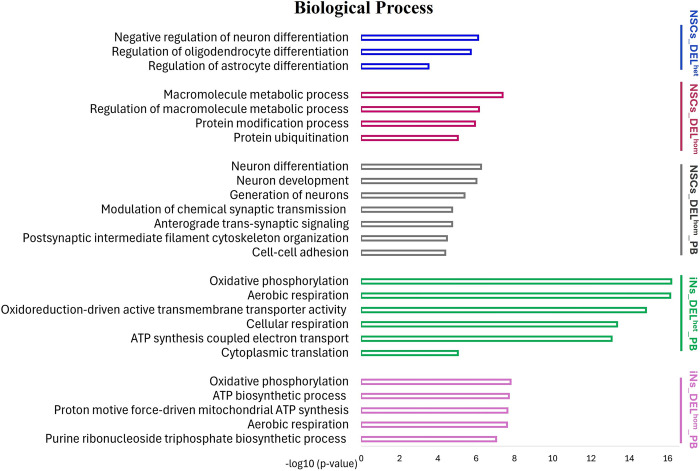
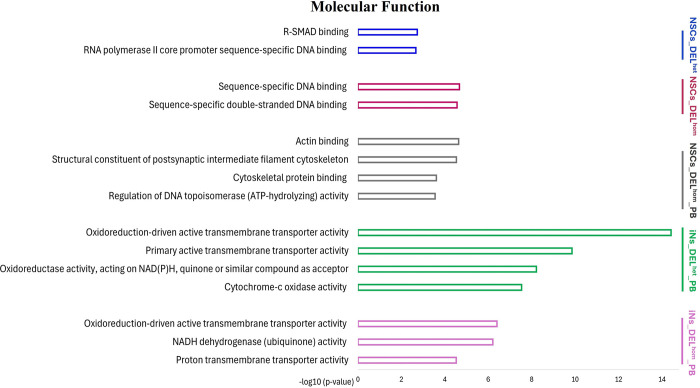
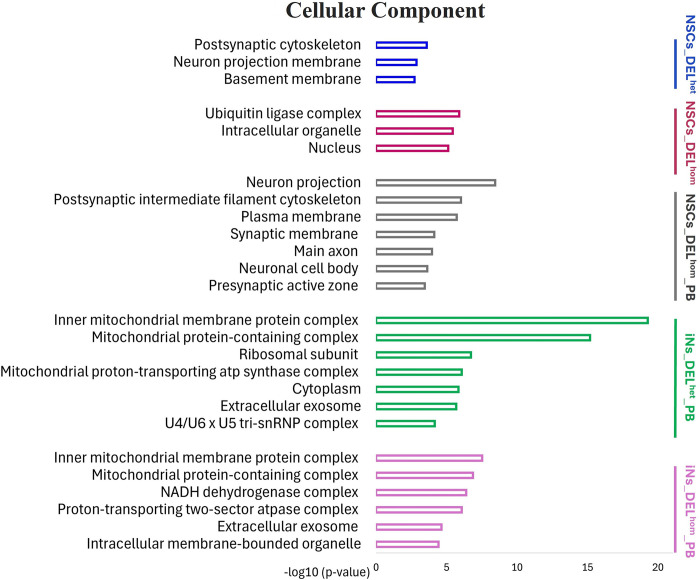
Myocyte Enhancer Factor 2C (MEF2C) is a transcription factor that plays a crucial role in neurogenesis and synapse development. Genetic studies have identified MEF2C as a gene that influences cognition and risk for neuropsychiatric disorders, including autism spectrum disorder (ASD) and schizophrenia (SCZ). Here, we investigated the involvement of MEF2C in these phenotypes using human-derived neural stem cells (NSCs) and glutamatergic induced neurons (iNs), which represented early and late neurodevelopmental stages. For these cellular models, MEF2C function had previously been disrupted, either by direct or indirect mutation, and gene expression assayed using RNA-seq. We integrated these RNA-seq data with MEF2C ChIP-seq data to identify dysregulated direct target genes of MEF2C in the NSCs and iNs models. Several MEF2C direct target gene-sets were enriched for SNP-based heritability for intelligence, educational attainment and SCZ, as well as being enriched for genes containing rare de novo mutations reported in ASD and/or developmental disorders. These gene-sets are enriched in both excitatory and inhibitory neurons in the prenatal and adult brain and are involved in a wide range of biological processes including neuron generation, differentiation and development, as well as mitochondrial function and energy production. We observed a trans expression quantitative trait locus (eQTL) effect of a single SNP at MEF2C (rs6893807, which is associated with IQ) on the expression of a target gene, BNIP3L. BNIP3L is a prioritized risk gene from the largest genome-wide association study of SCZ and has a function in mitophagy in mitochondria. Overall, our analysis reveals that either direct or indirect disruption of MEF2C dysregulates sets of genes that contain multiple alleles associated with SCZ risk and cognitive function and implicates neuron development and mitochondrial function in the etiology of these phenotypes.


Conflict of interest statement

The authors have declared that no competing interests exist.

Figures

Fig 1
Fig 1. Schematic representation illustrating the stepwise methodology employed in this study.
DELhom: Homozygous deletion; DELhet: Heterozygous deletion; PB: Proximal boundary (indirect mutation of MEF2C); DEGs: Differentially expressed genes; SCZ: Schizophrenia; ID: Intellectual disability; DD: Developmental delay; ASD: Autism spectrum disorder; GO: Gene ontology; PGC: Psychiatric Genomics Consortium; GWAS: Genome-wide association study; SNPs: Single nucleotide polymorphisms; eQTL: Expression quantitative trait loci; GTEx: Genotype-Tissue Expression. Figure created with BioRender.com.
Fig 2
Fig 2. Results from sLDSC analysis of MEF2C direct target gene-sets using GWAS data.
The graph plots the enrichment values, defined as the ratio of heritability (h2) to the number SNPs, on the x-axis. The error bars represent the standard errors. Two asterisks (**) indicate significance after Bonferroni correction, and one asterisk (*) indicates nominal significance. Gene-sets enriched for the three phenotypes are highlighted in bold. NSCs: Neural stem cells; iNs: induced neurons; DELhom: Homozygous deletion; DELhet: Heterozygous deletion; PB: Proximal Boundary.
Fig 3
Fig 3. Gene-set based PRS analysis to examine associations between the SCZ-PRS and IQ, and between the IQ-PRS and SCZ.
Base on the x-axis refers to a PRS generated using all variants in the genome. The height of the columns on the y-axis indicates the proportion of variance in the phenotype explained when a gene-set based PRS is constructed using SCZ GWAS data and is tested against IQ (pink columns) or when a gene-set based PRS is constructed using IQ GWAS data and is tested against SCZ case-control status (blue columns). Two asterisks (**) indicate significance after Bonferroni correction, and one asterisk (*) indicates nominal significance. NSCs: Neural stem cells; iNs: induced neurons; DELhom: Homozygous deletion; DELhet: Heterozygous deletion; PB: Proximal Boundary.
Fig 4
Fig 4. Bar charts of gene ontology (GO) analysis of biological process for MEF2C direct target gene-sets using the ClueGo plugins of Cytoscape.
The Bonferroni method was applied for a p-value correlation (p < 0.05). The vertical axis displays the names of the GO terms. The horizontal axis and bar lengths represent the significance [−log10 (p-value)]. Colors in the bars represent different MEF2C direct target gene-sets. Results are presented only for the five gene-sets that were previously enriched for common variation associated with SCZ, IQ and/or EA. Enriched terms that were related to each other in the ontology were grouped together, with the most significant term(s)/group displayed. All data is detailed in S16–S23 Tables. NSCs: Neural stem cells; iNs: induced neurons; DELhom: Homozygous deletion; DELhet: Heterozygous deletion; PB: Proximal Boundary.
Fig 5
Fig 5. Bar charts of gene ontology (GO) analysis of molecular function for MEF2C direct target gene-sets using the ClueGo plugins of Cytoscape.
The Bonferroni method was applied for a p-value correlation (p < 0.05). The vertical axis displays the names of the GO terms. The horizontal axis and bar lengths represent the significance [−log10 (p-value)]. Colors in the bars represent different MEF2C direct target gene-sets. Results are presented only for the five gene-sets that were previously enriched for common variation associated with SCZ, IQ and/or EA. Enriched terms that were related to each other in the ontology were grouped together, with the most significant term(s)/group displayed. All data is detailed in S16–S23 Tables. NSCs: Neural stem cells; iNs: induced neurons; DELhom: Homozygous deletion; DELhet: Heterozygous deletion; PB: Proximal Boundary.
Fig 6
Fig 6. Bar charts of gene ontology (GO) analysis of cellular component for MEF2C direct target gene-sets using the ClueGo plugins of Cytoscape.
The Bonferroni method was applied for a p-value correlation (p < 0.05). The vertical axis displays the names of the GO terms. The horizontal axis and bar lengths represent the significance [−log10 (p-value)]. Colors in the bars represent different MEF2C direct target gene-sets. Results are presented only for the five gene-sets that were previously enriched for common variation associated with SCZ, IQ and/or EA. Enriched terms that were related to each other in the ontology were grouped together, with the most significant term(s)/group displayed. All data is detailed in S16–S23 Tables. NSCs: Neural stem cells; iNs: induced neurons; DELhom: Homozygous deletion; DELhet: Heterozygous deletion; PB: Proximal Boundary.

Similar articles

References

    1. Leifer D, Golden J, Kowall NW: Myocyte-specific enhancer binding factor 2C expression in human brain development. Neuroscience 1994, 63:1067–1079. doi: 10.1016/0306-4522(94)90573-8 - DOI - PubMed
    1. Lyons GE, Micales BK, Schwarz J, Martin JF, Olson EN: Expression of mef2 genes in the mouse central nervous system suggests a role in neuronal maturation. J Neurosci 1995, 15:5727–5738. doi: 10.1523/JNEUROSCI.15-08-05727.1995 - DOI - PMC - PubMed
    1. Li H, Radford JC, Ragusa MJ, Shea KL, McKercher SR, Zaremba JD, Soussou W, Nie Z, Kang Y-J, Nakanishi N, et al..: Transcription factor MEF2C influences neural stem/progenitor cell differentiation and maturation in vivo. Proceedings of the National Academy of Sciences 2008, 105:9397–9402. doi: 10.1073/pnas.0802876105 - DOI - PMC - PubMed
    1. UniProt Consortium: UniProt: a hub for protein information. Nucleic Acids Res 2015, 43:D204–212. - PMC - PubMed
    1. Potthoff MJ, Olson EN: MEF2: a central regulator of diverse developmental programs. Development 2007, 134:4131–4140. doi: 10.1242/dev.008367 - DOI - PubMed

Substances

LinkOut - more resources