. 2024 Sep 11;20(9):e1012537.
doi: 10.1371/journal.ppat.1012537. eCollection 2024 Sep.

Elasticity of the HIV-1 core facilitates nuclear entry and infection

Affiliations

Elasticity of the HIV-1 core facilitates nuclear entry and infection

Akshay Deshpande et al. PLoS Pathog. .

Abstract

HIV-1 infection requires passage of the viral core through the nuclear pore of the cell, a process that depends on functions of the viral capsid. Recent studies have shown that HIV-1 cores enter the nucleus prior to capsid disassembly. Interactions of the viral capsid with the nuclear pore complex are necessary but not sufficient for nuclear entry, and the mechanism by which the viral core traverses the comparably sized nuclear pore is unknown. Here we show that the HIV-1 core is highly elastic and that this property is linked to nuclear entry and infectivity. Using atomic force microscopy-based approaches, we found that purified wild type cores rapidly returned to their normal conical morphology following a severe compression. Results from independently performed molecular dynamic simulations of the mature HIV-1 capsid also revealed its elastic property. Analysis of four HIV-1 capsid mutants that exhibit impaired nuclear entry revealed that the mutant viral cores are brittle. Adaptation of two of the mutant viruses in cell culture resulted in additional substitutions that restored elasticity and rescued infectivity and nuclear entry. We also show that capsid-targeting compound PF74 and the antiviral drug Lenacapavir reduce core elasticity and block HIV-1 nuclear entry at concentrations that preserve interactions between the viral core and the nuclear envelope. Our results indicate that elasticity is a fundamental property of the HIV-1 core that enables nuclear entry, thereby facilitating infection. These results provide new insights into the role of the capsid in HIV-1 nuclear entry and the antiviral mechanisms of HIV-1 capsid inhibitors.


Conflict of interest statement

The authors have declared that no competing interests exist.

Figures
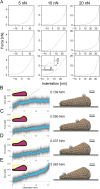
Fig 1
Fig 1. Experimental and simulated AFM nanoindentation of wild type IP6-treated cores.
(A) Representative force–distance (FD) curves where force loading curves are shown. The maximal loading force was set to 5 nN (n = 23), 10 nN (n = 24), and 20 nN (n = 25). Despite the application of high maximal loading forces, none of the curves exhibited any indication of structural failure in the core. In one core (of the 72 examined), we observed an abrupt drop in the loading curve (inset). (B-E) Simulated FD curves for nanoindentation of coarse-grained HIV-1 capsids, testing the effect of probe location, ultimately capsid curvature, on measured material properties. The plots show raw data in gray, and a windowed-average in blue. The inset volume cross-sections show the deformed capsid morphologies and provide a sense of global deformation. The solid black line shows a linear fit of the FD curve for the first 3 nm of indentation, which was used to derive the stiffness values given to the right of each plot. Additionally, snapshots from these nanoindentation simulations are provided on the right, with all components visualized: spherical AFM probes, capsids, and baseplates. (B) Probe located at the large end of the conical capsid. Note the global deformation, narrowing, of the cone in the inset graphic. (C) and (D) show probe locations in the relatively flat, mid-regions of the capsid. (E) Shows nanoindentation of the narrow, most highly curved region of the capsid.
Fig 2
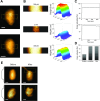
Fig 2. Volume recovery of the HIV core following compression.
(A) Topographic AFM images of an isolated IP6-treated WT core before (upper image) and after (lower image) extreme compression. Both images were acquired using the QI mode at a maximal loading force of 300 pN. Subsequent measurements focused on a selected central region, as marked by a dashed yellow rectangle. It should be noted that the length of the core appears to be larger than expected due to convolution between the AFM tip and the core. Scale bars are 50 nm. (B) Representative topographic AFM images (left panels) and the corresponding Matlab plots (right panels) for the selected central region of an isolated IP6-treated WT core before (top), during (middle), and immediately after (bottom) compression by a 5 nN loading force (the before and after image were acquired at 300 pN maximal loading force). The same region was repeatedly scanned and imaged over time in QI mode at maximal loading force of 300 pN. The reduced height during imaging at 5 nN is higher than the observed indentation at the same force (as shown in Fig 1) is the result of the different AFM modes used to acquired the data. In the imaging mode, a few dozen of FD curves are rapidly applied to the region whereas Fig 1 shows a single FD curve. (C) Two representative volume recovery trajectories (of the 36 trajectories obtained). The volume beneath the selected region was calculated using MatLab and plotted as a function of time. The initial volume was set as 100%, and all other measurements were normalized accordingly. The upper curve shows nearly full volume recovery, whereas the lower curve shows 80% recovery, which was the minimum volume recovery percentage we detected. (D) The average volume recovery of the 36 analyzed cores. The average compressed volume was 39% (pressed). The average volume upon reducing the force back to 300 pN was 92% (immediate). Several minutes (5–7 min) later, the recovery volume remained unchanged at 92% (late). T-test analysis revealed that the difference between the compressed and immediate or late recovered volume is significant (p value <0.0001). Error bars represent the standard error of the mean. (E) Topographic AFM images of two representative WT cores before and after compression. Images were acquired using the QI mode operated at a 300 pN loading force. Typical cone-shaped cores are observed. A cross-section height profile along the length of the core is displayed. After compression, most cores (~86%) remained intact. However, those that broke exhibited an opening at the end of the core, distal from the compressed region. For clarity, openings in the cores are shown within a dashed yellow rectangle. Scale bars are 50 nm.
Fig 3
Fig 3. DNA synthesis, nuclear entry, infectivity and core brittleness of isolated HIV-1 cores.
(A) Relative single-cycle infectivity of wild type and CA mutant viruses. (B) Nuclear entry efficiency of CA mutants relative to WT HIV-1. Values represent the ratio of 2-LTR circle levels to late reverse transcripts. (C) Ratio of infection of control Hela cells vs. aphidicolin-treated cells by WT and mutant viruses. (D) Relative levels of late reverse transcripts in target cells. (E) Fold reduction of infection in Nup153-depleted cells vs. control cells. For B-E, values shown are the mean of three independent experiments, with error bars representing the standard error of the mean. Error bars in all panels represent the standard error of the mean. (F) The percentage of broken wild-type (WT) and mutant cores. Cores were examined in the presence of IP6 (100 μM). WT cores were also treated with the capsid-inhibiting antiviral drugs PF74 (1.25 μM) or Lenacapavir (LCV; 500 pM). The number of cores analyzed is indicated inside each bar. Core breakage was determined by AFM imaging of the cores after they were compressed by a loading force of 5 nN applied during imaging of the middle section of the capsid (as in Fig 2). Error bars represent standard error of the mean. The error of the mean in (F) was obtain by running a bootstrap analysis. Representative AFM images of intact and broken cores following compression are shown in S12 Fig.
Fig 4
Fig 4
A scatter plot showing an inverse correlation between HIV-1 core elasticity, determined by the presence of broken cores following compression and (A) nuclear entry index and (B) relative infectivity. The core stiffness plotted as a function of (C) nuclear entry index and (D) relative infectivity, revealing no-correlation between these properties. The solid line represents the linear fit of the data.
Fig 5
Fig 5. Brittle HIV cores reach the nuclear membrane, but only elastic cores enter the nucleus.
(A) Representative time-series images showing interactions between the HIV-1 core (cyan, puncta) and the nuclear lamina (magenta). The segments of stable interaction are marked by dashed circles, time stamps (hh:mm:ss), and location cytoplasm (C) and nucleus (N) are overlayed in images. (B) The cumulative frequency plot shows all stable HIV-1 docking interactions at the nuclear lamina. The fraction of cores interacting for longer than 10 min is overlayed on the heat-map. (C) single z-stack images and (D) quantification of HIV-1 INmNG puncta nuclear entry in TZM-bl cells at 8 hours post-infection. Pairwise student T-test was performed, p-values <0.0001 was considered highly significant ***, and values >0.05 was considered not-significant (ns). Stats in blue is vs. WT and in Red is vs. in-elastic counterparts. Note images in (A), (C) are single z-stacks and quantification in (D) is from the entire nucleus volume from >100 nuclei for independent CA mutants. Scale in (A) is 1 μm, and in (C) is 5 μm.
Fig 6
Fig 6. Low concentrations of PF74 and LCV block HIV nuclear import.
(A) Representative time-series images showing PF74 (1.25 μM) and LCV (0.5nM) treated HIV-1 core (cyan, puncta) interactions with the nuclear lamina (magenta). The segments of stable interaction (dashed circles), time stamps (hh:mm:ss), and location cytoplasm (C) and nucleus (N) are overlayed in images. (B) The cumulative frequency plot shows all stable HIV-1 docking interactions at the nuclear lamina for PF74 and LCV treatment. The fraction of cores interacting for longer than 10 min is overlayed on the heat-map. For clarity, bald endosomal core interactions (from Fig 5B) is included here. (C) single z-stack images and (D) quantification of HIV-1 INmNG puncta nuclear entry at 8 hours post-infection. Pairwise student T-test was performed, p-values <0.0001 was considered highly significant ***, and values >0.05 was considered not-significant (ns). Note images in (A), (C) are single z-stacks, and quantification in (D) is from the entire nucleus volume from >100 nuclei for independent CA mutants. Scale bar in (A) is 1 μm, and in (C) is 5 μm.

Update of

Similar articles

Cited by

References

    1. Achuthan V, Perreira JM, Sowd GA, Puray-Chavez M, McDougall WM, Paulucci-Holthauzen A, et al.. Capsid-CPSF6 Interaction Licenses Nuclear HIV-1 Trafficking to Sites of Viral DNA Integration. Cell Host Microbe. 2018;24(3):392–404 e8. doi: 10.1016/j.chom.2018.08.002 - DOI - PMC - PubMed
    1. Bejarano DA, Peng K, Laketa V, Borner K, Jost KL, Lucic B, et al.. HIV-1 nuclear import in macrophages is regulated by CPSF6-capsid interactions at the nuclear pore complex. Elife. 2019;8. doi: 10.7554/eLife.41800 - DOI - PMC - PubMed
    1. Burdick RC, Delviks-Frankenberry KA, Chen J, Janaka SK, Sastri J, Hu WS, et al.. Dynamics and regulation of nuclear import and nuclear movements of HIV-1 complexes. PLoS Pathog. 2017;13(8):e1006570. doi: 10.1371/journal.ppat.1006570 - DOI - PMC - PubMed
    1. Di Nunzio F, Danckaert A, Fricke T, Perez P, Fernandez J, Perret E, et al.. Human nucleoporins promote HIV-1 docking at the nuclear pore, nuclear import and integration. PLoS One. 2012;7(9):e46037. doi: 10.1371/journal.pone.0046037 - DOI - PMC - PubMed
    1. Di Nunzio F, Fricke T, Miccio A, Valle-Casuso JC, Perez P, Souque P, et al.. Nup153 and Nup98 bind the HIV-1 core and contribute to the early steps of HIV-1 replication. Virology. 2013;440(1):8–18. doi: 10.1016/j.virol.2013.02.008 - DOI - PMC - PubMed