. 2024 Sep 11;20(9):e1012552.
doi: 10.1371/journal.ppat.1012552. eCollection 2024 Sep.

Prion diseases disrupt glutamate/glutamine metabolism in skeletal muscle

Affiliations

Prion diseases disrupt glutamate/glutamine metabolism in skeletal muscle

Davide Caredio et al. PLoS Pathog. .

Abstract

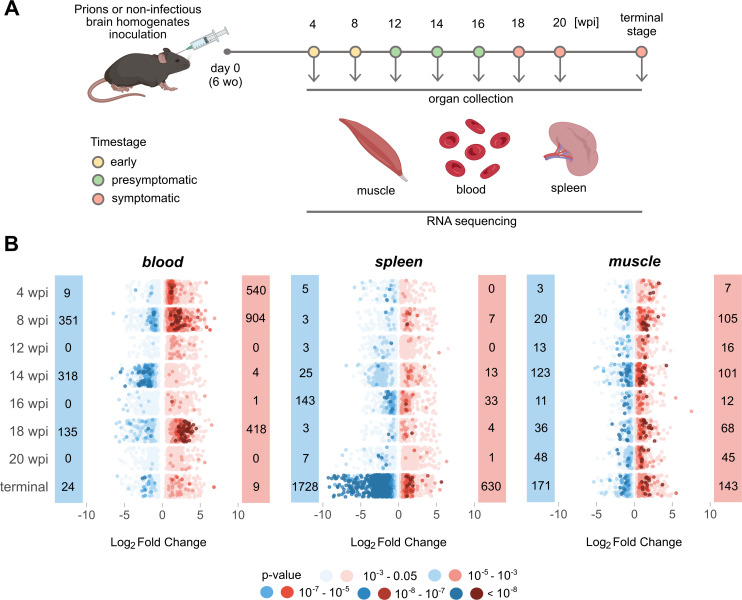
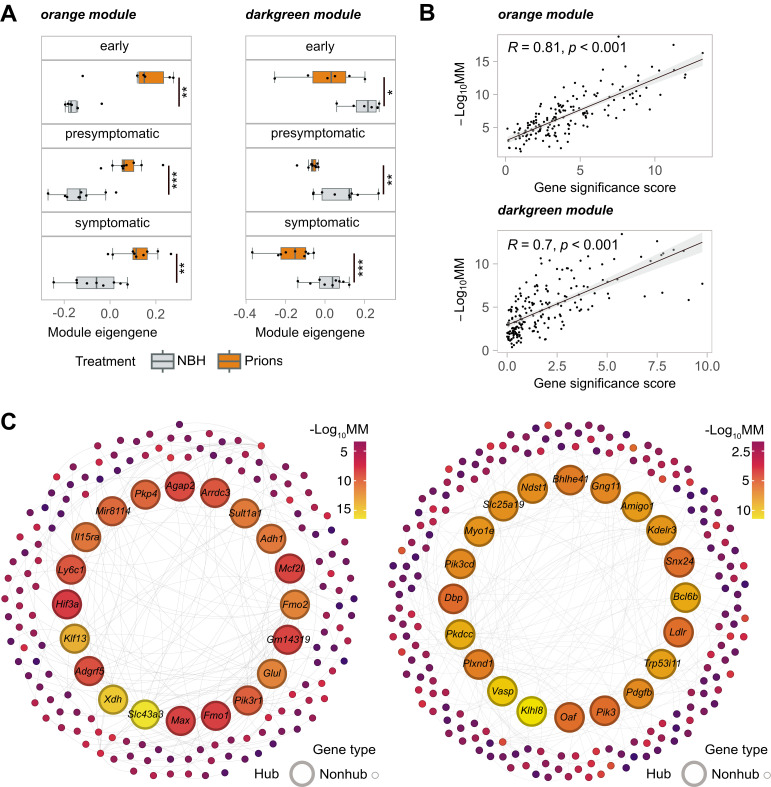
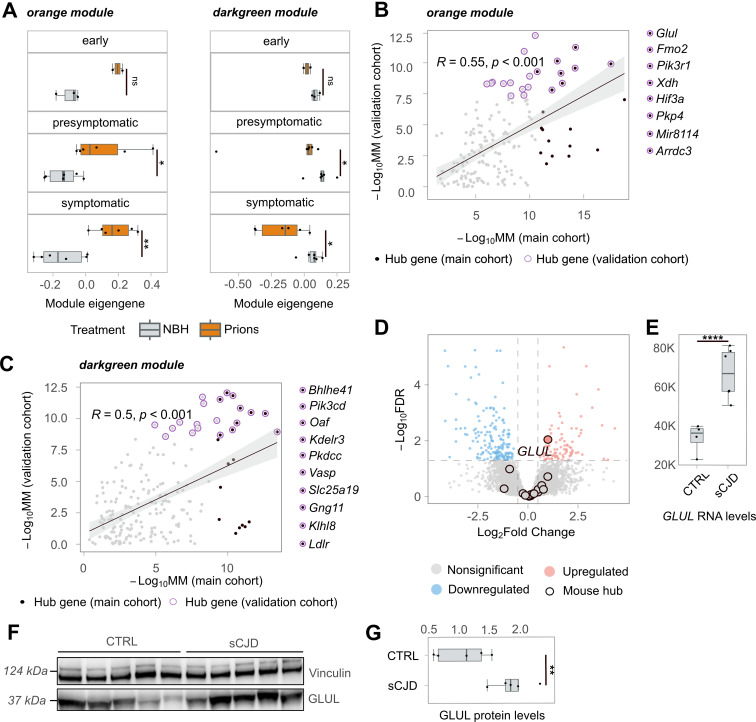
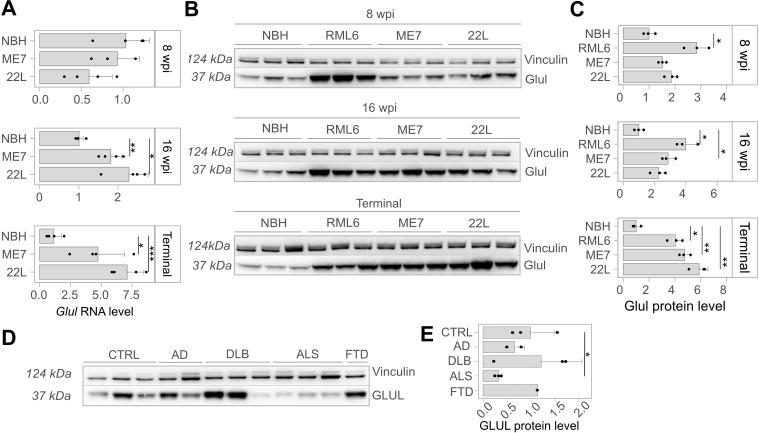
In prion diseases (PrDs), aggregates of misfolded prion protein (PrPSc) accumulate not only in the brain but also in extraneural organs. This raises the question whether prion-specific pathologies arise also extraneurally. Here we sequenced mRNA transcripts in skeletal muscle, spleen and blood of prion-inoculated mice at eight timepoints during disease progression. We detected gene-expression changes in all three organs, with skeletal muscle showing the most consistent alterations. The glutamate-ammonia ligase (GLUL) gene exhibited uniform upregulation in skeletal muscles of mice infected with three distinct scrapie prion strains (RML, ME7, and 22L) and in victims of human sporadic Creutzfeldt-Jakob disease. GLUL dysregulation was accompanied by changes in glutamate/glutamine metabolism, leading to reduced glutamate levels in skeletal muscle. None of these changes were observed in skeletal muscle of humans with amyotrophic lateral sclerosis, Alzheimer's disease, or dementia with Lewy bodies, suggesting that they are specific to prion diseases. These findings reveal an unexpected metabolic dimension of prion infections and point to a potential role for GLUL dysregulation in the glutamate/glutamine metabolism in prion-affected skeletal muscle.


Conflict of interest statement

The authors have declared that no competing interests exist.

Figures

Fig 1
Fig 1. Temporal Dynamics of Gene Expression in Prion-Affected Tissues.
(A) Muscle, blood, and spleen tissues were collected for bulk RNA sequencing at eight individual timepoints (wo = weeks old; wpi = week post inoculation). Samples were stratified into early, presymptomatic, and symptomatic stages. Panel created with BioRender.com (B) Prevalence of upregulated (red) and downregulated (blue) DEGs (p-value < 0.05) across disease progression in the three tissues analysed. The dots in the dot plot represent individual genes and are color-coded according to their corresponding p-values.
Fig 2
Fig 2. WGCNA Analysis of Gene Co-expression Modules.
(A) Boxplots of module eigengenes of the main cohort for gene co-expression orange and darkgreen modules identified by WGCNA at different timestages (early, presymptomatic and symptomatic). Statistical significance (*p < 0.05, **p < 0.01, ***p < 0.005, ****p < 0.001) is indicated by asterisks (B) The scatter plots illustrate the relationship between the gene significance score and module membership (MM). Pearson correlation coefficient (R) and its corresponding p-value are displayed. (C) The minimum spanning trees with nodes representing genes within the orange and darkgreen modules are shown. The colour of each node corresponds to module membership (MM). For each module, 20 hub genes are represented by larger-sized nodes.
Fig 3
Fig 3. Gene Co-expression and Human Validation of GLUL Upregulation.
(A) Boxplots of module eigengenes of the validation cohort for gene co-expression orange and darkgreen modules identified by WGCNA at different timestages (early, presymptomatic and symptomatic). (B-C) The scatter plots (Pearson’s correlation and pvalue indicated with R and p, respectively) depict the relationship between genes from the orange and darkgreen modules in the main and validation cohorts. Hub genes detected in the main cohort are represented by black dots, while hub genes detected in the validation cohort are represented by purple-circled dots. The black, purple-circled dots indicate hub genes detected in both cohorts. (D) The volcano plot displays the results of bulk RNA sequencing analysis of skeletal muscles from patients with sCJD and their age-matched controls. Red dots represent genes that are significantly upregulated in sCJD, while blue dots represent genes that are significantly downregulated. Mouse hub genes detected in the orange and darkgreen modules are black-circled. (E) Boxplots with normalized GLUL transcript counts in skeletal muscles of sCJD cases and their age-matched controls. (F) Western blot analysis (arbitrary densitometry unit, ADU) of GLUL and Vinculin protein expression in skeletal muscle samples from sCJD cases and age-matched controls. Each lane represents a biological replicate. (G) Densitometry (ADU) quantification of the Western Blot in Fig 3F. Statistical significance (*p < 0.05, **p < 0.01, ***p < 0.005, ****p < 0.001) is indicated by asterisks.
Fig 4
Fig 4. Levels of Glul mRNA, protein, glutamate, and glutamine in skeletal muscle lysates at 8 and 16 weeks post-inoculation (wpi) and terminal stage of mice with prion strains RML6, ME7, and 22L, as well as related control (NBH).
In panel (A), barplots display Glul mRNA levels normalized by GAPDH mRNA levels (derived from Ct values via RT-PCR). (B) Western blots of Glul and Vinculin protein levels of infected mice with different prion strains, as well as related NBH control (C) Densitometry (arbitrary densitometry unit, ADU) quantification of the Western Blot in Fig 4B. (D) Western blot of Glul and Vinculin protein levels of skeletal muscles from AD, DLB, ALS and FTD diagnosed individuals (E) Densitometry (ADU) quantification of the Western Blot in Fig 4D. Statistical significance (*p < 0.05, **p < 0.01, ***p < 0.005, ****p < 0.001) is indicated by asterisks.

References

    1. Aguzzi A, Falsig J. Prion propagation, toxicity and degradation. Nat Neurosci. 2012;15(7):936–9. doi: 10.1038/nn.3120 - DOI - PubMed
    1. Tabula Muris C, Overall c, Logistical c, Organ c, processing, Library p, et al.. Single-cell transcriptomics of 20 mouse organs creates a Tabula Muris. Nature. 2018;562(7727):367–72. doi: 10.1038/s41586-018-0590-4 - DOI - PMC - PubMed
    1. Wulf MA, Senatore A, Aguzzi A. The biological function of the cellular prion protein: an update. BMC Biol. 2017;15(1):34. doi: 10.1186/s12915-017-0375-5 - DOI - PMC - PubMed
    1. Klein MA, Frigg R, Flechsig E, Raeber AJ, Kalinke U, Bluethmann H, et al.. A crucial role for B cells in neuroinvasive scrapie. Nature. 1997;390(6661):687–90. doi: 10.1038/37789 - DOI - PubMed
    1. Mabbott NA, Mackay F, Minns F, Bruce ME. Temporary inactivation of follicular dendritic cells delays neuroinvasion of scrapie. Nature medicine. 2000;6(7):719–20. doi: 10.1038/77401 - DOI - PubMed

LinkOut - more resources