. 2024 Sep 13;10(37):eadk3700.
doi: 10.1126/sciadv.adk3700. Epub 2024 Sep 11.

Modeling Lewy body disease with SNCA triplication iPSC-derived cortical organoids and identifying therapeutic drugs

Affiliations

Modeling Lewy body disease with SNCA triplication iPSC-derived cortical organoids and identifying therapeutic drugs

Yunjung Jin et al. Sci Adv. .

Abstract

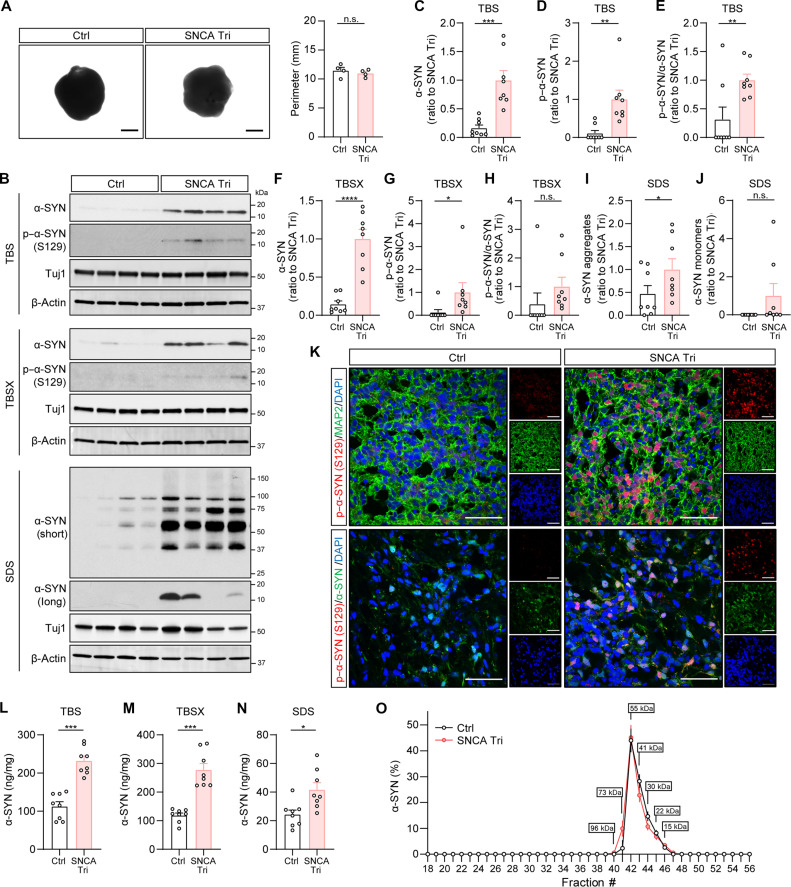
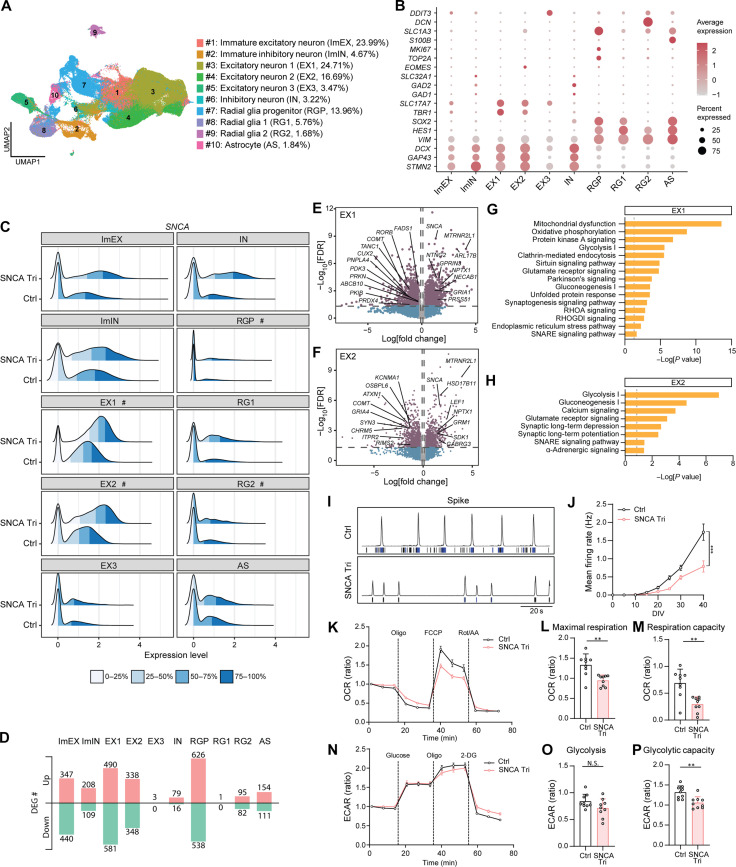
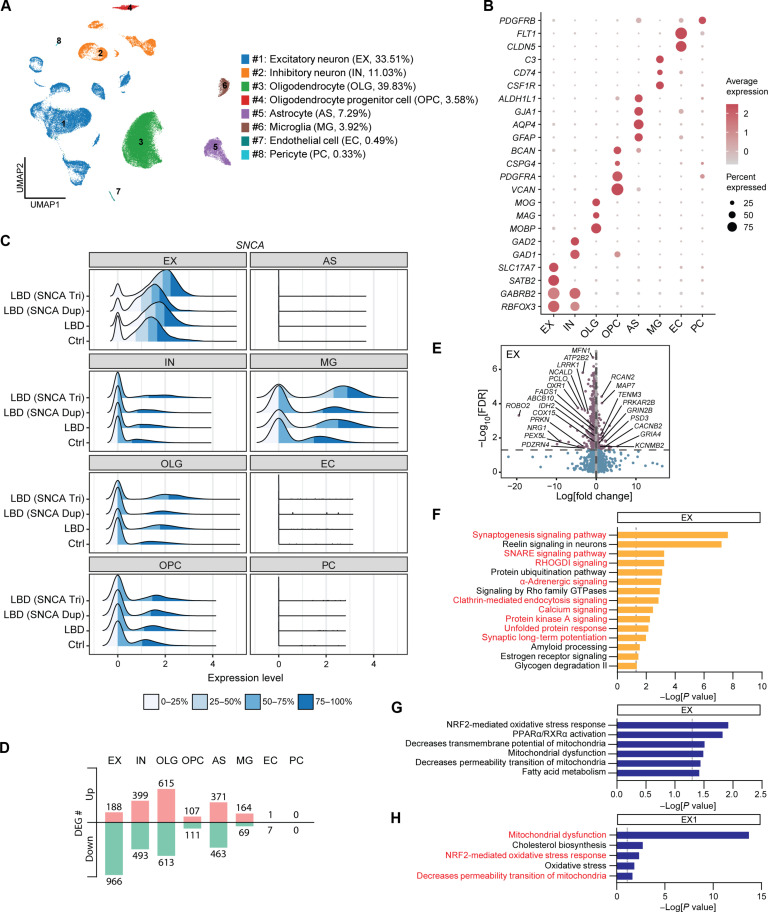
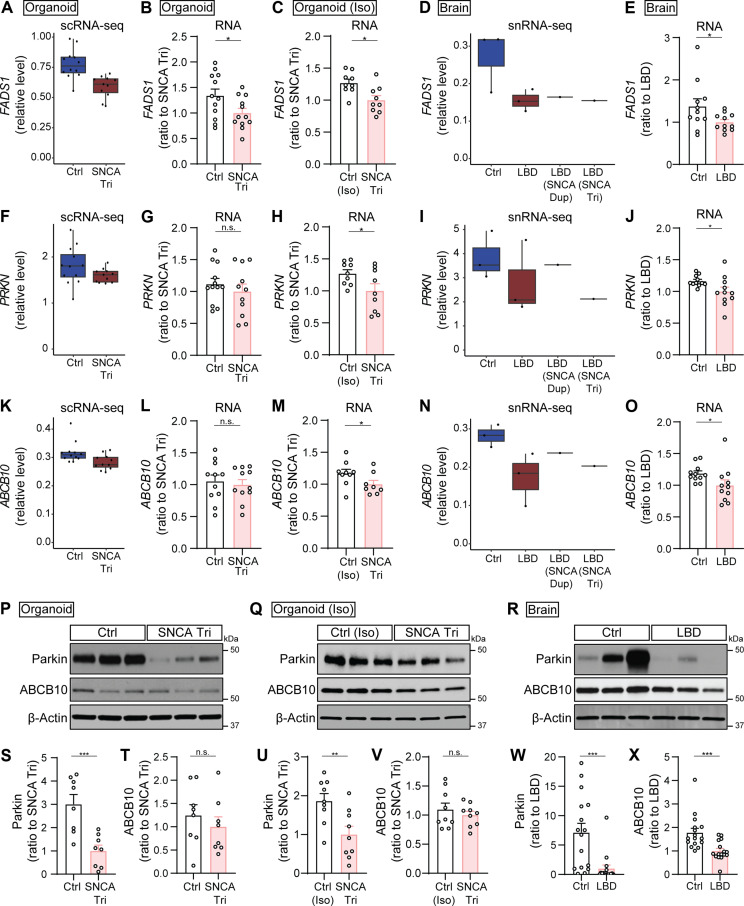
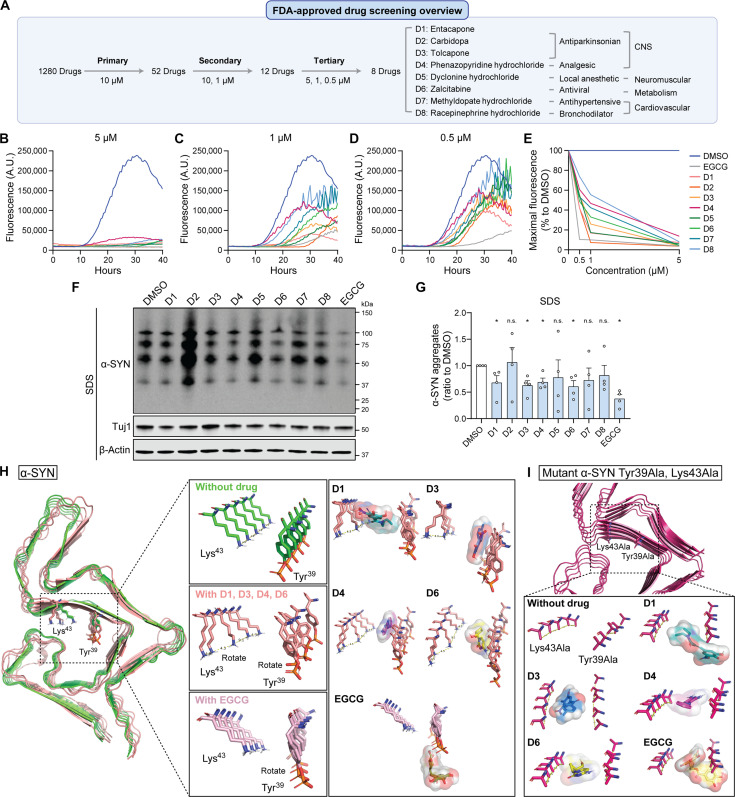
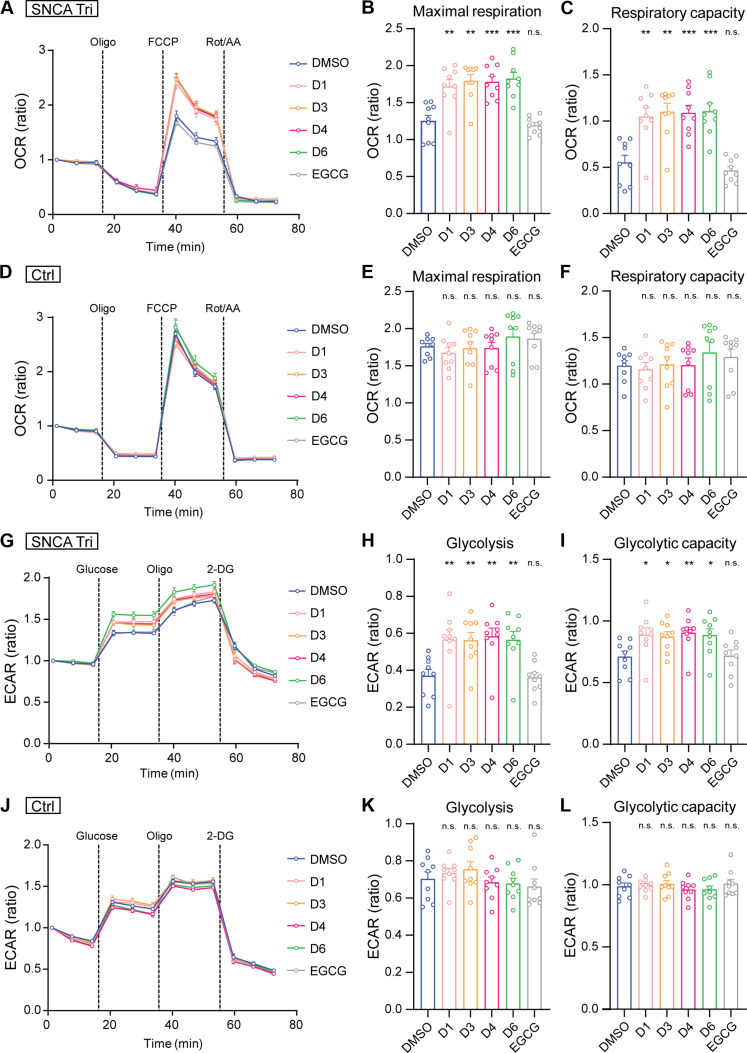
Aggregated α-synuclein (α-SYN) proteins, encoded by the SNCA gene, are hallmarks of Lewy body disease (LBD), affecting multiple brain regions. However, the specific mechanisms underlying α-SYN pathology in cortical neurons, crucial for LBD-associated dementia, remain unclear. Here, we recapitulated α-SYN pathologies in human induced pluripotent stem cells (iPSCs)-derived cortical organoids generated from patients with LBD with SNCA gene triplication. Single-cell RNA sequencing, combined with functional and molecular validation, identified synaptic and mitochondrial dysfunction in excitatory neurons exhibiting high expression of the SNCA gene, aligning with observations in the cortex of autopsy-confirmed LBD human brains. Furthermore, we screened 1280 Food and Drug Administration-approved drugs and identified four candidates (entacapone, tolcapone, phenazopyridine hydrochloride, and zalcitabine) that inhibited α-SYN seeding activity in real-time quaking-induced conversion assays with human brains, reduced α-SYN aggregation, and alleviated mitochondrial dysfunction in SNCA triplication organoids and excitatory neurons. Our findings establish human cortical LBD models and suggest potential therapeutic drugs targeting α-SYN aggregation for LBD.


Figures

Fig. 1.
Fig. 1.. Increased levels of α-SYN in the iPSC-derived SNCA triplication cortical organoids.
(A) Representative images showing the size of organoids. The perimeters of the organoids were measured and compared. Each dot on the graph represents the average perimeter of approximately 96 organoids per condition. n = 4 samples per group. Scale bar, 1 mm. (B to J) The levels of total α-SYN and phosphorylated α-SYN in each fraction of organoids were measured using Western blotting. Different exposure times (short and long) were applied to display and quantify the aggregated and monomeric α-SYN. Results were normalized to Tuj1 levels. n = 4 samples with two replicates per group. Each dot on the graph represents an individual replicate. Molecular weight markers (kilodaltons) are indicated on the right side of each blot. (K) The Ctrl and SNCA Tri organoids were immunostained with phosphorylated–α-SYN (S129) antibody (red) and MAP2 antibody (green, top) or total α-SYN (green, bottom). The nuclei were stained with 4′,6-diamidino-2-phenylindole (DAPI) (blue). Scale bar, 50 μm. (L to N) The levels of total α-SYN in each fraction of organoids were measured using ELISA. The experiments were conducted in duplicate. n = 4 samples. Each dot on the graph represents an individual replicate. (O) TBS-soluble organoid lysates were fractioned using SEC. The fractions ranging from #18 to #56 were collected, and the levels of α-SYN were measured using ELISA. The experiments were performed in duplicate. n = 4 samples per group. Data represent means ± SEM. Student’s t tests were used for statistical analyses. *P < 0.05; **P < 0.01; ***P < 0.001; n.s., not significant.
Fig. 2.
Fig. 2.. Dysregulation of crucial pathways in SNCA triplication organoids revealed by scRNA-seq analysis with functional validation.
(A) UMAP plot of Ctrl and SNCA Tri organoids. The average cell population of each cluster is shown. Experiments were performed in three replicates per sample with n = 4 samples per group. A total of 161,920 cells were analyzed. (B) Dot plots of known marker genes. (C) Ridge plot of SNCA expression in each cell types. “#” indicates clusters showing significant difference. (D) Number of DEGs for each cell cluster. Up/Down, up-regulated/ down-regulated genes. (E and F) Volcano plots for DEGs in the EX1 (E) and EX2 (F) clusters. (G and H) Selected canonical pathways enriched by DEGs from the EX1 (G) and EX2 (H) clusters. (I and J) MEA assay. Representative spike histogram with a raster plot of electrode activity (I) and mean firing rate (J) are shown. Experiments were conducted in quadruplicate with three independent experiments. Data are presented as means ± SEM. Two-way repeated measures analysis of variance (ANOVA) was used for statistical analyses. (K to P) Seahorse XF Mito Stress test (K to M) measuring OCR (K), and maximum respiration (L) and respiratory capacity (M). Seahorse XF Glycolysis Stress test (N to P) measuring ECAR (N), glycolysis level (O), and glycolytic capacity (P). Each data point was normalized to the first data point to calculate the OCR or ECAR ratio. Experiments were conducted in triplicate with three independent experiments. Each dot represents an individual replicate, and the data are presented as means ± SEM. Student’s t tests were used for statistical analyses. *P < 0.05; **P < 0.01; ***P < 0.001.
Fig. 3.
Fig. 3.. Molecular phenotypes of cortical LBD human brains overlap with SNCA triplication cortical organoids.
(A) UMAP plot of Ctrl and LBD brains. Eight individual clusters were defined and annotated to distinct cell types. Average cell population of each cell cluster is indicated on the right side of the cluster name. A total of 60,644 total nuclei were analyzed. (B) Dot plots of known marker genes used for cell type identification. (C) Ridge plot of SNCA expression in each cell type of Ctrl, LBD, LBD (SNCA Dup), and LBD (SNCA Tri) brains. (D) Number of DEGs for all cell clusters in the comparison between LBD and Ctrl brains. Up-regulated genes and down-regulated genes are indicated. (E) Volcano plots for DEGs of LBD versus Ctrl brains in the EX cluster. (F) Selected canonical pathways enriched by DEGs from the EX cluster. Pathways overlapping with scRNA-seq data from SNCA triplication cortical organoids are indicated in red. (G) Top toxicity list pathways enriched by DEGs from the EX cluster of LBD human brains. (H) Top toxicity list pathways enriched by DEGs from the EX1 cluster of SNCA triplication cortical organoids. Pathways overlapping with snRNA-seq data from LBD human brains are indicated in red.
Fig. 4.
Fig. 4.. Validation of overlapping DEGs between cortical organoids and human brains.
Validation of the overlapping DEGs through qPCR (A to O) and Western blotting (P to X) in control and SNCA triplication organoids (labeled as Organoid; B, G, L, P, S, and T), isogenic set of control (Iso) and SNCA triplication organoids [labeled as Organoid (Iso); C, H, M, Q, U, and V], and human brains (labeled as Brain; E, J, O, R, W, and X). (A to O) RNA levels of FADS1 (A to E), PRKN (F to J), and ABCB10 (K to O) genes. Box plots illustrate their RNA levels in the EX1 cluster of organoids (A, F, and K), and in the EX cluster of human brains (D, I, and N). Bar graphs present the RNA levels in organoids (B, G, and L), isogenic organoids (C, H, and M), and human brains (E, J, and O). (P to X) Parkin and ABCB10 levels. Representative gel images and quantification of Parkin and ABCB10 levels in TBSX fractions of organoids (P, S, and T), isogenic organoids (Q, U, and V), and human brains (R, W, and X). Results were normalized to β-actin levels. Organoids: n = 4 samples with three replicates (qPCR) or two replicates (Western blotting) per group; each dot on the graph represents an individual replicate. Isogenic organoids: The experiments were conducted in triplicate with three independent experiments. Each dot on the graph represents an individual replicate. Human brains: n = 11 samples (qPCR) or n = 16 samples (Western blotting) per groups; each dot on the graph represents an individual case. Data represent means ± SEM. Student’s t tests were used for statistical analyses. *P < 0.05; **P < 0.01; ***P < 0.001.
Fig. 5.
Fig. 5.. Identification of FDA-approved drug candidates inhibiting α-SYN seeding and aggregation.
(A to E) Overview of FDA-approved drug screening at various concentrations to discover α-SYN aggregation inhibitors using RT-QuIC assay (A). Final eight selected drugs (D1 to D8) are listed with their original function. The aggregation curves at different concentrations (B to D) and the percentage reduction in maximal fluorescence induced by drug treatment at different concentrations (E) are shown. Negative (DMSO) and positive (EGCG) controls were included. Data represent mean values of duplicate experiments. FCCP, carbonyl cyanide p-trifluoromethoxyphenylhydrazone. (F and G) The drug-treated SNCA Tri organoids were lysed in RIPA and SDS buffers sequentially, and the levels of total α-SYN in the SDS fractions were measured by Western blot. DMSO and EGCG were used as controls. Four independent experiments were conducted, and data are presented as means ± SEM. Student’s t tests were used for statistical analyses by comparing each group with DMSO-treated group. 2-DG, 2-deoxyglucose. (H) The computational 3D drug-working model depicting the binding interactions between α-SYN aggregates and the drug candidates (D1, D3, D4, and D6) and EGCG at the Tyr39 and Lys43 residues. The α-SYN aggregate conformation without the drug is visualized in green, while the conformation with the drug bound is presented in pink. Representative images of α-SYN aggregate conformations, both with and without the D1 or EGCG drug, are shown to illustrate the working model at the Tyr39 and Lys43 residue sites. (I) The computational 3D model showing the drug’s effect was generated for mutated α-SYN, where Tyr39 and Lys43 were replaced with alanine (Tyr39Ala and Lys43Ala). The mutated α-SYN aggregate with and without drug is visualized in magenta.
Fig. 6.
Fig. 6.. Effects of drug treatment on alleviating mitochondrial dysfunction in SNCA triplication iPSC-derived models.
(A to L) SNCA Tri and Ctrl neurons were treated with the final four drug candidates (D1, D3, D4, and D6) at 0.5 μM from DIV7. Seahorse assay was performed at DIV20. Seahorse XF Mito Stress test (A to F) measured OCR, comparing DMSO- to drug-treated SNCA Tri and Ctrl neurons. Maximum respiration (B and E) and respiratory capacity (C and F) were analyzed. Seahorse XF Glycolysis Stress test (G to L) measured ECAR, comparing DMSO- and drug-treated neurons. Glycolysis level (H and K) and glycolytic capacity (I and L) were determined. EGCG was used as a reference. Each data point was normalized to the first data point to calculate the OCR or ECAR ratio. Three independent experiments were conducted in triplicate, and each dot represents an individual replicate. Data are shown as means ± SEM. Student’s t tests were used for statistical analyses by comparing each group with DMSO-treated group. *P < 0.05; **P < 0.01; ***P < 0.001.

References

    1. Dickson D. W., α-Synuclein and the Lewy body disorders. Curr. Opin. Neurol. 14, 423–432 (2001). - PubMed
    1. Koga S., Sekiya H., Kondru N., Ross O. A., Dickson D. W., Neuropathology and molecular diagnosis of synucleinopathies. Mol. Neurodegener. 16, 83 (2021). - PMC - PubMed
    1. Dickson D. W., Neuropathology of Parkinson disease. Parkinsonism Relat. Disord. 46 ( Suppl. 1), S30–S33 (2018). - PMC - PubMed
    1. Lippa C. F., Duda J. E., Grossman M., Hurtig H. I., Aarsland D., Boeve B. F., Brooks D. J., Dickson D. W., Dubois B., Emre M., Fahn S., Farmer J. M., Galasko D., Galvin J. E., Goetz C. G., Growdon J. H., Gwinn-Hardy K. A., Hardy J., Heutink P., Iwatsubo T., Kosaka K., Lee V. M., Leverenz J. B., Masliah E., McKeith I. G., Nussbaum R. L., Olanow C. W., Ravina B. M., Singleton A. B., Tanner C. M., Trojanowski J. Q., Wszolek Z. K., DLB/PDD Working Group , DLB and PDD boundary issues: Diagnosis, treatment, molecular pathology, and biomarkers. Neurology 68, 812–819 (2007). - PubMed
    1. Simon C., Soga T., Okano H. J., Parhar I., α-Synuclein-mediated neurodegeneration in Dementia with Lewy bodies: The pathobiology of a paradox. Cell Biosci. 11, 196 (2021). - PMC - PubMed

Publication types

MeSH terms