. 2024 Sep 13;10(37):eadp4119.
doi: 10.1126/sciadv.adp4119. Epub 2024 Sep 11.

Antibiotics damage the colonic mucus barrier in a microbiota-independent manner

Affiliations

Antibiotics damage the colonic mucus barrier in a microbiota-independent manner

Jasmin Sawaed et al. Sci Adv. .

Abstract

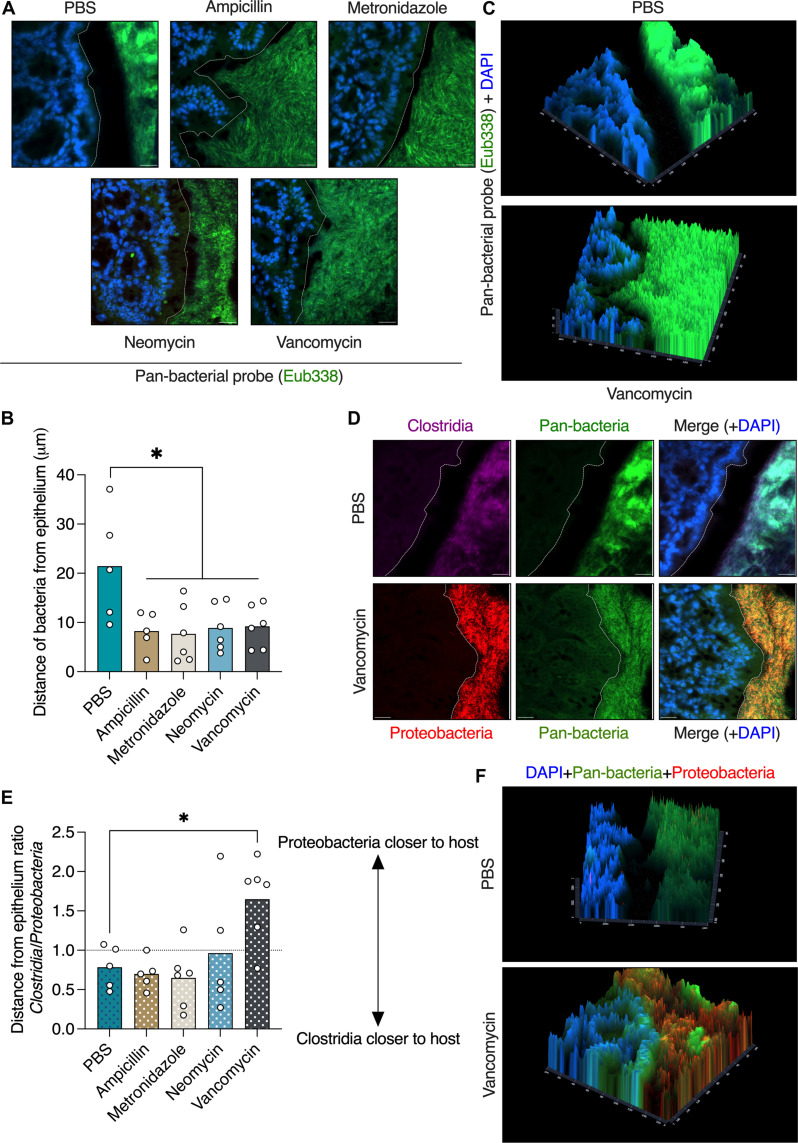
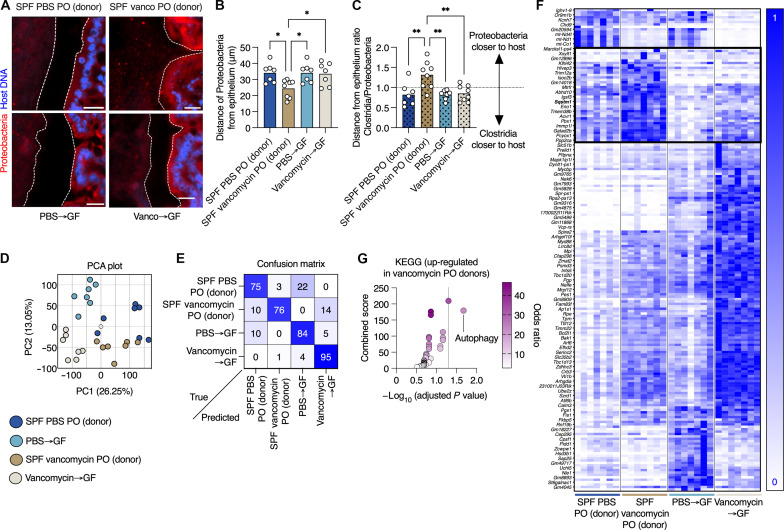
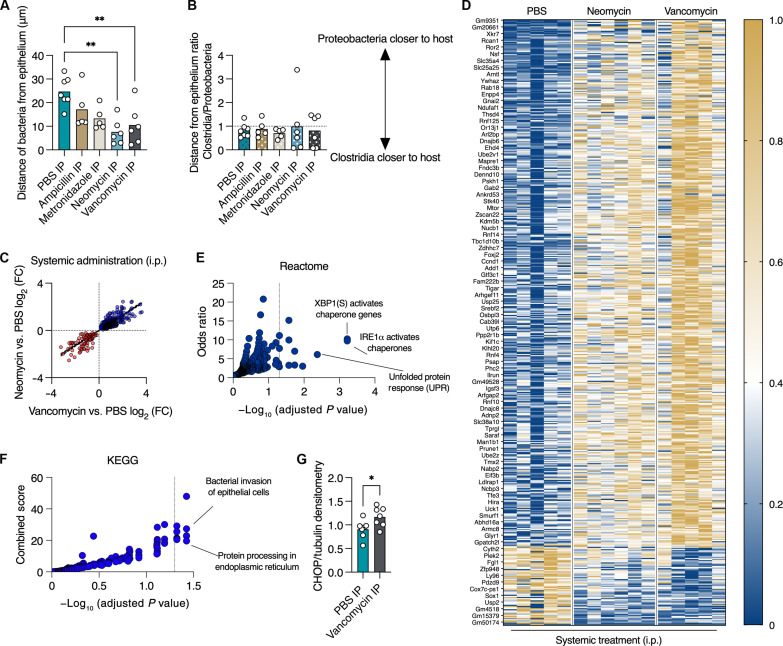
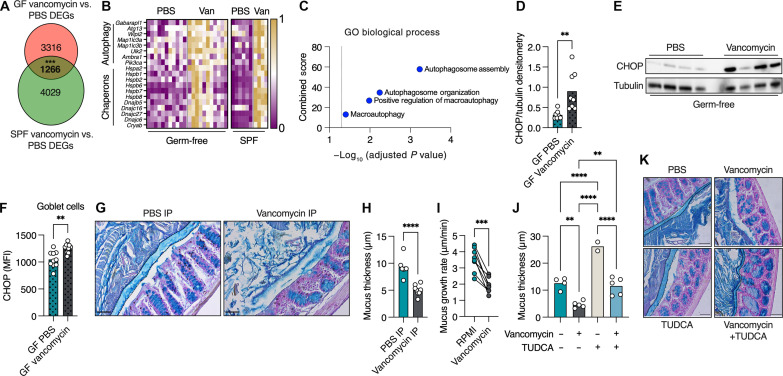
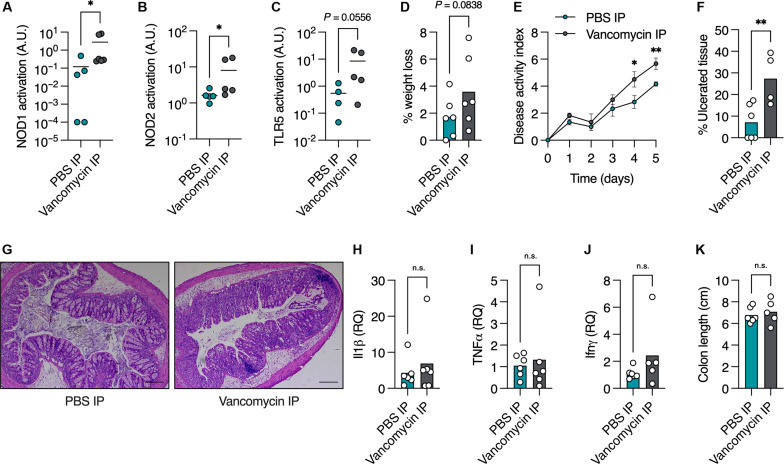
Antibiotic use is a risk factor for development of inflammatory bowel diseases (IBDs). IBDs are characterized by a damaged mucus layer, which does not separate the intestinal epithelium from the microbiota. Here, we hypothesized that antibiotics affect the integrity of the mucus barrier, which allows bacterial penetrance and predisposes to intestinal inflammation. We found that antibiotic treatment led to breakdown of the colonic mucus barrier and penetration of bacteria into the mucus layer. Using fecal microbiota transplant, RNA sequencing followed by machine learning, ex vivo mucus secretion measurements, and antibiotic treatment of germ-free mice, we determined that antibiotics induce endoplasmic reticulum stress in the colon that inhibits colonic mucus secretion in a microbiota-independent manner. This antibiotic-induced mucus secretion flaw led to penetration of bacteria into the colonic mucus layer, translocation of microbial antigens into circulation, and exacerbation of ulcerations in a mouse model of IBD. Thus, antibiotic use might predispose to intestinal inflammation by impeding mucus production.


Figures

Fig. 1.
Fig. 1.. Oral antibiotic treatment disrupts the colonic mucus barrier.
(A) FISH images of colonic tissues from mice treated orally with antibiotics as indicated. Bacteria are stained in green and host nuclei in blue. The dashed white lines mark the edge of the host epithelium. Scale bars, 20 μm. (B) Quantification of distance between luminal bacteria and host epithelium as in (A). (C) Fluorescent intensity imaging of colonic sections from mice treated as indicated. Bacteria are represented by green signal and host epithelium by blue signal. DAPI, 4′,6-diamidino-2-phenylindole. (D) FISH images of colonic tissues from mice treated with antibiotics as indicated and stained with the indicated probes. The dashed white lines mark the edge of the host epithelium. Scale bars, 20 μm. (E) Quantification of the ratio of the distances between Clostridia or Gammaproteobacteria and the host epithelium as in (D). (F) Fluorescent intensity imaging of colonic sections from mice treated as indicated. Pan-bacteria are represented by green signal, Gammaproteobacteria by red signal, and host epithelium by blue signal. (B and E) Each dot represents a mouse. At least 25 measurements per mouse were taken. One-way analysis of variance (ANOVA). *P < 0.05.
Fig. 2.
Fig. 2.. Vancomycin-induced changes to the gut microbiota cannot explain treatment impact on the mucus barrier and gut transcription.
(A) FISH images of colonic tissues from SPF mice treated with vancomycin as indicated or GF mice that received an FMT from vancomycin-treated mice and stained with the indicated probes. The dashed white lines mark the edge of the host epithelium. Scale bars, 20 μm. (B) Quantification of distance between luminal Gammaproteobacteria and host epithelium as in (A). (C) Quantification of the ratio of the distances between Clostridia or Gammaproteobacteria and the host epithelium as in (A). (D) PCA plot of colonic transcriptional profiles of mice treated as indicated. (E) A confusion matrix depicting the percentage of predictions for each category against the true classifications in a four-way Random Forest classification task. Diagonal entries represent the accuracy of predictions for each category (true positives), while off-diagonal entries indicate the model’s misclassifications. (F) Heatmap showing transcriptional changes of the top 200 genes that distinguish between the treatment groups on the basis of the classifier in (E). Each column represents a mouse. (G) Kyoto Encyclopedia of Genes and Genomes (KEGG) pathways of transcripts which are uniquely altered in vancomycin-treated mice (donors) as plotted in (F) (in the black box). (B to D) Each dot represents a mouse. (B and C) One-way ANOVA. At least 25 measurements per mouse were taken. *P < 0.05; **P < 0.01. PO, per os.
Fig. 3.
Fig. 3.. Systemic administration of antibiotics induces ER stress in the colon.
(A) Quantification of distance between luminal bacteria and host epithelium in colons of mice treated with the indicated antibiotics via intraperitoneal one-way ANOVA. (B) Quantification of the ratio of the distances between Clostridia or Gammaproteobacteria and the host epithelium in mice treated as in (A). (C) Expression levels of transcripts in colons of mice treated with vancomycin (x axis) or neomycin (y axis) via intraperitoneal injection as compared to PBS. Plotted are transcripts whose expression was induced by both antibiotics or suppressed by both antibiotics (P < 0.05, Mann-Whitney test). Each dot represents a transcript. Blue, genes that are more highly expressed under antibiotic treatment; red, genes with reduced expression after treatment. (D) Heatmap depicting normalized expression levels of genes shown in (C). Each column represents a mouse. (E and F) Analyses using (E) Reactome or (F) KEGG pathways of transcripts plotted in (C). Dotted line on the x axis represents a P value of 0.05. Each dot represents a category/pathway. (G) Protein levels of CHOP relative to tubulin using densitometry analysis of a Western blot of colonic lysates from mice treated as indicated. Student’s t test. (A, B, and G) Each dot represents a mouse. (A and B) At least 25 measurements per mouse were taken. *P < 0.05, **P < 0.01. IP, intraperitoneal; FC, fold change.
Fig. 4.
Fig. 4.. Systemic vancomycin treatment induces ER stress in a microbiota-independent manner which inhibits mucus secretion in the colon.
(A) Venn diagram depicting the number of differentially expressed genes (DEGs) in colonic tissue from GF and SPF mice in response to vancomycin intraperitoneal injection. The overlapping area represents DEGs that are affected in the same manner (induced or suppressed) in both GF and SPF mice in response to vancomycin treatment (the P value for the observed intersection was computed on the basis of the proportion of random samples with intersections greater than or equal to the observed value). (B) Heatmap depicting normalized expression levels of autophagy- and ER stress–related genes in response to vancomycin intraperitoneal treatment. Each column represents a mouse. (C) Analysis of overlapping (in bold) DEGs depicted in (A) using Gene Ontology (GO), selecting for pathways associated with autophagy. (D and E) Protein levels of CHOP relative to Tubulin using densitometry analysis of a Western blot of colonic lysates from GF mice treated as indicated. (F) Quantification of protein levels of CHOP, specifically in colonic goblet cells via immunohistochemistry. (G) Colonic sections from mice treated systemically as indicated, stained with Alcian blue to visualize mucus. The mucus layer is defined by the dashed line. Scale bars, 50 μm. (H) Measurement of mucus thickness as shown in (G). (I) Mucus growth rate. Lines connect tissues from the same mouse. Paired t test. (J) Measurement of mucus thickness in mice treated as indicated. One-way ANOVA. (K) Colonic sections from mice treated systemically as indicated, stained with Alcian blue to visualize mucus. The mucus layer is defined by the dashed line. Scale bars, 50 μm. (D, F, H, and J) Each dot represents a mouse. (D, F, and H) Student’s t test. (H and J) At least 25 measurements per mouse were taken. *P < 0.05, **P < 0.01, ***P < 0.001, ****P < 0.0001. MFI, mean fluorescent intensity.
Fig. 5.
Fig. 5.. Systemic vancomycin treatment impairs colonic barrier function and aggravates ulceration.
(A to C) Detection of NOD1 (A), NOD2 (B), and TLR5 (C) agonists in mouse serum using reporter cell lines. (D to K) Mice were treated with 4% DSS for 5 days. (D) Percentage weight change on day 5 of treatment compared to before treatment, (E) disease activity index ± SEM, (F) quantification of percent of colonic area with ulceration, and (G) representative histological images of colonic tissue from DSS-treated mice. (H to J) Expression of proinflammatory genes using quantitative polymerase chain reaction. (K) Colon length of mice treated as indicated. (A to D, F, and H to K) Each dot represents a mouse. Scale bars, 20 μm. (A to F and H to K) Student’s t test. *P < 0.05, **P < 0.01. n.s., not significant; RQ, relative quantity.

References

    1. de Nies L., Kobras C. M., Stracy M., Antibiotic-induced collateral damage to the microbiota and associated infections. Nat. Rev. Microbiol. 21, 789–804 (2023). - PubMed
    1. Fishbein S. R. S., Mahmud B., Dantas G., Antibiotic perturbations to the gut microbiome. Nat. Rev. Microbiol. 21, 772–788 (2023). - PMC - PubMed
    1. Yadav S., Shah D., Dalai P., Agrawal-Rajput R., The tale of antibiotics beyond antimicrobials: Expanding horizons. Cytokine 169, 156285 (2023). - PubMed
    1. Yang J. H., Bhargava P., McCloskey D., Mao N., Palsson B. O., Collins J. J., Antibiotic-induced changes to the host metabolic rnvironment inhibit drug efficacy and alter immune function. Cell Host Microbe 22, 757–765.e3 (2017). - PMC - PubMed
    1. Colaço H. G., Barros A., Neves-Costa A., Seixas E., Pedroso D., Velho T., Willmann K. L., Faisca P., Grabmann G., Yi H. S., Shong M., Benes V., Weis S., Köcher T., Moita L. F., Tetracycline antibiotics induce host-dependent disease tolerance to infection. Immunity 54, 53–67.e7 (2021). - PMC - PubMed

MeSH terms

Substances