. 2024 Oct:76:103316.
doi: 10.1016/j.redox.2024.103316. Epub 2024 Aug 16.

Heme: A link between hemorrhage and retinopathy of prematurity progression

Affiliations

Heme: A link between hemorrhage and retinopathy of prematurity progression

Tamás Gáll et al. Redox Biol. 2024 Oct.

Abstract

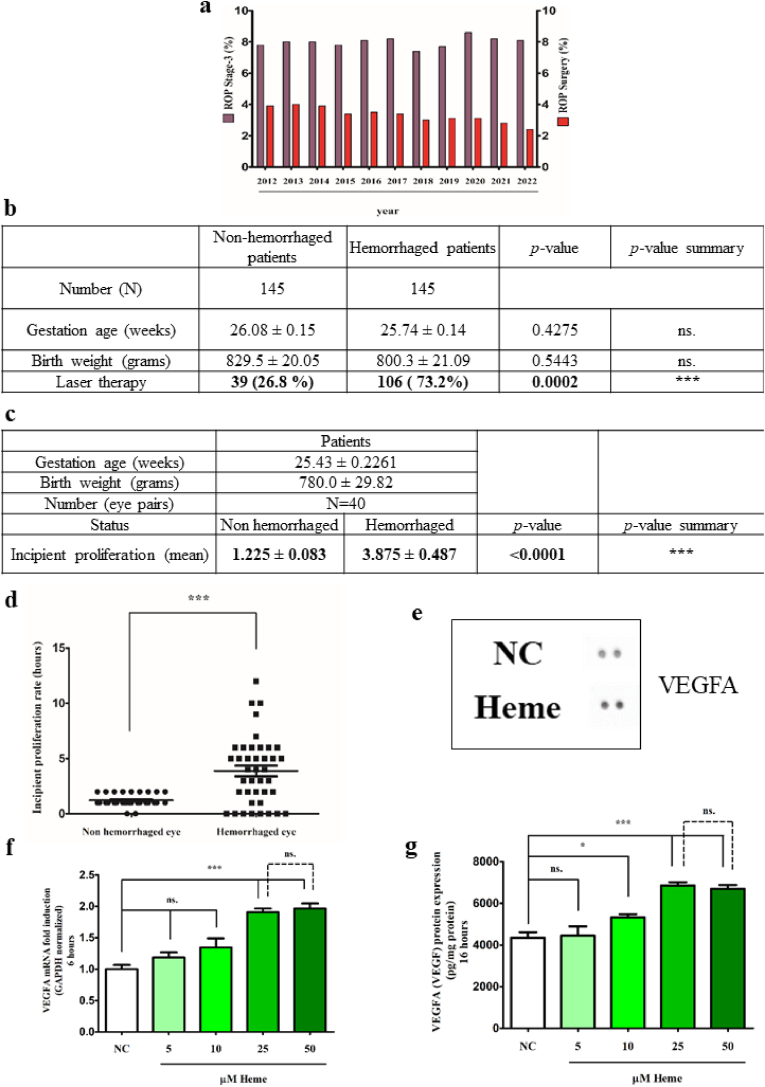
Neovascularization is implicated in the pathology of retinopathy of prematurity (ROP), diabetic retinopathy (DR), and age-related macular degeneration (AMD), which are the leading causes of blindness worldwide. In our work, we analyzed how heme released during hemorrhage affects hypoxic response and neovascularization. Our retrospective clinical analysis demonstrated, that hemorrhage was associated with more severe retinal neovascularization in ROP patients. Our heme-stimulated human retinal pigment epithelial (ARPE-19) cell studies demonstrated increased expression of positive regulators of angiogenesis, including vascular endothelial growth factor-A (VEGFA), a key player of ROP, DR and AMD, and highlighted the activation of the PI3K/AKT/mTOR/VEGFA pathway involved in angiogenesis in response to heme. Furthermore, heme decreased oxidative phosphorylation in the mitochondria, augmented glycolysis, facilitated HIF-1α nuclear translocation, and increased VEGFA/GLUT1/PDK1 expression suggesting HIF-1α-driven hypoxic response in ARPE-19 cells without effecting the metabolism of reactive oxygen species. Inhibitors of HIF-1α, PI3K and suppression of mTOR pathway by clinically promising drug, rapamycin, mitigated heme-provoked cellular response. Our data proved that oxidatively modified forms of hemoglobin can be sources of heme to induce VEGFA during retinal hemorrhage. We propose that hemorrhage is involved in the pathology of ROP, DR, and AMD.

Keywords: Heme; Hypoxia; Mitochondria; Rapamycin; Retinopathy; VEGF.


Conflict of interest statement

Declaration of competing interest The authors have declared no conflict of interest.

Figures

Image 1
Graphical abstract
Fig. 1
Fig. 1
Hemorrhage correlates with the incidence of severe ROP. a Incidence of ROP Stage-3 and ROP surgery in VON database 2012–2022. b Differences in gestational age, birth weight, and laser therapy between hemorrhage and non-hemorrhaged patients. N = 145 in both groups. Data are represented as mean value ± SEM. Statistical analysis was performed by one-way ANOVA test followed by Bonferroni correction. A value of p < 0.05 was considered significant. c,d Correlation between hemorrhage, gestational age, birth weight and vasoproliferation in the hemorrhaged group. N = 40. Data are represented as mean value ± SEM. Statistical analysis was performed by one-way ANOVA test followed by Bonferroni correction. A value of p < 0.05 was considered significant. e Human angiogenesis array analysis of cell culture supernatants of ARPE-19 cells exposed to heme (25 μM). Each group contained two replicates of culture supernatant mixtures. NC: non-treated cells. f Gene expression levels of VEGFA in ARPE-19 cells exposed to heme (5–50 μM). NC: non-treated cells. Data are represented as mean value ± SEM (n = 5). Statistical analysis was performed by one-way ANOVA test followed by Bonferroni correction. A value of p < 0.05 was considered significant. g VEGFA protein levels measured by ELISA in ARPE-19 cells exposed to heme (5–50 μM). NC: non-treated cells. Data are represented as mean value ± SEM (n = 5). Statistical analysis was performed by one-way ANOVA test followed by Bonferroni correction. A value of p < 0.05 was considered significant.
Fig. 2
Fig. 2
Endothelial Cell Tube Formation Assay. HUVEC cultures were plated on Geltrex LDEV-Free Reduced Growth Factor Basement Membrane Matrix and exposed to 10-fold or 25-fold concentrated ARPE-19 cell culture supernatants from heme-exposed cells. For positive inducer control of tube formation, HUVECs exposed to Medium 200 supplemented with Large VesseI Endothelial Supplement (LVES), while for negative control, HUVECs exposed to Medium 200 without LVES were used (n = 3). Tube formation was observed using Leica DMi1 microscope.
Fig. 3
Fig. 3
RNA sequencing transcriptomic signatures in ARPE-19 cells upon heme exposure. a Heatmap representation of the differentially expressed genes identified in RPEs exposed to heme (25 μM) compared to the control (n = 3). NC: non-treated cells. The color key represents gene expression levels with darker colors representing higher (red) or lower (blue) gene expression. b Volcano plot analysis of the differentially expressed genes identified in RPEs exposed to heme (25 μM) compared to the control. c Overrepresented GOterms in heme-stimulated RPEs compared to controls using the Cytoscape ClueGO bioinformatics tool. d RNA sequencing analysis of the positive regulators of angiogenesis and e cholesterol biosynthetic process in heme-stimulated ARPE-19 cells compared to controls. Raw sequencing data (fastq) was aligned to human reference genome version GRCh38 using HISAT2 algorithm and BAM files were generated. Downstream analysis was performed using StrandNGS software (www.strand-ngs.com). BAM files were imported into the software DESeq algorithm was used for normalization. Moderated T-test was used to determine differentially expressed genes between conditions, p value < 0.05 was considered significant difference. f GO functional enrichment analysis of the positive regulators of angiogenesis and e cholesterol biosynthetic process in heme-stimulated ARPE-19 cells compared to controls using the Cytoscape software.
Fig. 4
Fig. 4
Heme Induces Nuclear Translocation of HIF-1α and Activates HIF-Regulated Gene Expression in ARPE-19 cells. a Immunofluorescent analysis of HIF-1α nuclear translocation in ARPE-19 cells exposed to heme (5–25 μM) compared to non-treated control. Nuclei are visualized with Hoechst staining (n = 3). b Gene expression levels of GLUT1 and c PDK1 in ARPE-19 cells exposed to heme (5–50 μM). d Lactate concentration in the supernatants of ARPE-19 cells exposed to heme (5–50 μM). NC: non-treated cells. Data are represented as mean value ± SEM. Statistical analysis was performed by one-way ANOVA test followed by Bonferroni correction.
Fig. 5
Fig. 5
Inhibition of HO-1 does not aggravate heme-induced VEGFA production in ARPE-19 cells. a Gene expression and b VEGFA protein levels measured by ELISA in ARPE-19 cells exposed to heme (25 μM) and SnPPIX (25 μM). c Gene expression levels of GLUT1 and d PDK1 in ARPE-19 cells to heme (25 μM) and SnPPIX (25 μM). e Gene expression levels of VEGFA and f HO-1 in HO-1-silenced ARPE-19 cells exposed to heme (5–50 μM). g Gene expression levels of VEGFA in ARPE-19 cells exposed to heme (25 μM) alone or in complex with A1M (12.5 μM) NC: non-treated cells; A1M: alpha-1-microglobulin. Data are represented as mean value ± SEM (n = 3). NC: non-treated cells Statistical analysis was performed by one-way ANOVA test followed by Bonferroni correction. A value of p < 0.05 was considered significant.
Fig. 6
Fig. 6
TLR4 is not connected to heme-induced VEGF production in ARPE-19 cells. a VEGF gene expression and b protein levels in ARPE-19 cells exposed to heme (25 μM) and TAK-242 (3 μM). c Gene expression levels of GLUT1 and d PDK1 in ARPE-19 cells exposed to heme (25 μM) and TAK-242. NC: non-treated cells, TLR4: Toll-like receptor 4 (n = 3). Statistical analysis was performed by one-way ANOVA test followed by Bonferroni correction. A value of p < 0.05 was considered significant.
Fig. 7
Fig. 7
Heme induces VEGFA production via PI3K/Akt pathway in ARPE-19 cells. a Immunoblot analysis of Akt (Ser 473) phosphorylation in response to heme (5–25 μM, n = 3). Immunoblots are cropped from different parts of the same gel. Uncropped immunoblots are presented in the Supplementary information. b Immunofluorescent analysis of Akt (Ser 473) phosphorylation in response to heme (5–25 μM; n = 3). c Gene expression and d VEGFA protein levels in ARPE-19 cells exposed to heme (25 μM) and LY294002. e Gene expression levels of GLUT1 and f PDK1 in ARPE-19 cells exposed to heme (25 μM) and LY294002. NC: non-treated cells. Data are represented as mean value ± SEM (n = 6). Statistical analysis was performed by one-way ANOVA test followed by Bonferroni correction. A value of p < 0.05 was considered significant.
Fig. 8
Fig. 8
HIF-1α inhibitor BAY 87–2243 and mTOR inhibitor rapamycin reduce heme-induced VEGFA production in ARPE-19 cells. a VEGFA gene expression and b protein levels in ARPE-19 cells exposed to heme (25 μM) and BAY 87–2243 (20–80 nM). c Gene expression levels of GLUT1 and d PDK1 in ARPE-19 cells exposed to heme (25 μM) and BAY 87–2243 (20–80 nM). NC: non-treated cells. e VEGFA gene expression and f protein levels in ARPE-19 cells exposed to heme (25 μM) and Rapamycin (100 nM). g Gene expression levels of GLUT1 and h PDK1 in ARPE-19 cells exposed to heme (25 μM) and Rapamycin. NC: non-treated cells. Data are represented as mean value ± SEM (n = 6). Statistical analysis was performed by one-way ANOVA test followed by Bonferroni correction. A value of p < 0.05 was considered significant.
Fig. 9
Fig. 9
ER stress are not connected to heme-induced VEGFA production in ARPE-19 cells. a CHOP gene expression in ARPE-19 cells exposed to heme (25 μM) and the PERK inhibitor GSK2656157 (1 μM). b VEGFA gene expression and c protein levels in ARPE-19 cells exposed to heme (25 μM) and the PERK inhibitor GSK2656157 (1 μM). NC: non-treated cells. d Gene expression levels of GLUT1 and e PDK1 in ARPE-19 cells exposed to heme (25 μM) and the PERK inhibitor GSK2656157(1 μM). NC: non-treated cells. Data are represented as mean value ± SEM (n = 6). Statistical analysis was performed by one-way ANOVA test followed by Bonferroni correction. A value of p < 0.05 was considered significant.
Fig. 10
Fig. 10
Metabolic shift towards glycolysis in ARPE-19 cells exposed to heme. a Mito Stress Profile of ARPE-19 cells exposed to heme (5–50 μM) and heme (25 μM) + BAY 87–2243 (80 nM) or LY294002 (50 μM) or Rapamycin (100 nM). NC: non-treated cells. Data are represented as mean value ± SEM (n = 3). Statistical analysis was performed by one-way ANOVA test followed by Bonferroni correction. A value of p < 0.05 was considered significant. b Basal respiration, c maximal respiration, d spare respiratory capacity, and e ATP production of ARPE-19 cells exposed to heme (5–50 μM) and heme (25 μM) + BAY 87–2243 (80 nM) or LY294002 (50 μM) or Rapamycin (100 nM). NC: non-treated cells. Data are represented as mean value ± SEM (n = 3). Statistical analysis was performed by one-way ANOVA test followed by Bonferroni correction. A value of p < 0.05 was considered significant. f Glycolysis Stress Profile of ARPE-19 cells exposed to heme (5–50 μM) and heme (25 μM) + BAY 87–2243 (80 nM) or LY294002 (50 μM) or Rapamycin (100 nM). NC: non-treated cells. Data are represented as mean value ± SEM (n = 3). Statistical analysis was performed by one-way ANOVA test followed by Bonferroni correction. A value of p < 0.05 was considered significant. g Glycolysis, h glycolytic capacity, and i glycolytic reserve of ARPE-19 cells exposed to heme (5–50 μM) and heme (25 μM) + BAY 87–2243 (80 nM) or LY294002 (50 μM) or Rapamycin (100 nM). NC: non-treated cells. Data are represented as mean value ± SEM (n = 3). Statistical analysis was performed by one-way ANOVA test followed by Bonferroni correction. A value of p < 0.05 was considered significant.
Fig. 11
Fig. 11
Oxidative stress and antioxidant response of ARPE-19 cells in response to heme. a Significantly induced differently expressed genes (DEGs) identified in ARPE-19 cells exposed to heme (25 μM) compared to the control (n = 3). FC: fold induction, p (corr): corrugated p values. b Detection of reactive oxygen species in ARPE-19 cells using CellRox staining. Nuclei were visualized with Hoechst. c Detection of lipid peroxidation in ARPE-19 cells using BODIPY™ 581/591C11 reagent. Nuclei were visualized with Hoechst. d Ratio of 590/510 nm fluorescence intensities quantitated using LasX software. Ratios of the signal from red to green channels were used to quantify lipid peroxidation in cells (n = 3).
Fig. 12
Fig. 12
Heme induces the aggregation of mitochondria in ARPE-19 cells. a ARPE-19 cells were exposed to heme (25 μM) alone or in combination with BAY 87–2243 (80 nM) or Rapamycin (100 nM) followed by Mitotracker Red staining (n = 3). Nuclei were visualized by Hoechst. White arrows indicate aggregated mitochondria. b Quantification of Region of interest (ROI). Ten individual ROIs (1 μm2) were quantified and data are represented as mean value ± SEM. Statistical analysis was performed by one-way ANOVA test followed by Bonferroni correction. A value of p < 0.05 was considered significant.
Fig. 13
Fig. 13
Hemoglobins induce VEGF, PDK-1, and GLUT-1 expressions in ARPE-19 cells. a VEGFA, b HO-1, c GLUT-1, and d PDK-1 gene expression levels in ARPE-19 cells exposed to heme (25 μM), OxyHb (100 μM), MetHb (100 μM), and FerrylHb (100 μM) for 24 h. NC: non-treated cells, Hb: hemoglobin. e Oxidation process of OxyHb in ARPE-19 cell cultures measured by the oxidation states of the heme-iron by analyzing the absorbance spectra (500–650 nm) of Hbs. MetHb was used as a control of Hb oxidation. f Hb ratios were calculated as described previously by Winterbourn [95]. g Hb oxidation in cell culture supernatants was analyzed using immunoblotting by detecting of cross-linked Hb, using HRP-conjugated goat anti-human Hb polyclonal antibody. Bovine serum albumin (BSA) as a loading control was detected in cell culture supernatants with anti-BSA specific antibody NC: non-treated cells. Data are represented as mean value ± SEM (n = 3). Statistical analysis was performed by one-way ANOVA test followed by Bonferroni correction. A value of p < 0.05 was considered significant.

References

    1. Wright W.S., Eshaq R.S., Lee M., Kaur G., Harris N.R. Retinal physiology and circulation: effect of diabetes. Compr. Physiol. 2020;10:933–974. doi: 10.1002/cphy.c190021. - DOI - PMC - PubMed
    1. Singh C. Metabolism and vascular retinopathies: current perspectives and future directions. Diagnostics. 2022;12 doi: 10.3390/diagnostics12040903. - DOI - PMC - PubMed
    1. Woods J., Biswas S. Retinopathy of prematurity: from oxygen management to molecular manipulation. Mol Cell Pediatr. 2023;10:12. doi: 10.1186/s40348-023-00163-5. - DOI - PMC - PubMed
    1. Li Q., Han T., Wang Z., Tang H., Feng Z. Clinical characteristics, risk factors and short-term prognosis of retinopathy of prematurity complicated with retinal hemorrhage. Eur. J. Ophthalmol. 2022 doi: 10.1177/11206721221136314. - DOI - PubMed
    1. Terry T.L. Fibroblastic overgrowth of persistent tunica vasculosa lentis in infants born prematurely: II. Report of cases-clinical aspects. Trans. Am. Ophthalmol. Soc. 1942;40:262–284. - PMC - PubMed

MeSH terms

Substances

LinkOut - more resources