. 2024 Oct:76:103346.
doi: 10.1016/j.redox.2024.103346. Epub 2024 Sep 7.

LOX-mediated ECM mechanical stress induces Piezo1 activation in hypoxic-ischemic brain damage and identification of novel inhibitor of LOX

Affiliations

LOX-mediated ECM mechanical stress induces Piezo1 activation in hypoxic-ischemic brain damage and identification of novel inhibitor of LOX

Dongya Jiang et al. Redox Biol. 2024 Oct.

Abstract

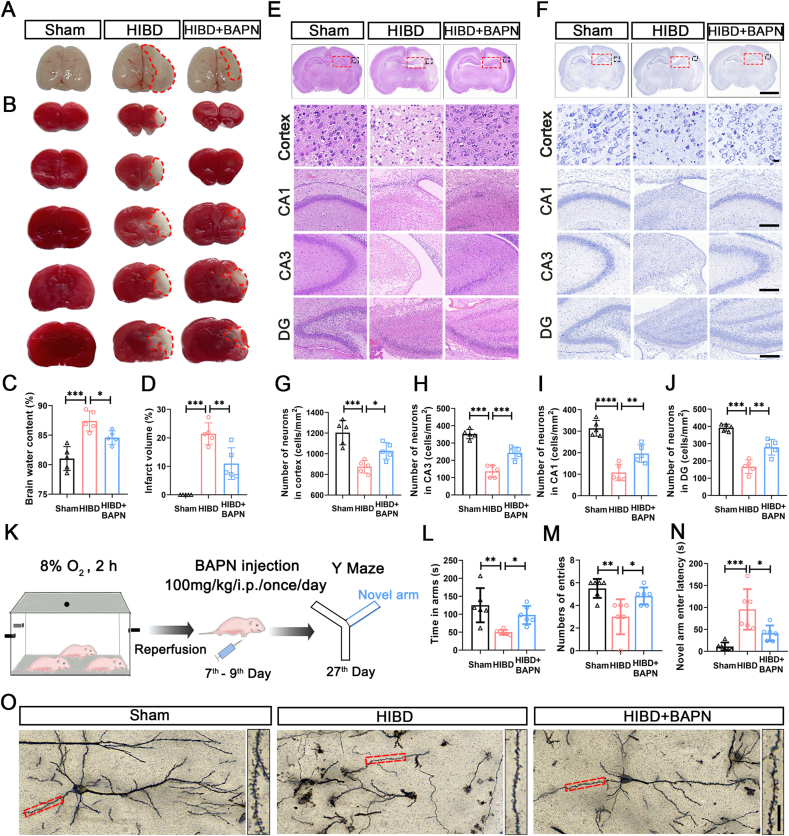
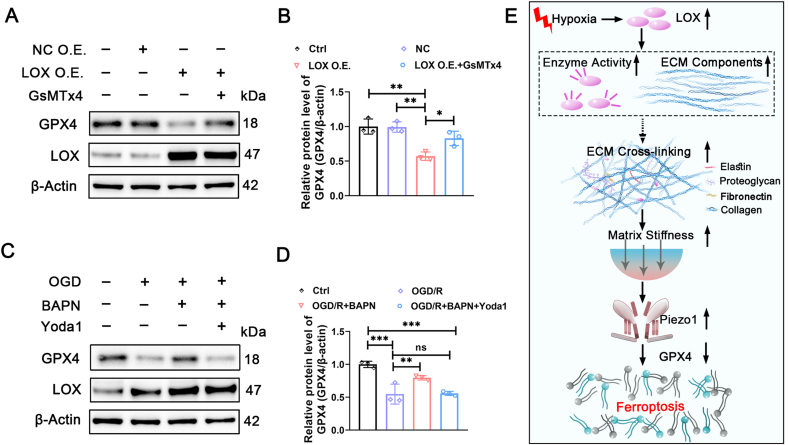
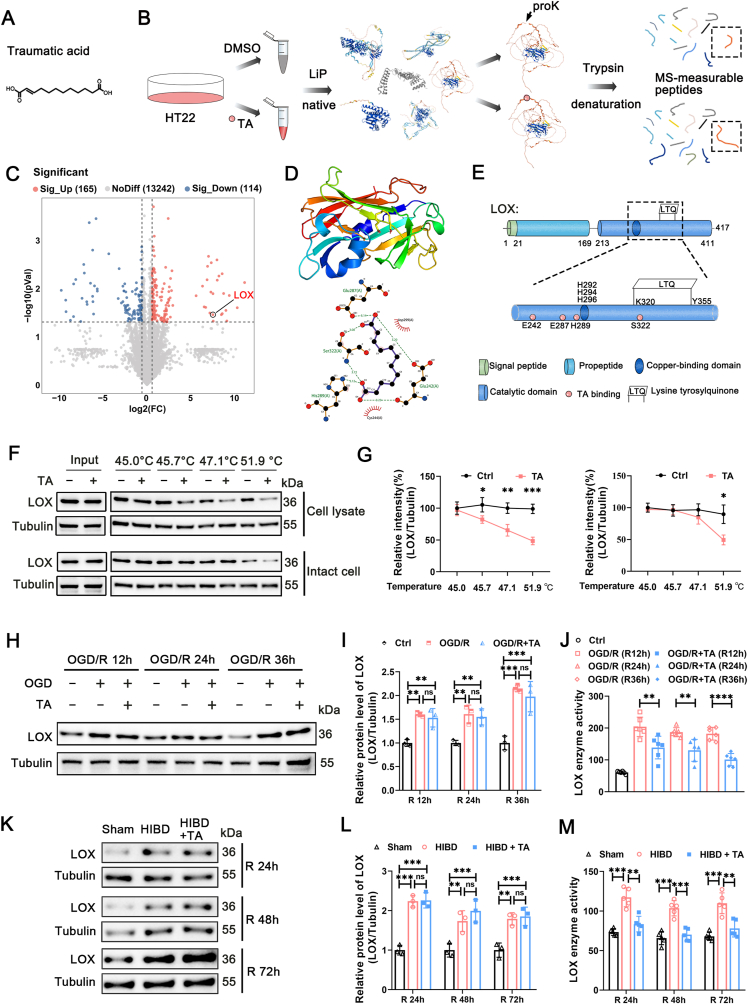
Hypoxic-ischemic encephalopathy (HIE) poses a significant challenge in neonatal medicine, often resulting in profound and lasting neurological deficits. Current therapeutic strategies for hypoxia-ischemia brain damage (HIBD) remain limited. Ferroptosis has been reported to play a crucial role in HIE and serves as a potential therapeutic target. However, the mechanisms underlying ferroptosis in HIBD remain largely unclear. In this study, we found that elevated lysyl oxidase (LOX) expression correlates closely with the severity of HIE, suggesting LOX as a potential biomarker for HIE. LOX expression levels and enzymatic activity were significantly increased in HI-induced neuronal models both in vitro and in vivo. Notably, we discovered that HI-induced brain tissue injury results in increased stiffness and observed a selective upregulation of the mechanosensitive ion channel Piezo1 in both brain tissue of HIBD and primary cortex neurons. Mechanistically, LOX increases its catalytic substrates, the Collagen I/III components, promoting extracellular matrix (ECM) remodeling and possibly mediating ECM cross-linking, which leads to increased stiffness at the site of injury and subsequent activation of the Piezo1 channel. Piezo1 senses these stiffness stimuli and then induces neuronal ferroptosis in a GPX4-dependent manner. Pharmacological inhibition of LOX or Piezo1 ameliorated brain neuronal ferroptosis and improved learning and memory impairments. Furthermore, we identified traumatic acid (TA) as a novel LOX inhibitor that effectively suppresses LOX enzymatic activity, mitigating neuronal ferroptosis and promoting synaptic plasticity. In conclusion, our findings elucidate a critical role for LOX-mediated ECM mechanical stress-induced Piezo1 activation in regulating ferroptotic cell death in HIBD. This mechanistic insight provides a basis for developing targeted therapies aimed at ameliorating neurological outcomes in neonates affected by HIBD.

Keywords: Ferroptosis; HIBD; LOX; Piezo1; TA.


Conflict of interest statement

Declaration of competing interest The authors declare that they have no known competing financial interests or personal relationships that could have appeared to influence the work reported in this paper.

Figures

Image 1
Graphical abstract
Fig. 1
Fig. 1
LOX is associated with HIE and is upregulated in neurons induced by hypoxia-ischemia both in vitro and in vivo. (A) Schematic diagram of neonate samples collection and experimental design. (B) Quantification of the LOX expression in peripheral blood of HIE and control subjects by qPCR. (C) ROC curve analysis of LOX to distinguish between neonates with and without HIE. (D) Schematic diagram illustrating the construction of the HIBD model. (E) Representative images of LOX (green) and neuron (NeuN, red) in cortex, CA1, CA3, DG regional of hippocampus in HIBD brains at 72 h post-surgy. Scale bar = 50 μm. (F) Quantitative analysis of the relative fluorescence intensity of LOX + NeuN + in the Cortex, CA1, and CA3 of sham and HIBD group (n = 5 rats per group). (G–H) Immunoblotting and statistical analysis of LOX protein levels in HIBD-injured brain tissues at 72 h post-surgy (n = 3 independent experiments). (I) Schematic drawing of in vitro experiments. (J) Representative images of LOX (red) in HT22 cells and LOX (green) in primary cortical neurons (TUBB3, red). Scale bar = 50 μm. (K) Quantification of LOX fluorescence intensity in HT22 and primary cortical neurons. (L) Immunoblotting shows LOX protein levels in OGD/R-induced HT22 (n = 3 independent experiments). (M) Statistical analysis of the immunoblotting results from L. Data are presented as mean with SD. *p < 0.05, **p < 0.01, ***p < 0.001, ****p < 0.0001. (For interpretation of the references to color in this figure legend, the reader is referred to the Web version of this article.)
Fig. 2
Fig. 2
Inhibition of LOX by BAPN effectively mitigates HI-induced brain injury and improves cognitive function in rats with HIBD. (A) Morphology of cerebral edema in sham, HIBD and BAPN intervention groups (100 mg/kg/ip/day) at 72 h post-surgery. (B) TTC staining of cerebral infarction in sham, HIBD, and BAPN intervention groups at 72 h post-surgery (Dashed area represents the infarcted brain region). (C) Statistics analysis of brain water content from A (n = 5 rats/group). (D) Quantification of infarct area in B (n = 5 rats/group). HE staining (E) and Nissl staining (F) of the whole brain sections with enlarged views of cortex and hippocampus regions in sham, HIBD and BAPN intervention groups. Scale bar = 2.5 mm, enlarged scale bar = 250 μm. Statistics analysis of the number of neurons (cells/mm2) in the cortex (G), CA3 (H), CA1 (I) and DG (J) regions of the hippocampus in sham, HIBD, and BAPN intervention groups (n = 5 rats/group). (K) Schematic drawing of the Y Maze test. Quantitative analysis of the time spent in the novel arm (L), the number of entries into the novel arm (M), and the latency to enter the novel arm (N) (n = 6 rats/group). (O) Golgi staining in the cortical regions in sham, HIBD, and BAPN intervention groups. Scale bar = 10 μm. Data are presented as mean with SD. *p < 0.05, **p < 0.01, ***p < 0.001, ****p < 0.0001.
Fig. 3
Fig. 3
LOX induces GPX4-dependent ferroptosis in HI-induced neuronal injury. (A) Cell viability in BAPN treated OGD/R-induced HT22 cells at reoxygenation 0 h, 12 h and 24 h. (B) Representative TEM images of mitochondrial morphology in BAPN-incubated HT22 cells under OGD/R-induced conditions. Green arrows indicate normally shaped mitochondria, black arrows indicate damaged mitochondria. Scale bar = 400 nm. (C) Quantification the ratio of mitochondria containing cristae to the total number of mitochondria in B (n = 6 cells/group). (D) Representative images of GPX4 (green) and Fe2+ (red) in BAPN-treated OGD/R-induced HT22 cells. Scale bar = 20 μm. (E) Quantification of Fe2+ and GPX4 fluorescence intensity in D. (F) Representative images of Fe2+ (red) and ROS (red) in LOX-overexpression HT22 cells. Scale bar = 20 μm. (G) Quantification of the Fe2+ and ROS fluorescence intensity in F. (H) Immunoblotting showing GPX4 and LOX protein levels in HT22 cells infected with Lenti-LOX at different multiplicities of infection (MOI). (I) Statistics analysis of the GPX4 and LOX protein levels in H. (J) Representative images of GPX4 (green) and neurons (NeuN, red) in the cortex, and CA3 region of the hippocampus in HIBD brains at 72 h post-surgery. Scale bars = 50 μm. Quantification of GPX4+NeuN+ fluorescence intensity in the cortex (K) and CA3 region of hippocampus (L) from I (n = 5 rats per group). Data are presented as mean with SD. *p < 0.05, **p < 0.01, ***p < 0.001, ****p < 0.0001. (For interpretation of the references to color in this figure legend, the reader is referred to the Web version of this article.)
Fig. 4
Fig. 4
Piezo1 activation is involved in LOX-induced neuronal ferroptosis. (A) Volcano plot illustrating the differentially expressed genes in OGD/R-induced primary cortex neurons compared to untreated neurons. (B) GO enrichment analysis of the top 10 terms in OGD/R-induced primary cortex neurons compared to untreated neurons. (C) KEGG enrichment analysis of the top 10 terms in OGD/R-induced primary cortex neurons compared to untreated neurons. (D) GSEA analysis of differentially expressed genes related to cellular response to mechanical stimulus in primary cortex neurons following OGD/R-treatment. (E) Dysregulated genes in the KEGG term for cellular response to mechanical stimulus in OGD/R-induced primary cortex neurons compared to untreated neurons. (F) Representative images of Piezo1 (green) and neuron (TUBB3, red) in OGD/R-induced primary cortex neurons. Scale bars = 100 μm. (G) Quantification of the relative fluorescence intensity of Piezo1 from F. (H) Representative confocal images of [Ca2+]i staining using Fluo-4/AM in primary neurons. Scale bars = 50 μm. (I) Quantification of the [Ca2+]i fluorescence intensity from H. (J) Representative images of Piezo1 in HIBD brain tissues at 72 h post-surgery. Scale bars = 10 μm. (K) Quantification of the Piezo1 fluorescence intensity from J (n = 5 rats per group). (L) Immunoblotting shows the Piezo1, YAP, and TAZ protein levels in HIBD injured brain tissues at 72 h post-surgery. (M) Statistics analysis of the Piezo1, YAP, and TAZ protein levels in L. Data are presented as mean with SD. *p < 0.05, **p < 0.01, ***p < 0.001. (For interpretation of the references to color in this figure legend, the reader is referred to the Web version of this article.)
Fig. 5
Fig. 5
LOX mediate the activation of Piezo1 by increasing ECM stiffness through enhancing ECM components. (A) Immunoblotting shows the Piezo1 level in LOX-overexpression HT22 cells. (B) Representative images of [Ca2+]i staining using Fluo-4/AM in control, negative control, LOX overexpression, and LOX overexpression combined with GsMTx4 treatment groups of HT22 cells. Scale bars = 25 μm. (C) Quantification of the [Ca2+]i fluorescence intensity from B. (D) Representative images showing [Ca2+]i staining using Fluo-4/AM in control, OGD/R-treated, BAPN-treated OGD/R-induced, and BAPN combined with Yoda1-treated OGD/R-induced HT22 cells. Scale bars = 25 μm. (E) Statistical analysis of the [Ca2+]i fluorescence intensity from D. (F) Schematic drawing of AFM measurements of brain slice. (G) Representative images showing the 3D structural diagram, the force map, and the statistical analysis of the Young's modulus measured in HIBD brain tissue. (H–I) Immunoblotting and quantification of the Collagen I and Collagen III protein levels in LOX-overexpression HT22 cells. (J, L) Representative images showing the Collagen I/III/Ⅳ/ELN (green) and neurons (Tubb3, red) in OGD/R-induced primary neuron. Scale bars = 100 μm. (K, M) Quantification of Collagen I/III/Ⅳ/ELN fluorescence intensity from J and L. (N–O) Immunoblotting and quantification of the Collagen I and Collagen III protein levels in brain tissue of HIBD rats. (P–Q) Immunoblotting and quantification of LOX, Piezo1, and Collagen III protein levels in brain tissue from rats with LOX overexpression. Data are presented as mean with SD. *p < 0.05, **p < 0.01, ***p < 0.001, ****p < 0.0001. (For interpretation of the references to color in this figure legend, the reader is referred to the Web version of this article.)
Fig. 6
Fig. 6
Targeting Piezo1 mitigates nerve damage and cognitive impairment in HIBD rats. (A) The morphology of cerebral edema in sham, HIBD, and GsMTx4 intervention groups (50 nM/icv) at 72 h post-surgery (n = 5 rats/group). (B) Statistics analysis of the brain water content from A. (C) TTC staining of the cerebral infarction in sham, HIBD, and GsMTx4 intervention groups at 72 h post-surgery (Red dashed area represents the infarcted brain region). (D) Quantification of the infarct area in C. (E) Nissl staining of the whole brain with enlarged cortex and hippocampus regions in sham, HIBD and GsMTx4 intervention groups. Scale bar = 2.5 mm, enlarged scale bar = 50 μm. Statistics analysis of the number of neurons (cells/mm2) in cortex (F), CA1 (G), and CA3 (H) regions in sham, HIBD, and GsMTx4 intervention groups (n = 5 rats/group). (I) Representative images of GPX4 (green) and neurons (NeuN, red) in the cortex and CA1 region of the hippocampus in GsMTx4-treated HIBD rats. Scale bars = 100 μm. (J–K) Quantification of the GPX4 fluorescence intensity from I (n = 5 rats/group). (L) Schematic drawing of the MWM test. (M) Representative training trajectory of rats in sham, HIBD and GsMTx4 treated HIBD groups in the MWM test. (N) Quantitative analysis of the escape latency during MWM training sessions from day 2 to day 5. Blue circle indicates the hidden platform. (O) Representative trajectories of rats in sham, HIBD and GsMTx4 treated HIBD group in the MWM test. Black circle indicates the removed platform. Quantitative analysis of the time in correct quadrant (P), the crossing platform frequency (Q), and the entry latency (R) of rats in O (n = 6/groups). Data are presented as mean with SD. *p < 0.05, **p < 0.01, ***p < 0.001, ****p < 0.0001. (For interpretation of the references to color in this figure legend, the reader is referred to the Web version of this article.)
Fig. 7
Fig. 7
LOX-mediated neuronal ferroptosis requires Piezo1 activation. (A) Protein levels of GPX4 and LOX in control, negative control, LOX overexpression, and LOX overexpression with GsMTx4 treatment groups. (B) Statistics analysis of GPX4 protein levels in A. (C) Protein levels of GPX4 and LOX in the control, OGD/R-induced, BAPN-treated OGD/R, and BAPN combined with Yoda1 treatment groups of HT22 cells. (D) Statistics analysis of the GPX4 protein levels in C. (E) LOX working model. HI induces LOX overexpression and enzymatic activity, leading to increased expression of Collagen components, enhancing extracellular collagen cross-linking and mechanotransduction, thereby activating neuronal Piezo1 ion channels, ultimately resulting in neuronal ferroptosis. *p < 0.05, **p < 0.01, ***p < 0.001.
Fig. 8
Fig. 8
Identification of TA as a specific inhibitor of LOX enzyme activity. (A) Structural formula of TA. (B) Schematic diagram of Lip-SMap assay. (C) Volcano map depicting potential binding proteins of TA. Red and blue dot indicate proteins upregulated and downregulated, respectively, in HT22 cells. (D) Representative images of autodocking of TA and LOX. (E) Schematic diagram of TA binding site on the LOX protein domain. (F) CETSA-Western blot analysis to detect the interaction between TA and LOX in cell lysate and intact cell of HT22. (G) Statistical analysis of LOX intensity in F. (H) Western blot analysis of LOX expression o in HT22 cells post reoxygenation for 12 h, 24 h, and 36 h, respectively. (I) Statistics analysis of the LOX protein levels in H. (J) ELISA analysis of LOX enzyme activity in HT22 cells post-reoxygenation for 12 h, 24 h, and 36 h, respectively. (K) LOX expression in rats at 24 h, 48 h, and 72 h post-surgery. (L) Statistics analysis of the LOX protein levels in K. (M) LOX enzyme activity in rats at 24 h, 48 h, and 72 h post-surgery. Data were presented as mean with SD. *p < 0.05, **p < 0.01, ***p < 0.001, ****p < 0.0001. (For interpretation of the references to color in this figure legend, the reader is referred to the Web version of this article.)
Fig. 9
Fig. 9
TA administration suppressed neuronal ferroptosis induced by HI. (A) Representative images of Fe2+ staining in HT22 cells and in primary cortical neurons. Scale bar = 5 μm. (B) Statistical analysis of Fe2+ fluorescence intensity in A. (C) Representative images of ROS staining in HT22 cells and primary cortical neurons. Scale bar = 50 μm. (D) Statistical analysis of ROS fluorescence intensity in HT22 cells and primary cortical neurons in C. (E) Representative images of MitoTracker staining of mitochondrial activity in HT22 cells and in primary cortical neurons. Scale bar = 10 μm. (F) Statistical analysis of MitoTracker fluorescence intensity in E. (G) TEM analysis of mitochondrial morphology in HT22 cells. Green arrows indicate normally shaped mitochondria, black arrows indicate damaged mitochondria. (H) Immunofluorescence staining of GPX4 in cortical neurons. Scale bar = 100 μm. (I) Statistical analysis of GPX4 fluorescence intensity in H. (J) Immunoblotting of GPX4 in OGD/R-induced HT22 cells. (K) Statistical analysis of GPX4 fluorescence intensity of in J. Data are presented as mean with SD. *p < 0.05, **p < 0.01, ***p < 0.001, ****p < 0.0001. (For interpretation of the references to color in this figure legend, the reader is referred to the Web version of this article.)
Fig. 10
Fig. 10
TA reduces nerve damage in neonatal HIBD rats. (A) Morphology of cerebral edema in the brain of rats at 72 h post-surgery. (B) Statistics analysis of the brain water content from A. (C) TTC staining of the cerebral infarction brain of rats at 72 h post-surgery. (D) Quantification of the infarct area in C. HE staining (E) and Nissl staining (F) of whole brain with enlarged cortex and hippocampus regions in brain of rats at 72 h post-surgery. Scale bar = 2.5 mm, Scale bar = 50 μm, and Scale bar = 250 μm, respectively. Statistics analysis of neuron density (cells/mm2) in cortex (G), CA1 (H) and CA3 (I) regions of hippocampus pus in F. *p < 0.05, **p < 0.01, ***p < 0.001, ****p < 0.0001.
Fig. 11
Fig. 11
TA mitigates HI-induced spatial memory deficits and restores dendritic spine number in rats. (A) Representative training trajectory of rats in the MWM test. (B) Quantitative analysis of the escape latency during MWM training sessions spanning from day 2 to day 5. (C) Representative trajectories of rats in the MWM test. Black circle indicates the removed platform. Quantitative analysis of the time spent in the correct quadrant (D) and frequency of platform crossings (E) in C. (F) Representative trajectory of rats in the Y maze test. Quantitative analysis of latency to enter the novel arm (G) and frequency of entries into the novel arm (H) in F. Quantitative analysis of dendritic spine numbers in cortical (I) and hippocampal regions (J) in K. (K) Golgi staining in the cortical and hippocampal regions in rats. Scale bar = 10 μm. Data are presented as mean with SD. *p < 0.05, **p < 0.01, ***p < 0.001, ****p < 0.0001.

References

    1. Greco P., Nencini G., Piva I., Scioscia M., Volta C.A., Spadaro S., Neri M., Bonaccorsi G., Greco F., Cocco I., Sorrentino F., D'Antonio F., Nappi L. Pathophysiology of hypoxic-ischemic encephalopathy: a review of the past and a view on the future. Acta Neurol. Belg. 2020;120:277–288. - PubMed
    1. Yang L., Zhao H., Cui H. Treatment and new progress of neonatal hypoxic-ischemic brain damage. Histol. Histopathol. 2020;35:929–936. - PubMed
    1. Douglas-Escobar M., Weiss M.D. Hypoxic-ischemic encephalopathy: a review for the clinician. JAMA Pediatr. 2015;169:397–403. - PubMed
    1. Wassink G., Davidson J.O., Dhillon S.K., Zhou K., Bennet L., Thoresen M., Gunn A.J. Therapeutic hypothermia in neonatal hypoxic-ischemic encephalopathy. Curr. Neurol. Neurosci. Rep. 2019;19(2) - PubMed
    1. Fabres R.B., Nunes R.R., de Medeiros de Mattos M., Andrade M.K.G., Martini A.P.R., Tassinari I.D., Sanches E.F., de Fraga L.S., Netto C.A. Therapeutic hypothermia for the treatment of neonatal hypoxia-ischemia: sex-dependent modulation of reactive astrogliosis. Metab. Brain Dis. 2022;37:2315–2329. - PubMed

Publication types