. 2024 Oct 17;187(21):5951-5966.e18.
doi: 10.1016/j.cell.2024.08.018. Epub 2024 Sep 10.

Biomolecular condensates regulate cellular electrochemical equilibria

Affiliations

Biomolecular condensates regulate cellular electrochemical equilibria

Yifan Dai et al. Cell. .

Abstract

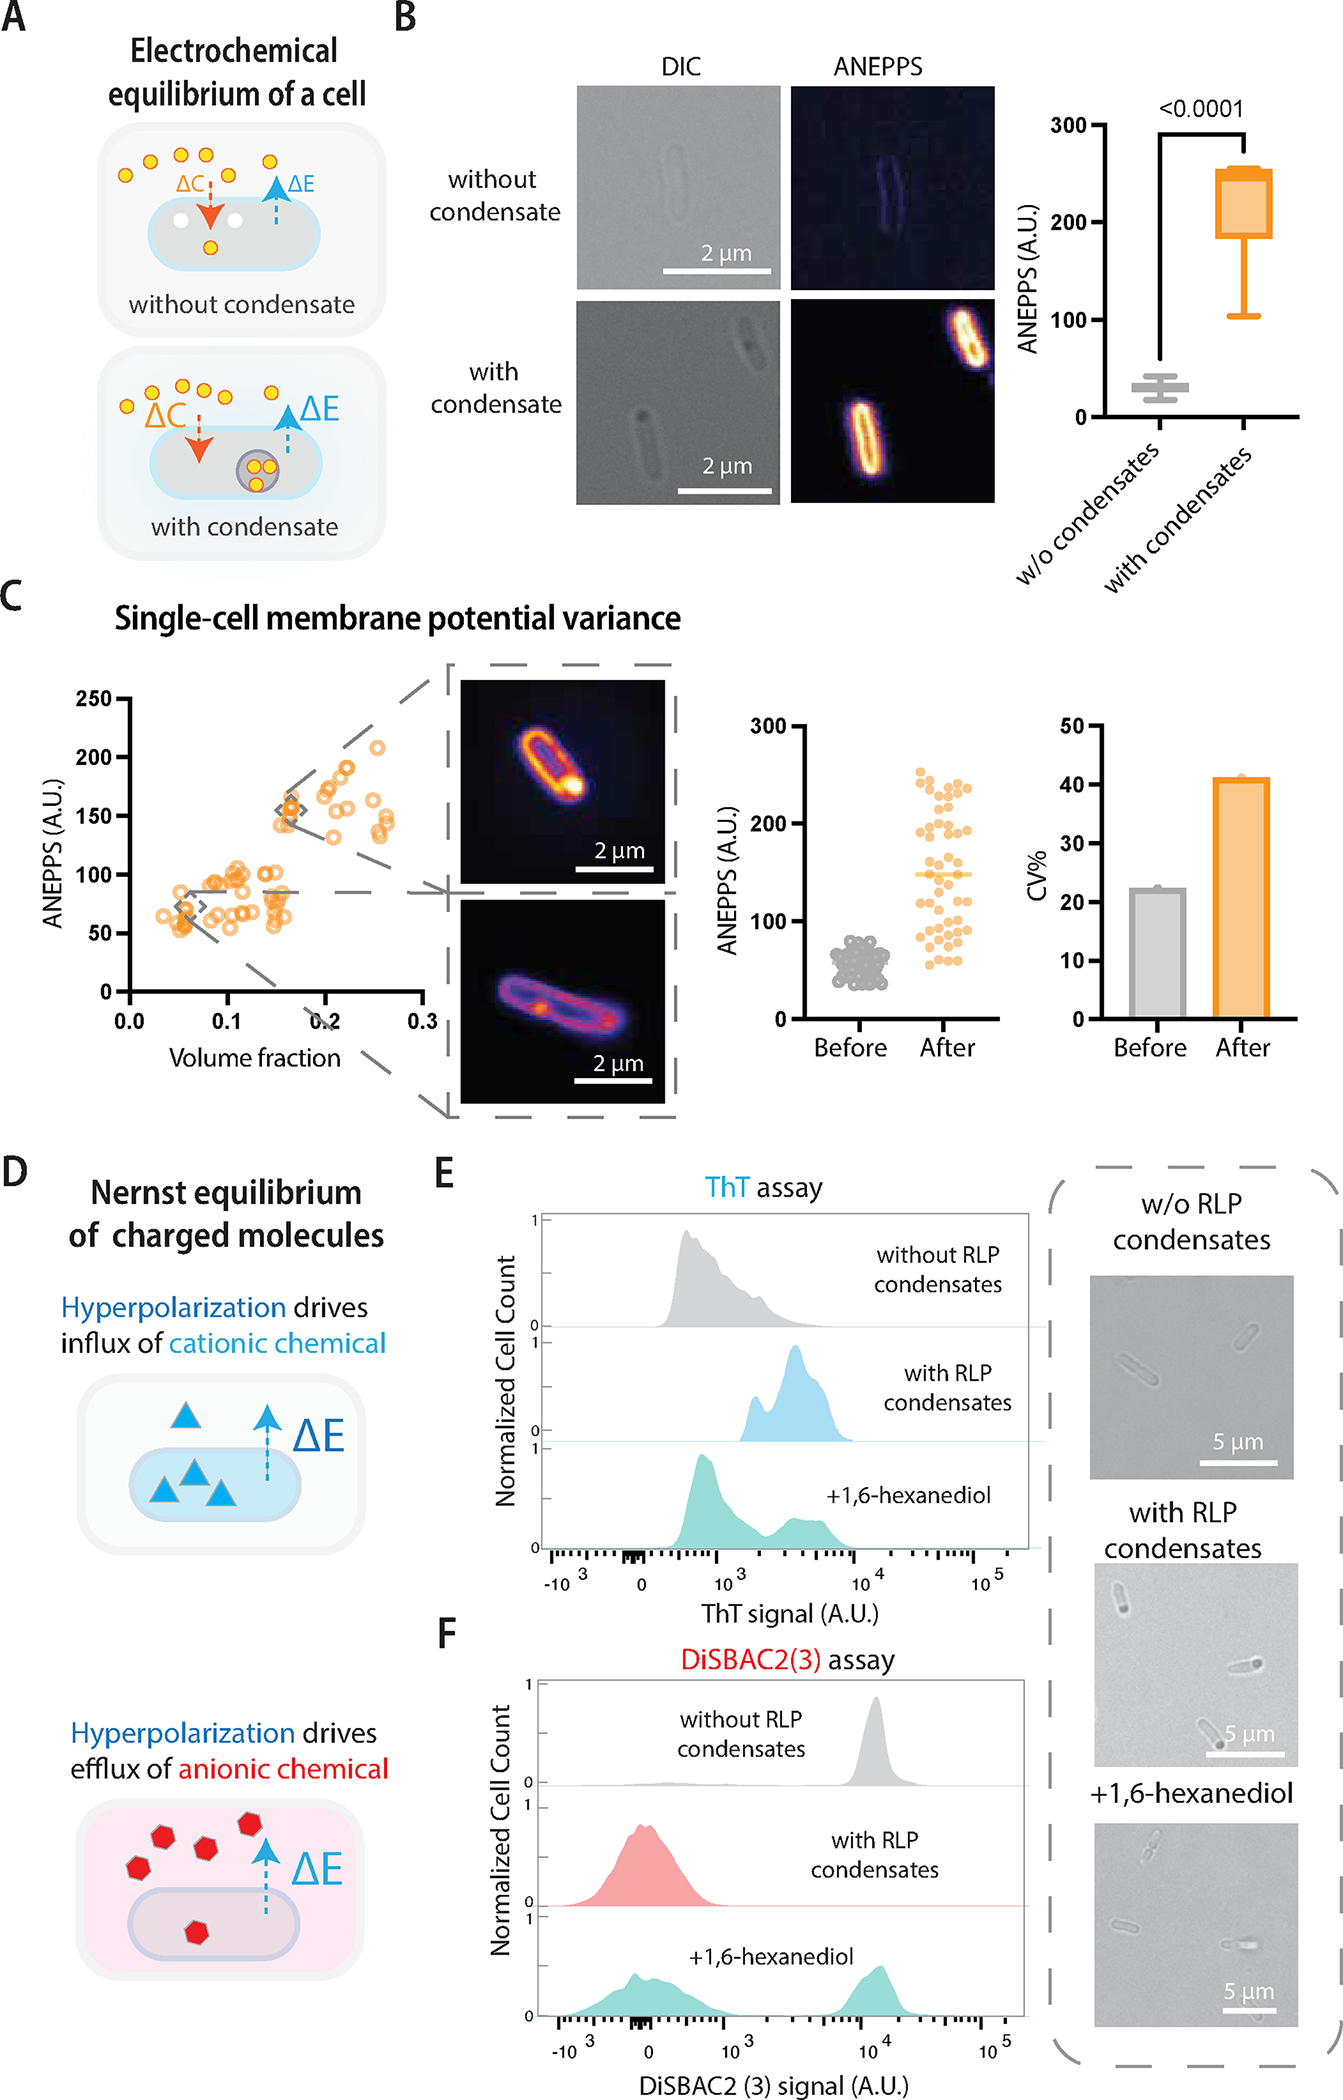
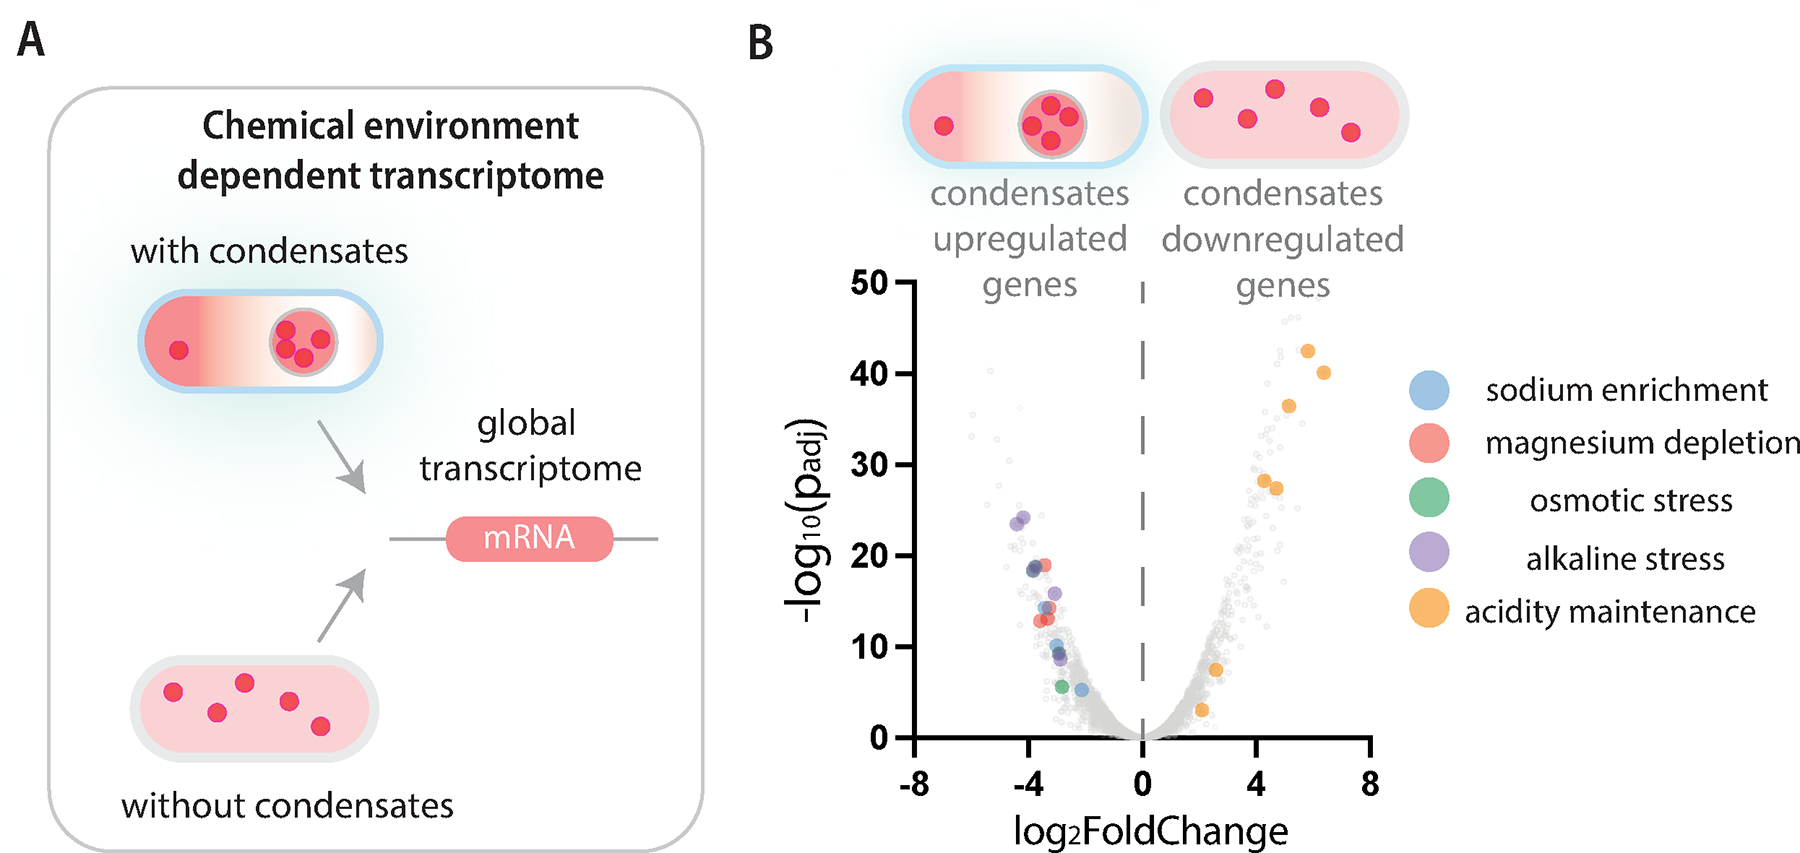
Control of the electrochemical environment in living cells is typically attributed to ion channels. Here, we show that the formation of biomolecular condensates can modulate the electrochemical environment in bacterial cells, which affects cellular processes globally. Condensate formation generates an electric potential gradient, which directly affects the electrochemical properties of a cell, including cytoplasmic pH and membrane potential. Condensate formation also amplifies cell-cell variability of their electrochemical properties due to passive environmental effect. The modulation of the electrochemical equilibria further controls cell-environment interactions, thus directly influencing bacterial survival under antibiotic stress. The condensate-mediated shift in intracellular electrochemical equilibria drives a change of the global gene expression profile. Our work reveals the biochemical functions of condensates, which extend beyond the functions of biomolecules driving and participating in condensate formation, and uncovers a role of condensates in regulating global cellular physiology.

Keywords: antibiotics; biomolecular condensates; electrochemical features of condensates; global cellular physiology; intracellular electrochemistry; ion flux; membrane potential.


Conflict of interest statement

Declaration of interests The authors declare no competing interests.

Figures

Figure 1.
Figure 1.. Condensate formation modulates cytoplasmic ion abundance.
A, Phase transition of associative macromolecules can lead to segregation or exclusion of specific types of ions, which can modulate the intracellular ion distribution. B, Condensate formation mediates a distinct cytoplasmic pH condition as evaluated by C-SNARF-4-AM assay. Line profile shows the spatial pH condition of cells with or without condensates. Lower the C-SNARF-4 ratio corresponds to more basic pH. C, Inductively coupled plasma mass spectrometry (ICP-MS) analysis of the effects of phase transition of an RLP on cytoplasmic ion concentration. Upper critical solution temperature (UCST) transition behavior is utilized to dissolve RLP condensates by increasing the solution temperature above the transition temperature of the RLP. The supernatant fraction corresponds to the condition of cytoplasm. The supernatant is treated with proteinase K (a final concentration of 0.4 units/mL) and benzonase nuclease (25 units/mL) before analysis by ICP-MS. The ICP-MS result was converted back to estimated cellular ion concentration through cell density and dilution ratio based on the sample processing methods. D, Cytoplasmic ion concentration of sodium, potassium, magnesium and calcium ions at conditions with or without RLP condensates. Two-tailed t-test for statistical analysis. ns = non-significant. Data are represented as mean ± SD.
Figure 2.
Figure 2.. Condensate formation increases the heterogeneity of cellular physiology.
A, Stochastic gene expression leads to variations in condensate formation between cells. B, Amplitude of noise expressed as coefficient of variance in the total protein concentration, cytoplasmic protein (dilute phase) concentration and condensate volume fraction as a function of expression level. Data are represented as mean ± SD. C, Dependency of cytoplasmic pH on condensate volume fraction from cells induced for expression for different amounts of times (30 min, 60 min, 180 min and 300 min). Each data point represents a single cell. D, Single-cell pH variance before and after condensate formation. Cells were analyzed at different time points before (30 min, 0 min before induction) and after condensate formation (60 min, 120 min and 180 min after induction). Coefficient of variance (CV) = (standard deviation/mean)*100. N = 75 individual cells. Data are represented as mean ± SD.
Figure 3.
Figure 3.. Biomolecular condensates regulate membrane potential, establishing a new electrochemical equilibrium between the intracellular and extracellular environment.
A, Electrochemical potential equilibrium between extracellular and intracellular environments is modulated by condensate formation. B, Sample images of DI-4-ANEPPS dye that measures the change of membrane potential upon condensate formation. A higher fluorescence corresponds to membrane hyperpolarization. The box center line represents the medium and whiskers suggest min to max. Two-tailed t-test for statistical analysis. C, Dependency of membrane potential on condensate volume fraction of cells induced for RLP expression for different amounts of times (30 min, 60 min, 180 min and 300 min). Each data point represents a single cell. The quantification of signal fluctuations shows single-cell membrane potential variance before and after condensate formation. Cells were analyzed at different time points before (45 min, 0 min before induction) and after condensate formation (60 min, 180 min and 240 min after induction). Coefficient of variance (CV) = (standard deviation/mean)*100. N = 50 individual cells. D, Membrane potential modulates the distribution of charged membrane potential dyes based on Nernst equilibrium. The hyperpolarization mediates influx of cationic molecules and efflux of anionic molecules. E, Flow cytometry analysis of ThT (a cationic membrane potential dye) signal of single cells based on different conditions of cells without or with RLP condensates or with RLP condensates followed by 1,6-hexanediol treatment. Phase contrast images show the representative images of cells at different conditions. F, Flow cytometry analysis of DiSBAC2(3) (an anionic membrane potential dye) signal of single cells based on different conditions of cells without or with RLP condensates or with RLP condensates followed by 1,6-hexanediol treatment.
Figure 4.
Figure 4.. Biomolecular condensates dictate membrane molecular uptake and cellular fitness.
A, Condensates mediate hyperpolarization of cellular membrane, thereby changing the uptake of antibiotics based on their types of electrostatic charge. This feature can regulate cellular survival under antibiotic stress. B, Growth of cells with or without condensates in M9 minimum medium. Data are represented as mean ± SD. C, Growth of cells with or without condensates in M9 minimum medium with negatively charged antibiotics, including 2 μg/mL ampicillin (left panel) and 1 μg/mL carbenicillin (right panel). Data are represented as mean ± SD. D, Growth of cells with or without condensates in M9 minimum medium with positively charged antibiotics. 1 μg/mL gentamicin (left panel), 6 μg/mL chloramphenicol (middle panel) and 2 μg/mL streptomycin (right panel). Data are represented as mean ± SD. E, Comparison of the extracted growth lag phase of cells with or without condensates under the treatment of different antibiotics. ****, P<0.0001; ns, non-significance; based on unpaired t-test. Data are represented as mean ± SD. F, Comparison of the extracted maximum growth rate of cells with or without condensates under the treatment with different antibiotics. *, P = 0.0117; ****, P < 0.0001; ns, non-significance; based on unpaired t-test. Data are represented as mean ± SD.
Figure 5.
Figure 5.. Condensate dependent change of global transcriptome.
A, Cells with or without RLP condensates were subjected to RNA-sequencing analysis to evaluate differential gene expression profiles between samples. B, Volcano plot (fold change of mRNA level between samples vs. adjusted p-value) shows the distribution of transcriptomes in cells with and without condensates. Statistically significant and featured transcripts are color coded based on the chemical features upregulating the downstream gene expression.

References

    1. Banani SF, Lee HO, Hyman AA, and Rosen MK (2017). Biomolecular condensates: organizers of cellular biochemistry. Nature Reviews Molecular Cell Biology 18, 285–298. 10.1038/nrm.2017.7. - DOI - PMC - PubMed
    1. Alberti S, and Hyman AA (2021). Biomolecular condensates at the nexus of cellular stress, protein aggregation disease and ageing. Nature Reviews Molecular Cell Biology 22, 196–213. 10.1038/s41580-020-00326-6. - DOI - PubMed
    1. Mittag T, and Pappu RV (2022). A conceptual framework for understanding phase separation and addressing open questions and challenges. Molecular Cell. - PMC - PubMed
    1. Bremer A, Farag M, Borcherds WM, Peran I, Martin EW, Pappu RV, and Mittag T (2022). Deciphering how naturally occurring sequence features impact the phase behaviours of disordered prion-like domains. Nature Chemistry 14, 196–207. 10.1038/s41557-021-00840-w. - DOI - PMC - PubMed
    1. Wei M-T, Elbaum-Garfinkle S, Holehouse AS, Chen CC-H, Feric M, Arnold CB, Priestley RD, Pappu RV, and Brangwynne CP (2017). Phase behaviour of disordered proteins underlying low density and high permeability of liquid organelles. Nature Chemistry 9, 1118–1125. 10.1038/nchem.2803. - DOI - PMC - PubMed

MeSH terms

LinkOut - more resources