. 2024 Oct;634(8034):662-668.
doi: 10.1038/s41586-024-08024-5. Epub 2024 Sep 11.

Heteromeric amyloid filaments of ANXA11 and TDP-43 in FTLD-TDP type C

Affiliations

Heteromeric amyloid filaments of ANXA11 and TDP-43 in FTLD-TDP type C

Diana Arseni et al. Nature. 2024 Oct.

Abstract

Neurodegenerative diseases are characterized by the abnormal filamentous assembly of specific proteins in the central nervous system1. Human genetic studies have established a causal role for protein assembly in neurodegeneration2. However, the underlying molecular mechanisms remain largely unknown, which is limiting progress in developing clinical tools for these diseases. Recent advances in cryo-electron microscopy have enabled the structures of the protein filaments to be determined from the brains of patients1. All neurodegenerative diseases studied to date have been characterized by the self-assembly of proteins in homomeric amyloid filaments, including that of TAR DNA-binding protein 43 (TDP-43) in amyotrophic lateral sclerosis (ALS) and frontotemporal lobar degeneration with TDP-43 inclusions (FTLD-TDP) types A and B3,4. Here we used cryo-electron microscopy to determine filament structures from the brains of individuals with FTLD-TDP type C, one of the most common forms of sporadic FTLD-TDP. Unexpectedly, the structures revealed that a second protein, annexin A11 (ANXA11), co-assembles with TDP-43 in heteromeric amyloid filaments. The ordered filament fold is formed by TDP-43 residues G282/G284-N345 and ANXA11 residues L39-Y74 from their respective low-complexity domains. Regions of TDP-43 and ANXA11 that were previously implicated in protein-protein interactions form an extensive hydrophobic interface at the centre of the filament fold. Immunoblots of the filaments revealed that the majority of ANXA11 exists as an approximately 22 kDa N-terminal fragment lacking the annexin core domain. Immunohistochemistry of brain sections showed the colocalization of ANXA11 and TDP-43 in inclusions, redefining the histopathology of FTLD-TDP type C. This work establishes a central role for ANXA11 in FTLD-TDP type C. The unprecedented formation of heteromeric amyloid filaments in the human brain revises our understanding of amyloid assembly and may be of significance for the pathogenesis of neurodegenerative diseases.


Conflict of interest statement

The authors declare no competing interests.

Figures

Fig. 1
Fig. 1. Cryo-EM of filaments from individuals with FTLD-TDP type C.
a, Representative cryo-EM images of filaments extracted from the prefrontal and temporal cortices of four individuals with FTLD-TDP type C. Examples of filaments are indicated with arrows. The filaments were identified by their width of approximately 15 nm, helical crossover distance of approximately 50 nm and granular surfaces. Scale bar, 100 nm. b, Cryo-EM reconstructions of filaments from four individuals with FTLD-TDP type C, shown as central slices perpendicular to the helical axis. All four reconstructions have the same filament fold. The resolution of each reconstruction is indicated. Scale bar, 2 nm.
Fig. 2
Fig. 2. Cryo-EM structure of heteromeric amyloid filaments of ANXA11 and TDP-43 from FTLD-TDP type C.
a, Cryo-EM reconstruction of the left-handed filaments of ANXA11 and TDP-43 from FTLD-TDP type C, shown parallel to the helical axis. b, Identification of TDP-43 and ANXA11 chains in the ordered filament fold. ANXA11 was identified by deriving a sequence motif directly from well-resolved amino acid side-chain densities in the cryo-EM reconstruction (see Methods). c, Cryo-EM reconstruction and atomic model of the filaments, shown for single TDP-43 and ANXA11 chains perpendicular to the helical axis. The green arrow indicates an isolated peptide consistent with TDP-43 residues N352–G357. Buried ordered solvent is indicated with red dots. d,e, Domain organization of TDP-43 (d) and ANXA11 (e). ANX, annexin repeat; N, nuclear localization signal; RRM, RNA-recognition motif. The black lines indicate the regions that form the filament fold. f,g, Amino acid sequence alignment of the secondary structure elements of the TDP-43 (f) and ANXA11 (g) chains. The arrows indicate β-strands. The sequences that form the interface between TDP-43 and ANXA11 are underlined. In panels ac, the cryo-EM density for TDP-43 is in grey and ANXA11 is in yellow. In panels b,c,f,g, the TDP-43 glycine-rich (G284–G310 in magenta), hydrophobic (M311–S342 in white) and Q/N-rich (Q343–Q345 in green) regions are highlighted. ANXA11 is shown in orange.
Fig. 3
Fig. 3. The ANXA11 and TDP-43 interface in heteromeric amyloid filaments from FTLD-TDP type C.
a,b, Overlay of the cryo-EM reconstruction (a) and hydrophobicity surface plot (b; most hydrophobic in yellow, and least hydrophobic in teal) with the atomic model of the filaments, focused on the interface between ANXA11 and TDP-43 and shown for single ANXA11 and TDP-43 chains perpendicular to the helical axis. The cryo-EM density for TDP-43 is in grey and ANXA11 is in yellow. Buried ordered solvent is indicated with a red dot. c, Atomic model of the interface between ANXA11 and TDP-43, shown for three molecular layers perpendicular to the helical axis.
Fig. 4
Fig. 4. Molecular pathology of ANXA11 in FTLD-TDP type C.
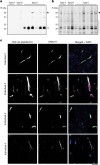
a,b, Immunoblot analysis of filament extracts from the prefrontal cortex of individuals with FTLD-TDP types A (two individuals), B (two individuals) and C (six individuals) using antibodies to N-terminal ANXA11 (a; residues 1–180) and TDP-43-pS409/pS410 (b). An approximately 22-kDa ANXA11 NTF (white arrow in a) and a minor population of full-length ANXA11 (black arrow in a) are observed for all individuals with FTLD-TDP type C, but not for individuals with FTLD-TDP types A and B. Full-length TDP-43 (black arrow in b) and TDP-43 CTFs (black line in b) are observed for all individuals. c, Immunohistochemical analysis of prefrontal cortex sections from four individuals with FTLD-TDP type C using antibodies to TDP-43-pS409/pS410 and N-terminal ANXA11 (residues 1–180). Individual images for TDP-43 and ANXA11 are shown in greyscale to facilitate comparison, in addition to a merged image showing TDP-43 (green), ANXA11 (magenta) and DAPI (blue) staining. ANXA11 and TDP-43 colocalize with inclusions. Additional immunolabelling analyses are shown in Extended Data Figs. 8 and 9. Scale bar, 20 µm.
Extended Data Fig. 1
Extended Data Fig. 1. Immunohistochemical and immuno-EM analyses of assembled TDP-43 in FTLD-TDP Type C.
a, Immunohistochemical analysis of prefrontal cortex sections from an individual with FTLD-TDP Type C (individual 1) using an antibody against pS409/410 TDP-43 (brown). Sections were counterstained with haematoxylin (blue). Scale bar, 50 µm. b, Immuno-EM analysis of filament extracts from the prefrontal cortex of an individual with FTLD-TDP Type C (individual 1) using an antibody against pS409/410 TDP-43 and a 10 nm gold-conjugated secondary antibody (black dots). Scale bars, 100 nm. a,b, Similar results were obtained for individuals 2–4.
Extended Data Fig. 2
Extended Data Fig. 2. Cryo-EM of additional filament types from individuals with FTLD-TDP Type C.
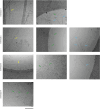
Representative cryo-EM images of tau paired helical filaments (yellow arrows), Aβ filaments (green arrows) and TMEM106B filaments (cyan arrows) in the filament extracts from the prefrontal and temporal cortex of four individuals with FTLD-TDP Type C. Tau paired helical filaments were identified by their width of ~20 nm and helical crossover distance of ~80 nm; Aβ filaments were identified by their width of ~8 nm and helical crossover distance of ~30 nm; and TMEM106B filaments were identified by their widths of ~12 nm (single protofilament) and ~26 nm (double protofilament), helical crossover distances of ~200 nm and smooth surfaces. Scale bar, 100 nm.
Extended Data Fig. 3
Extended Data Fig. 3. Cryo-EM reconstructions and atomic models.
a, Cryo-EM reconstructions of filaments from FTLD-TDP Type C individual 1 with two alternative conformations of the TDP-43 glycine-rich region (indicated with arrows), shown as central slices perpendicular to the helical axis. The resolution of each reconstruction is indicated. Scale bars, 2 nm. b, Fourier shell correlation (FSC) curves for the two independently-refined cryo-EM half-maps (black lines); for the refined atomic model against the cryo-EM density map (magenta); for the atomic model shaken and refined using the first half-map against the first half-map (cyan); and for the same atomic model against the second half-map (yellow). FSC thresholds of 0.143 (black dashed line) and 0.5 (magenta dashed line) are shown. c, Local resolution estimates for the cryo-EM reconstructions. d, Cryo-EM reconstructions viewed along the helical axis. Scale bar, 1 nm. e,f, Views of the cryo-EM reconstructions and atomic models showing representative densities for ordered solvent (red arrows) (e) and main chain oxygen atoms in β-strands (f), which reveal the chirality of the map.
Extended Data Fig. 4
Extended Data Fig. 4. Comparison of filament folds in ALS and FTLD-TDP Type A–C.
a, Schematic of the secondary structure elements of the homotypic TDP-43 filament folds of ALS and FTLD-TDP Type A and B, and the heterotypic TDP-43 and ANXA11 fold of FTLD-TDP Type C. Side chains for R293 are shown. Alternative local conformations (Alt.) of the FTLD-TDP Type A and C folds are transparent. b and c, Amino acid sequence alignment of the secondary structure elements of TDP-43 (b) and ANXA11 (c) in the filament folds. Arrows indicate β-strands. ac, The TDP-43 glycine-rich (G282–G310, magenta), hydrophobic (M311–S342, white) and Q/N-rich (Q343–Q360, green) regions are highlighted. ANXA11 is shown in orange. R293 is indicated with a blue dot.
Extended Data Fig. 5
Extended Data Fig. 5. Double-labelling immuno-EM of ANXA11 and TDP-43 in FTLD-TDP Type C filaments.
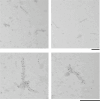
Double labelling immuno-EM analysis of filament extracts from the prefrontal cortex of an individual with FTLD-TDP Type C (individual 2) using antibodies against pS409/410 TDP-43 and N-terminal ANXA11 (residues 1–180) using 10 nm and 6 nm gold-conjugated secondary antibodies (black), respectively. The filaments label for both ANXA11 and TDP-43. Scale bars, 500 nm. Similar results were obtained for another two individuals with FTLD-TDP Type C.
Extended Data Fig. 6
Extended Data Fig. 6. The heteromeric filament fold of ANXA11 and TDP-43 from FTLD-TDP Type C.
a, Secondary structure of the heteromeric filament fold of FTLD-TDP Type C, shown for single ANXA11 and TDP-43 molecules perpendicular to the helical axis. b, Atomic model of the filament fold depicting hydrogen bonding (dashed cyan lines), shown for three ANXA11 and TDP-43 molecules perpendicular to the helical axis. c, Hydrophobicity of the filament fold, from most hydrophilic (teal) to most hydrophobic (yellow), shown for single ANXA11 and TDP-43 molecules perpendicular to the helical axis. d, Atomic model of filament fold, shown for single ANXA11 and TDP-43 molecules aligned with the helical axis. a, b and d, The TDP-43 glycine-rich (G284–G310, magenta), hydrophobic (M311–S342, white) and Q/N-rich (Q343–Q345, green) regions are highlighted. ANXA11 is shown in orange. a and c, The layers of the ANXA11 and TDP-43 chains are indicated with arrows.
Extended Data Fig. 7
Extended Data Fig. 7. Alternative confirmation of the TDP-43 glycine-rich region in heteromeric amyloid filaments from FTLD-TDP Type C.
a, Cryo-EM reconstruction and atomic model of heteromeric amyloid filaments from FTLD-TDP Type C with an alternative conformation of the glycine-rich region, shown for single ANXA11 and TDP-43 molecules perpendicular to the helical axis. Cryo-EM density for TDP-43 is in grey and ANXA11 is in yellow. Buried ordered solvent is indicated with red dots. b, Overlay of the atomic models of filaments with the alternative conformation of the glycine-rich region with the main conformation (transparent). c, Amino acid sequence alignment of the secondary structure elements of TDP-43 in the filaments. Arrows indicate β-strands. C1, main conformation; C2, alternative conformation. d, Alignment of TDP-43 residues N295–R293 from the atomic models of FTLD-TDP Type C (pink) and Type A (cyan) filaments. ac, The TDP-43 glycine-rich (G282–G310, magenta), hydrophobic (M311–S342, white) and Q/N-rich (Q343–Q345, green) regions are highlighted. ANXA11 is show in orange.
Extended Data Fig. 8
Extended Data Fig. 8. Immunoblot and immunohistochemical analysis of ANXA11 and TDP-43 in the prefrontal cortex in FTLD-TDP.
a, Immunoblot analysis of filament extracts from the prefrontal cortex of five individuals with FTLD-TDP Type C using antibodies against residues 3–15, 1–180 or 276–505 of ANXA11. A ~ 22 kDa ANXA11 NTF (white arrow) is observed for the antibodies against residues 3–15 and 1–180, but not 276–505. A minor population of full length ANXA11 (black arrow) is observed for all antibodies. bd, Immunohistochemical analysis of prefrontal cortex sections from an additional five individuals with FTLD-TDP Type C (b), two with Type A (c) and two with Type B (d) using antibodies against pS409/410 TDP-43 and N-terminal ANXA11 (residues 1–180). Individual images for TDP-43 and ANXA11 are shown in greyscale to facilitate comparison, in addition to a merged image showing TDP-43 (green), ANXA11 (magenta) and DAPI (blue) staining. ANXA11 and TDP-43 colocalise with inclusions in the individuals with FTLD-TDP Type C, but only TDP-43 co-localises with the inclusions in the individuals with FTLD-TDP Types A and B. Scale bar, 40 µm.
Extended Data Fig. 9
Extended Data Fig. 9. Immunohistochemical analysis of ANXA11 and TDP-43 in the hippocampal dentate gyrus in FTLD-TDP Type C.
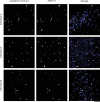
Immunohistochemical analysis of fascia dentata sections from three individuals with FTLD-TDP Type C using antibodies against pS409/410 TDP-43 and N-terminal ANXA11 (residues 1–180). Individual images for TDP-43 and ANXA11 are shown in greyscale to facilitate comparison, in addition to a merged image showing TDP-43 (green), ANXA11 (magenta) and DAPI (blue) staining. ANXA11 and TDP-43 colocalise with inclusions. Additional immunohistochemical analysis is shown in Fig. 4c and Extended Data Fig. 8. Scale bar, 40 µm.

Update of

References

    1. Scheres, S. H. W., Ryskeldi-Falcon, B. & Goedert, M. Molecular pathology of neurodegenerative diseases by cryo-EM of amyloids. Nature621, 701–710 (2023). - PubMed
    1. Wilson, D. M. et al. Hallmarks of neurodegenerative diseases. Cell186, 693–714 (2023). - PubMed
    1. Arseni, D. et al. Structure of pathological TDP-43 filaments from ALS with FTLD. Nature601, 139–143 (2022). - PMC - PubMed
    1. Arseni, D. et al. TDP-43 forms amyloid filaments with a distinct fold in type A FTLD-TDP. Nature620, 898–903 (2023). - PMC - PubMed
    1. Neumann, M. et al. Ubiquitinated TDP-43 in frontotemporal lobar degeneration and amyotrophic lateral sclerosis. Science314, 130–133 (2006). - PubMed

MeSH terms

LinkOut - more resources