. 2024 Oct 30;44(44):e0589242024.
doi: 10.1523/JNEUROSCI.0589-24.2024.

Neurophysiology of Effortful Listening: Decoupling Motivational Modulation from Task Demands

Affiliations

Neurophysiology of Effortful Listening: Decoupling Motivational Modulation from Task Demands

Frauke Kraus et al. J Neurosci. .

Abstract

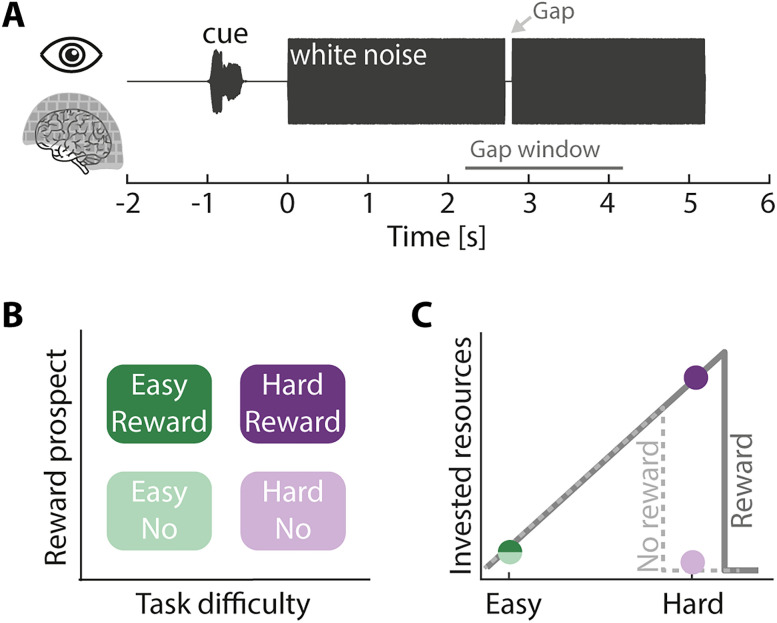
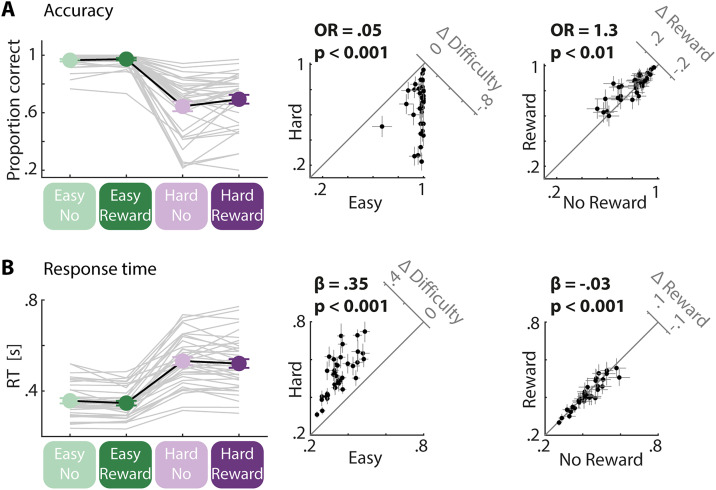
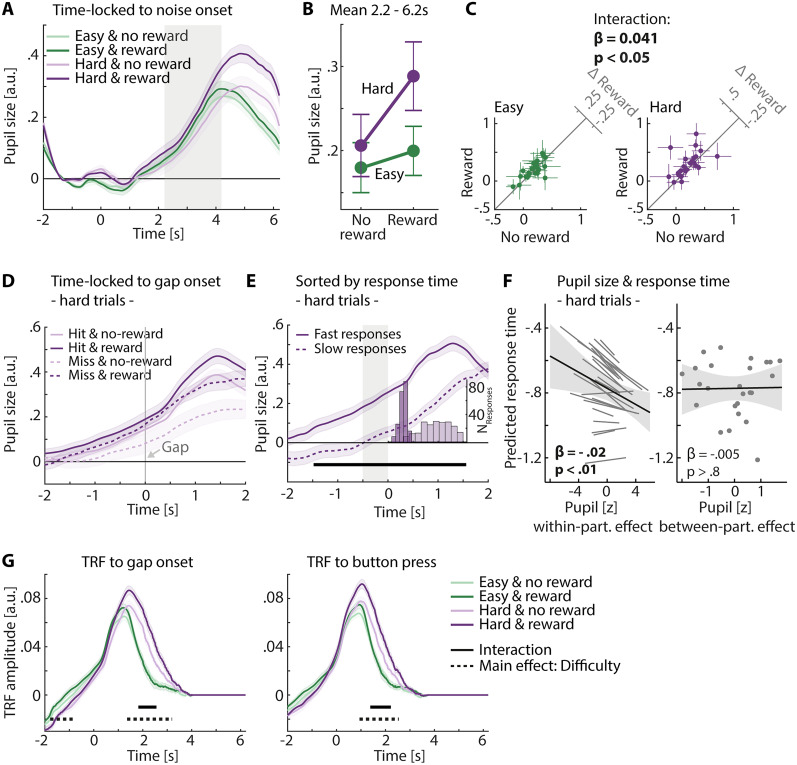
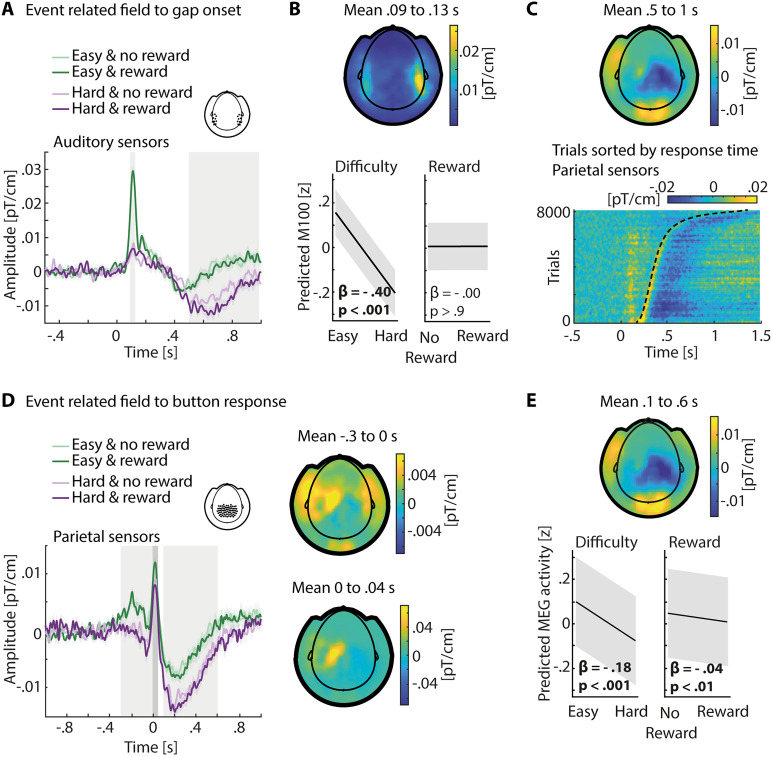
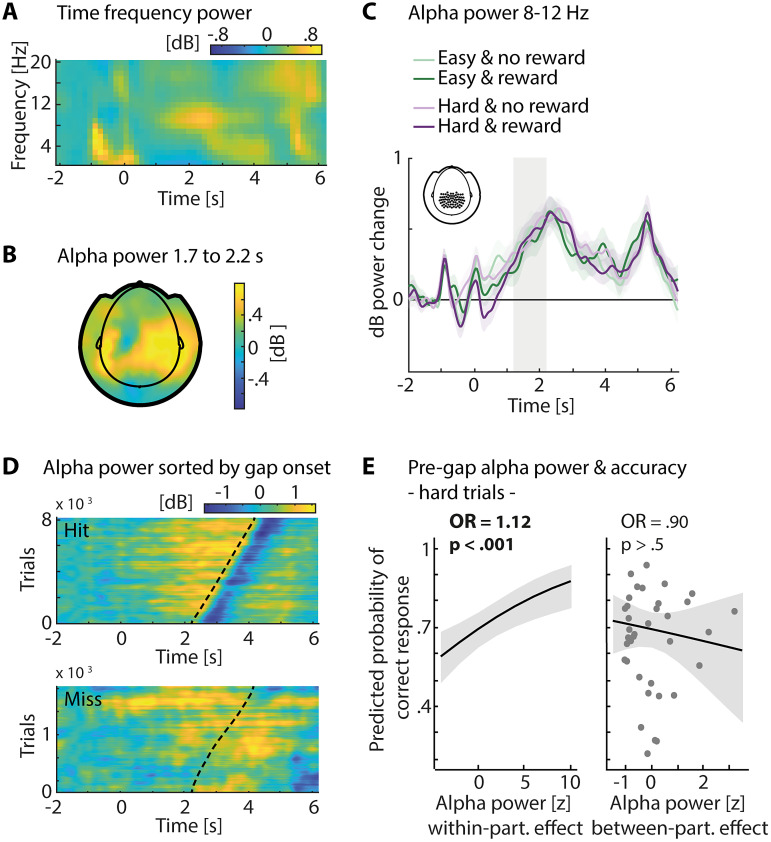
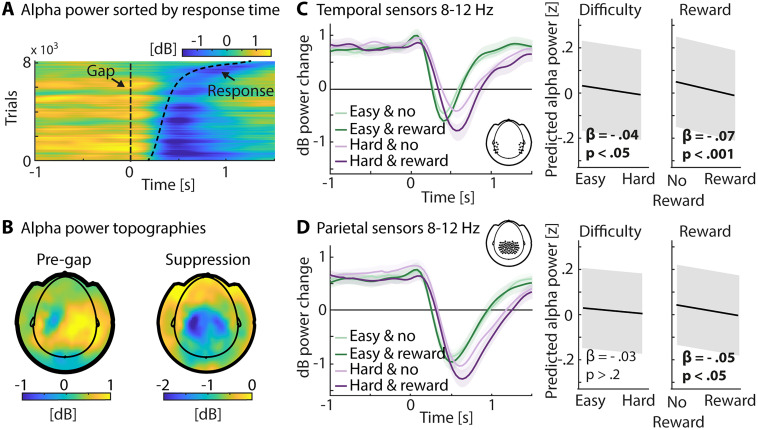
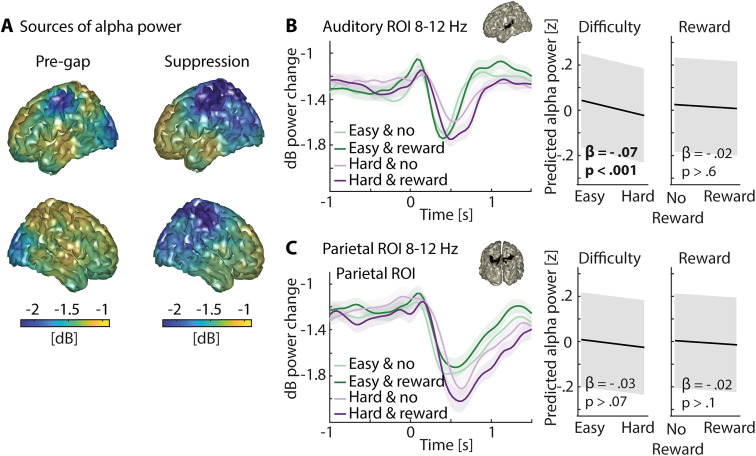
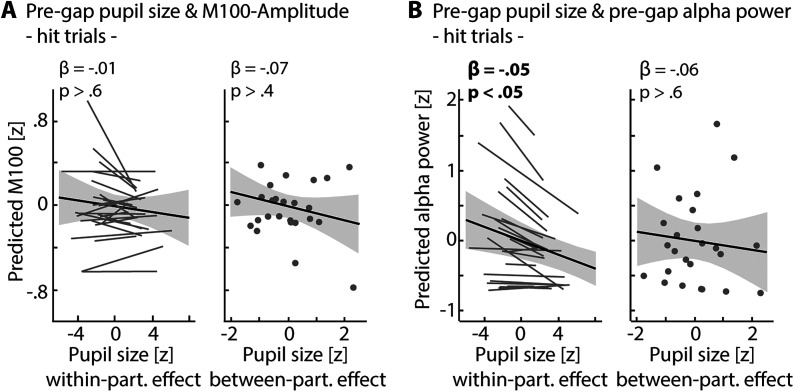
In demanding listening situations, a listener's motivational state may affect their cognitive investment. Here, we aim to delineate how domain-specific sensory processing, domain-general neural alpha power, and pupil size as a proxy for cognitive investment encode influences of motivational state under demanding listening. Participants (male and female) performed an auditory gap-detection task while the pupil size and the magnetoencephalogram were simultaneously recorded. Task demand and a listener's motivational state were orthogonally manipulated through changes in gap duration and monetary-reward prospect, respectively. Whereas task difficulty impaired performance, reward prospect enhanced it. The pupil size reliably indicated the modulatory impact of an individual's motivational state. At the neural level, the motivational state did not affect auditory sensory processing directly but impacted attentional postprocessing of an auditory event as reflected in the late evoked-response field and alpha-power change. Both pregap pupil dilation and higher parietal alpha power predicted better performance at the single-trial level. The current data support a framework wherein the motivational state acts as an attentional top-down neural means of postprocessing the auditory input in challenging listening situations.

Keywords: cognitive demand; event-related field; gap detection; motivation intensity theory; neural alpha power; pupil dilation; reward prospect.


Conflict of interest statement

The authors declare no competing financial interests.

Figures

Figure 1.
Figure 1.
Experimental design. A, Auditory gap-detection task: participants’ task was to detect a gap within 5.2 s white-noise sound. The gap occurred randomly between 2.2 and 4.2 s postnoise onset (gap window, marked by the gray line). B, Two-by-two design: task difficulty was determined by the gap duration (titrated to 65% detection performance for the hard condition and twice as long in easy trials). An auditory cue 1 s before each trial indicated whether the upcoming trial was reward-relevant or not. C, Hypothesis: according to the Motivation Intensity Theory (gray lines; Brehm and Self, 1989; Richter, 2016), participants should invest cognitively under the hard listening condition only when motivated to succeed (solid line) but should give up investing resources when they are less motivated (dashed line). The colored dots show our hypothesis. Figure design follows Kraus et al. (2023a).
Figure 2.
Figure 2.
Behavioral results. A, Accuracy. Proportion correct was better for the easy compared with the hard condition and for the reward-relevant compared with the reward-irrelevant condition. Insets, 45° scatterplots showing the task difficulty (left) and the reward-prospect effect (right) from linear mixed-model analysis. Difference plots (y- minus x-axis) are shown in the top-right corners). B, Response time. Participants were faster for the easy compared with the hard condition and for the reward-relevant compared with the reward-irrelevant condition. Insets, 45° scatterplots showing the task difficulty (left) and the reward-prospect effect (right) from linear mixed-model analysis. Difference plots (y- minus x-axis) are shown in the top-right corners.
Figure 3.
Figure 3.
Pupil size results. A, Averaged pupil size time courses across participants per condition. Error bands reflect the within-participant error. Gray areas indicate time window during which a gap could occur, from 2.2 to 4.2 s. B, Averaged data for 2.2–6.2 s time window. Error bars indicate the standard error of the mean. C, 45° scatterplots illustrate the interaction. Left, Data from the easy condition. Right, Data from the hard condition. Colored dots show averaged pupil data per task difficulty level, separately for each participant. The 45° line indicates no difference between conditions. Crosshairs indicate the 95% confidence interval. Difference plots (y- minus x-axis) are shown in top-right corners. D, Pupil size time courses (time-locked to the gap onset) for the hard condition, separately for each reward-prospect condition (light vs dark) and for hit and miss trials (solid vs dashed lines). Error bands reflect the within-participant error. E, Pupil size data grouped into trials with slow- (dashed) and fast-response times (solid). The histogram shows the distribution of response times for each group. Gray area indicates the time window for the LMM analysis in panel F. Black line indicates the time window in which the pupil size was significantly larger for fast-response trials compared with slow-response trials (after FDR correction). Error bands reflect the within-participant error. F, Effect of the pupil size on response time in an LMM analysis. A larger pupil size is associated with a faster response time on a within-participant level (not for the between-participants effect). Participant-specific slope for the pupil size did not improve the model, but we show it here for illustrative purposes. G, TRF approach of the pupil size response to the gap onset (left) and button press (right). Black line indicates the time window in which the pupil size increased stronger for reward-relevant than reward-irrelevant trials when task difficulty was hard compared with easy. Dashed black line indicates the time window in which the pupil size was significantly larger in hard compared with easy trials. All shown significant effects are based on FDR correction.
Figure 4.
Figure 4.
Event-related field to the gap onset and to the button response. A, Event-related field to the gap onset. Data are averaged across temporal sensors marked in the inset. Error bands reflect the within-participant error. Gray areas indicate time windows for analysis in B and C. B, Effect on M100. Average from 0.09 to 0.13 s. Top, Topography for the average across all for conditions. Bottom, Statistical results are calculated using an LMM. Main effect is significant for difficulty but not for reward prospect. C, Late ERF component. Top, Topography for the average across all four conditions from 0.5 to 1 s. Bottom, Trials sorted by response time and time-locked to the gap onset. Average across parietal sensors that are marked in the inset in panel D. Data are from all conditions. Black dashed line indicates response time. D, Event-related field to button response. Data are averaged across parietal sensors marked in the inset. Error bands reflect the within-participant error. Gray areas indicate time windows for topographies on the right and in panel E. Topographies for time window before button response and around button response show main activity around left motor areas. E, After-response component. Top, Topography for the average across all four conditions from 0.1 to 0.6 s. Bottom, Statistical analysis of time window 0.1–0.6 s after button response using an LMM. Stronger deflection for hard compared with easy trials and for reward-relevant compared with reward-irrelevant trials. All significant effects are based on FDR correction.
Figure 5.
Figure 5.
Pregap alpha-power analysis. All data are averaged across parietal sensors marked in the inset in panel C. A, Time–frequency power measured in decibel relative to a prestimulus time interval and averaged across all conditions. B, Topography reflects alpha power in the 500 ms (1.7–2.2 s) before the time window when a gap could occur (averaged across all conditions; gray area in C). C, Alpha power averaged for all four conditions separately. Error bands reflect the within-participant error. Effects of task difficulty and reward prospect were not significant in the 500 ms before a gap could occur (gray area). D, Alpha power for hit trials (top) and miss trials (bottom) sorted by the gap onset. Black dashed lines indicate the gap time. Alpha power increased toward the gap but was suppressed after gap occurrence (for hit trials). E, Effect of pregap parietal alpha power on accuracy in an LMM analysis. Larger pregap alpha power is associated with better performance on a within-participant level only. Reported effects are based on FDR correction.
Figure 6.
Figure 6.
Postgap alpha-power analysis. A, Gap-locked alpha–power trials sorted by response time. Data are averaged across parietal sensors; see inset in D. Black lines represent the gap onset and the response time. Alpha-power suppression is rather time-locked to the gap onset than to the response time. B, Left, Grand average topography for −0.5–0 s time-locked to the gap onset. Right, Grand average topography for maximal alpha-power suppression after the gap onset. C, Temporal sensors. Left, Alpha power averaged per condition across participants and temporal sensors (see inset). Error bands reflect the within-participant error. Right, LMM results of alpha-power suppression. Alpha-power suppression was larger for hard compared with easy and for reward-relevant compared with reward-irrelevant trials. D, Parietal sensors. Left, Alpha power averaged per condition across participants and parietal sensors (see inset). Error bands reflect the within-participant error. Right, LMM results of alpha-power suppression. Alpha-power suppression was larger for reward-relevant compared with reward-irrelevant trials.
Figure 7.
Figure 7.
Source localized alpha power, time-locked to the gap onset. A, Left, Grand average source plot for −0.5–0 s time-locked to the gap onset. Right, Grand average source plot for maximal alpha-power suppression after the gap onset. B, Auditory ROI. Left, Source-projected alpha power for each condition. Inset shows the auditory ROI. Error bands reflect the within-participant error. Right, Results from an LMM predicting alpha-power suppression. Alpha-power suppression was larger for hard compared with easy trials [β = −0.07; SE = 0.018; p = 9.64 × 10−4; log(BF) = 2.5]. The effect of reward [β = −0.02; SE = 0.018; p > 0.6; log(BF) = −4] and the difficulty × reward interaction [β = 0.02; SE = 0.036; p > 0.7; log(BF) = −4.5] were not significant. Direction of the effects is the same as in sensor space. C, Same as in panel B for a parietal ROI. No significant effect was found [task difficulty, β = −0.03; SE = 0.016; p > 0.7; log(BF) = −2.5; reward prospect, β = −0.02; SE = 0.016; p > 0.1; log(BF) = −3.5; interaction, β = −0.06; SE = 0.031; p > 0.1; log(BF) = −3]. Direction of the effects is the same as in sensor space.
Figure 8.
Figure 8.
Relation between the pupil size and brain measures. A, Relation between the pregap pupil size and M100 amplitude. LMM controlled for experimental conditions and was done on hit trials only. The pupil size was averaged across 0.5 s before the gap onset and baseline-corrected to the baseline window before the trial. M100 data were averaged across temporal sensors. No within-participant nor between-participant effect of the pupil size on the M100 amplitude was found. B, Relation between the pregap pupil size and pregap parietal alpha power. LMM controlled for experimental conditions and was done on hit trials only. The pupil size was averaged across 0.5 s before the gap onset and baseline-corrected to the baseline window before the trial. Alpha-power data were averaged across the same 0.5 s time window and across parietal sensors. A significant negative relationship between the pupil size and alpha power was found on a within-participant level.

Similar articles

Cited by

References

    1. Ala TS, Graversen C, Wendt D, Alickovic E, Whitme WM, Lunner T (2020) An exploratory study of EEG alpha oscillation and pupil dilation in hearing-aid users during effortful listening to continuous speech. PLoS One 15:1–15. 10.1371/journal.pone.0235782 - DOI - PMC - PubMed
    1. Alavash M, Obleser J (2024) Brain network interconnectivity dynamics explain metacognitive differences in listening behavior. J Neurosci 44:31. 10.1523/JNEUROSCI.2322-23.2024 - DOI - PMC - PubMed
    1. Alavash M, Tune S, Obleser J (2021) Dynamic large-scale connectivity of intrinsic cortical oscillations supports adaptive listening in challenging conditions. PLoS Biol 19:10. 10.1371/journal.pbio.3001410 - DOI - PMC - PubMed
    1. Alday PM (2019) How much baseline correction do we need in ERP research? Extended GLM model can replace baseline correction while lifting its limits. Psychophysiology 56:1–14. 10.1111/psyp.13451 - DOI - PubMed
    1. Alfandari D, Richter M, Wendt D, Fiedler L, Naylor G (2023) Previous mental load and incentives influence anticipatory arousal as indexed by the baseline pupil diameter in a speech-in-noise task. Trends Hear 27:23312165231196520. 10.1177/23312165231196520 - DOI - PMC - PubMed

LinkOut - more resources