. 2024 Oct 23;44(43):e0727242024.
doi: 10.1523/JNEUROSCI.0727-24.2024.

Atp13a5 Marker Reveals Pericyte Specification in the Mouse Central Nervous System

Affiliations

Atp13a5 Marker Reveals Pericyte Specification in the Mouse Central Nervous System

Xinying Guo et al. J Neurosci. .

Abstract

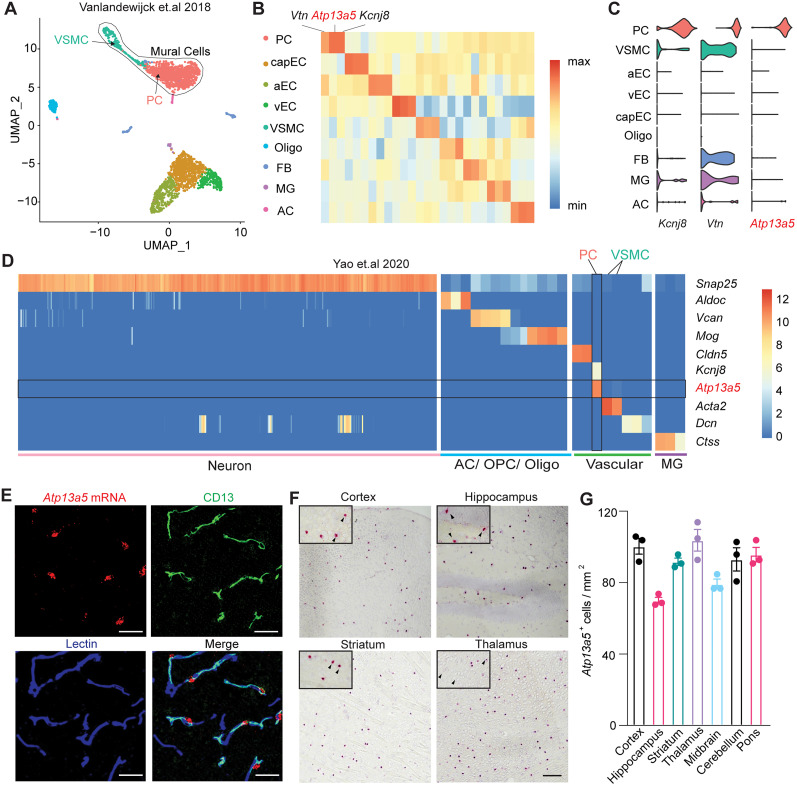
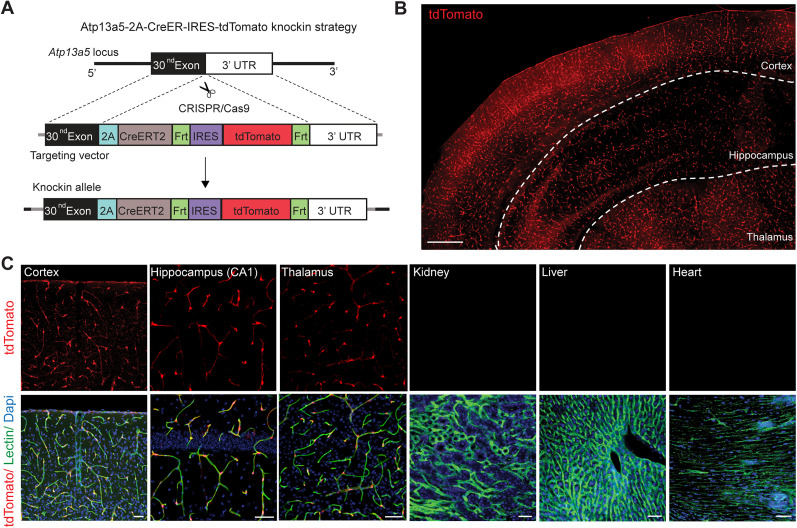
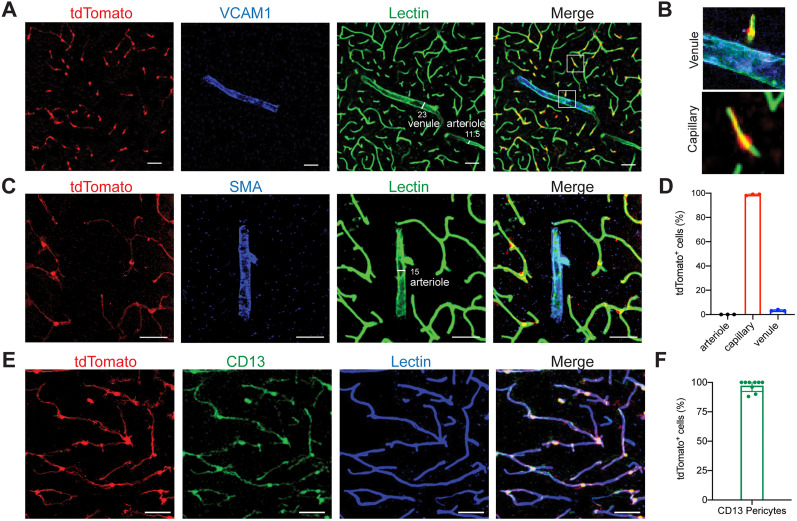
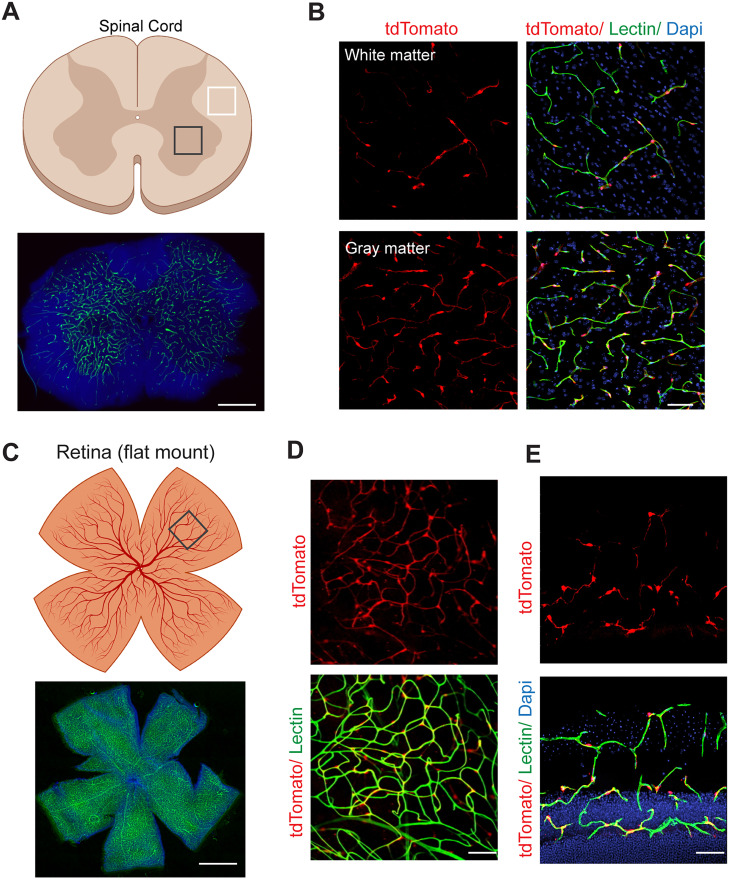
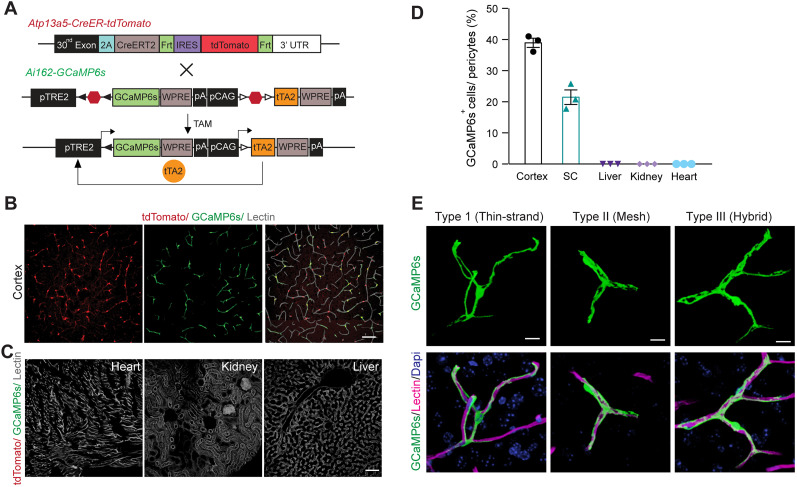
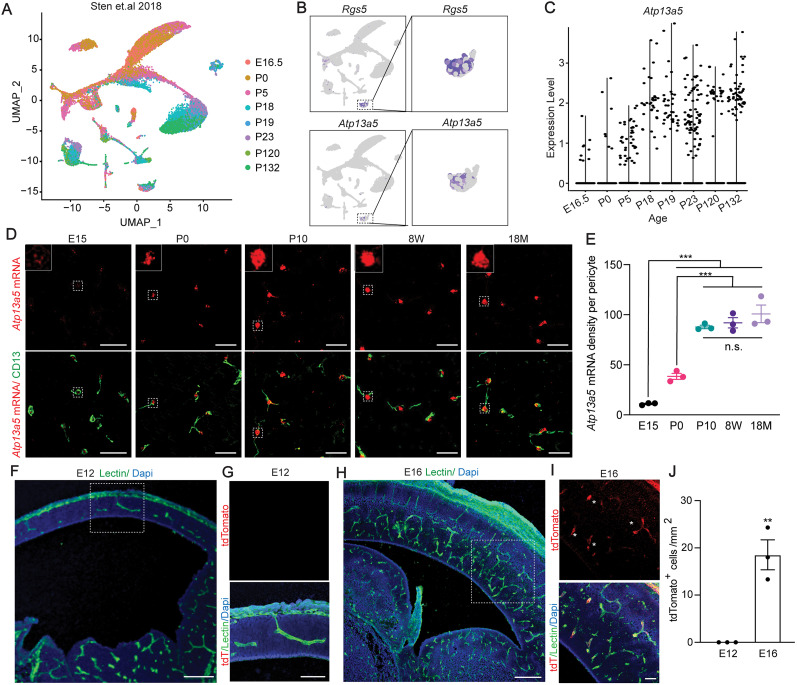
Perivascular mural cells including vascular smooth cells (VSMCs) and pericytes are integral components of the vascular system. In the central nervous system (CNS), pericytes are also indispensable for the blood-brain barrier (BBB), blood-spinal cord barrier, and blood-retinal barrier and play key roles in maintaining cerebrovascular and neuronal functions. However, the functional specifications of pericytes between CNS and peripheral organs have not been resolved at the genetic and molecular levels. Hence, the generation of reliable CNS pericyte-specific models and genetic tools remains very challenging. Here, we report a new CNS pericyte marker in mice. This putative cation-transporting ATPase 13A5 (Atp13a5) marker was identified through single-cell transcriptomics, based on its specificity to brain pericytes. We further generated a knock-in model with both tdTomato reporter and Cre recombinase. Using this model to trace the distribution of Atp13a5-positive pericytes in mice, we found that the tdTomato reporter reliably labels the CNS pericytes, including the ones in spinal cord and retina but not peripheral organs. Interestingly, brain pericytes are likely shaped by the developing neural environment, as Atp13a5-positive pericytes start to appear around murine embryonic day 15 (E15) and expand along the cerebrovasculature. Thus, Atp13a5 is a specific marker of CNS pericyte lineage, and this Atp13a5-based model is a reliable tool to explore the heterogeneity of pericytes and BBB functions in health and diseases.

Keywords: blood–brain barrier; development; mouse model; mural cells; pericyte; single-cell transcriptomics.


Conflict of interest statement

The authors declare no competing financial interests.

Figures

Figure 1.
Figure 1.
Atp13a5 is specifically expressed by brain pericytes. A, UMAP of brain vasculature transcriptomes. Mural cells are marked by black line. PC, pericytes; capEC, capillary endothelial cells; aEC, arterial endothelial cells; vEC, venous endothelial cells; VSMC, vascular smooth muscle cells; Oligo, oligodendrocytes; FB, fibroblast; MG, microglia; AC, astrocytes; OPC, oligodendrocyte progenitor cells. B, Gene expression heatmap of the top 3 markers genes in each cluster. Pericyte markers: Vtn, Atp13a5a, and Kcnj8; capEC markers: Slc7a5, Ctla2a, and Slc38a3; aEC markers: Bmx, Alpl, and Gkn3; vEC markers: Slc38a51, Vwf, and Flrt2; VSMC markers: Sncg, Pdlim3, and Gpr20; Oligo markers: Mbp, Cldn11, and Mag; FB markers: Lum, Col1a1, and Col6a1; MG markers: Trem2, Fcgr1, and AF251705; AC markers: Ntsr2, Mlc1, and Acsbg1. Detailed gene lists are provided in Extended Data Figure 1-1 and Extended Data Tables 1-1 and 1-2. C, Violin plots showing the distribution of expression level of the top 3 pericyte markers across all nine cell types. D, Gene expression heatmap of representative genes in Allen Institute's dataset. E, Representative images for Atp13a5 mRNA expression (red) and immunostaining for CD13+ pericytes (green), and lectin+ endothelia cells (blue) in cortex. Scale bar, 50 µm. Sections: 15 µm thickness. F, Representative images for Atp13a5 mRNA expression (red) in various mouse brain regions. Scale bar, 100 µm. Sections: 10 µm thick. G, Number of Atp13a5+ cells per mm2 in different mouse brain regions. n = 3 mice. Data are presented in mean ± SEM.
Figure 2.
Figure 2.
Generation and validation of the Atp13a5-2A-CreERT2-IRES-tdTomato model. A, Schematic diagram showing the strategy for generating the Atp13a5-2A-CreERT2-IRES-tdTomato knock-in mice. See Materials and Methods for more details. B, A representative tiled image of brain section from a heterozygous Atp13a5-2A-CreERT2-IRES-tdTomato mouse. Scale bar, 500 µm. C, Representative confocal images of tdTomato, endothelial marker lectin, and Dapi in different tissues from a homozygous Atp13a5-2A-CreERT2-IRES-tdTomato mouse, including cortex, CA1 region of hippocampus, thalamus, kidney, liver, and heart (ventricular wall). Scale bar, 50 µm. Additional data are provided in Extended Data Figure 2-1.
Figure 3.
Figure 3.
Atp13a5-driven tdTomato reporter expression in brain pericytes. A, tdTomato expression on brain capillary of Atp13a5-2A-CreERT2-IRES-tdTomato knock-in mice, but not on VCAM1+ venules. Scale bar, 50 µm. B, Representative images from the boxed regions in A. C, tdTomato expression on brain capillary, but not on SMA+ arterioles. Scale bar, 50 µm. D, The percentage of tdTomato+ cells distributed among arterioles, capillaries, and venules in the cortex. Arteries and arterioles are identified by vessel diameter in combination with the presence of SMA. Veins and venules are identified by vessel diameter in combination with the presence of VCAM1 and the absence of SMA. Lectin+ vessels with diameters smaller than 6 µm are considered as capillaries. n = 3 mice. E, Colocalization of tdTomato with pericyte marker CD13 (green) on lectin (blue) positive endothelium. Scale bar, 50 µm. F, Quantification of the percentage of tdTomato+ cells in CD13+ pericytes. n = 9 mice. Data are presented in mean ± SEM. Additional data are provided in Extended Data Figures 3-1 and 3-2.
Figure 4.
Figure 4.
Atp13a5-driven tdTomato reporter expression in spinal cord and retina. A, A diagram showing a cross section of mouse spinal cord on the top and lectin angiogram (green) on the bottom. Dapi, nuclear staining. Scale bar, 500 µm. B, tdTomato reporter expression in the spinal cord pericytes of Atp13a5-2A-CreERT2-IRES-tdTomato knock-in mice. Scale bar, 50 µm. C, A diagram showing a flat mount preparation of mouse retina on top, and lectin angiogram (green) on bottom. Dapi, nuclear staining. Scale bar, 1 mm. D, E, tdTomato reporter expression in the retinal pericytes of Atp13a5-2A-CreERT2-IRES-tdTomato knock-in mice. Scale bar, 50 µm. D, flat mount; E, cross section.
Figure 5.
Figure 5.
Characterizing the CreER recombinase activity. A, Schematic diagram showing the breeding strategy for generating Atp13a5-2A-CreERT2-IRES-tdTomato; Ai162 mice. B, Representative confocal images of cortical section from a Atp13a5-2A-CreERT2-IRES-tdTomato; Ai162 mouse, with Atp13a5-driven tdTomato (red), tamoxifen-induced GCaMP6s (green), and lectin-labeled endothelial profiles (gray). Scale bar, 50 µm. C, Representative confocal images of heart, kidney, and liver sections from a Atp13a5-2A-CreERT2-IRES-tdTomato; Ai162 mouse, showing no tdTomato or GCaMP6s expression. Lectin (gray): endothelial profiles. Scale bar, 50 µm. D, Quantification of the percentages of tdTomato+ and GCaMP6s+ double-positive cells in pericytes in different organs as indicated. n = 3 mice. Data are presented in mean ± SEM. E, High-resolution 3D reconstruction of sparse labeled tdTomato+ and GCaMP6s+ double-positive brain pericytes. Type I, thin-strand pericytes; type II, mesh pericytes; type III, hybrid pericytes. Scale bar, 10 µm. Additional data are provided in Extended Data Figure 5-1.
Figure 6.
Figure 6.
Developmental regulation of Atp13a5 marker. A, UMAP of 24,185 mouse brain cells from multiple ages. Each dot was color-coded and annotated by different ages. B, UMAP plots showing scRNA-seq data, colored by gene expression value, showing Rgs5 and Atp13a5 expression. C, Violin plots showing Atp13a5 expression in different ages. D, Representative images for Atp13a5 mRNA expression and CD13 in brain sections from different ages. Scale bar, 50 µm. Sections: 15 µm thick. E, Atp13a5 expression density per pericyte in various developmental stages. Data are presented in mean ± SEM; n = 3 mice per age group; ***p < 0.001, n.s., no significant difference, by one-way ANOVA with Tukey’s test. F, A representative image of an Atp13a5-2A-CreERT2-IRES-tdTomato embryonic cortex at E12. Scale bar, 200 µm. Sections: 30 µm thick. G, High magnification of boxed region in F. tdTomato was not detected in the cortex at E12. Scale bar, 100 µm. H, A representative image of an Atp13a5-2A-CreERT2-IRES-tdTomato embryonic cortex at E16. Scale bar, 200 µm. Sections: 30 µm thick. I, High magnification of boxed region in H. tdTomato can be detected in the cortex at E16. Scale bar, 50 µm. Sections: 30 µm thick. J, Quantification of tdTomato+ pericyte numbers per mm2 in E12 and E16 mouse brain. n = 3 mice. **p < 0.01 by Student's t test. Data are presented in mean ± SEM. Additional data are provided in Extended Data Figure 6-1.

Similar articles

Cited by

References

    1. Ando K, et al. (2022) KCNJ8/ABCC9-containing K-ATP channel modulates brain vascular smooth muscle development and neurovascular coupling. Dev Cell 57:1383–1399.e7. 10.1016/j.devcel.2022.04.019 - DOI - PubMed
    1. Armulik A, et al. (2010) Pericytes regulate the blood–brain barrier. Nature 468:557–561. 10.1038/nature09522 - DOI - PubMed
    1. Armulik A, Genove G, Betsholtz C (2011) Pericytes: developmental, physiological, and pathological perspectives, problems, and promises. Dev Cell 21:193–215. 10.1016/j.devcel.2011.07.001 - DOI - PubMed
    1. Bell RD, Winkler EA, Sagare AP, Singh I, LaRue B, Deane R, Zlokovic BV (2010) Pericytes control key neurovascular functions and neuronal phenotype in the adult brain and during brain aging. Neuron 68:409–427. 10.1016/j.neuron.2010.09.043 - DOI - PMC - PubMed
    1. Ben-Zvi A, Lacoste B, Kur E, Andreone BJ, Mayshar Y, Yan H, Gu C (2014) MFSD2A is critical for the formation and function of the blood-brain barrier. Nature 509:507–511. 10.1038/nature13324 - DOI - PMC - PubMed

MeSH terms

LinkOut - more resources