

Can ploidy levels explain the variation of Herbertia lahue (Iridaceae)?
- PMID: 39261305
- PMCID: PMC11390242
- DOI: 10.1590/1678-4685-GMB-2023-0137
Can ploidy levels explain the variation of Herbertia lahue (Iridaceae)?
Abstract
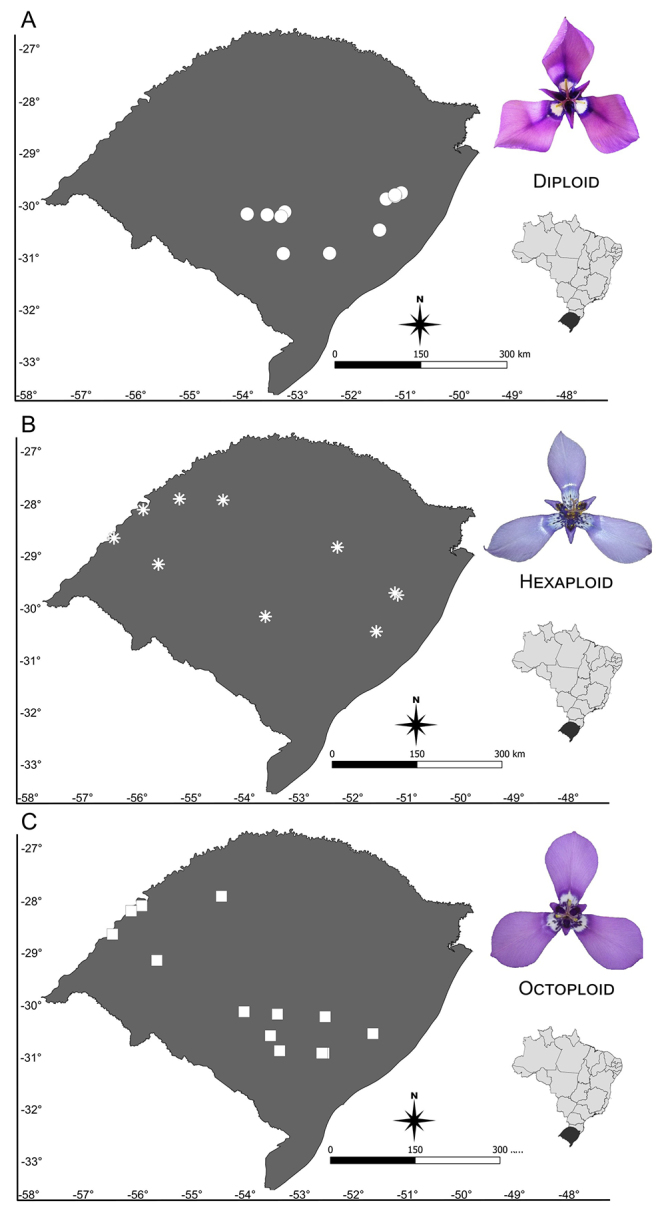
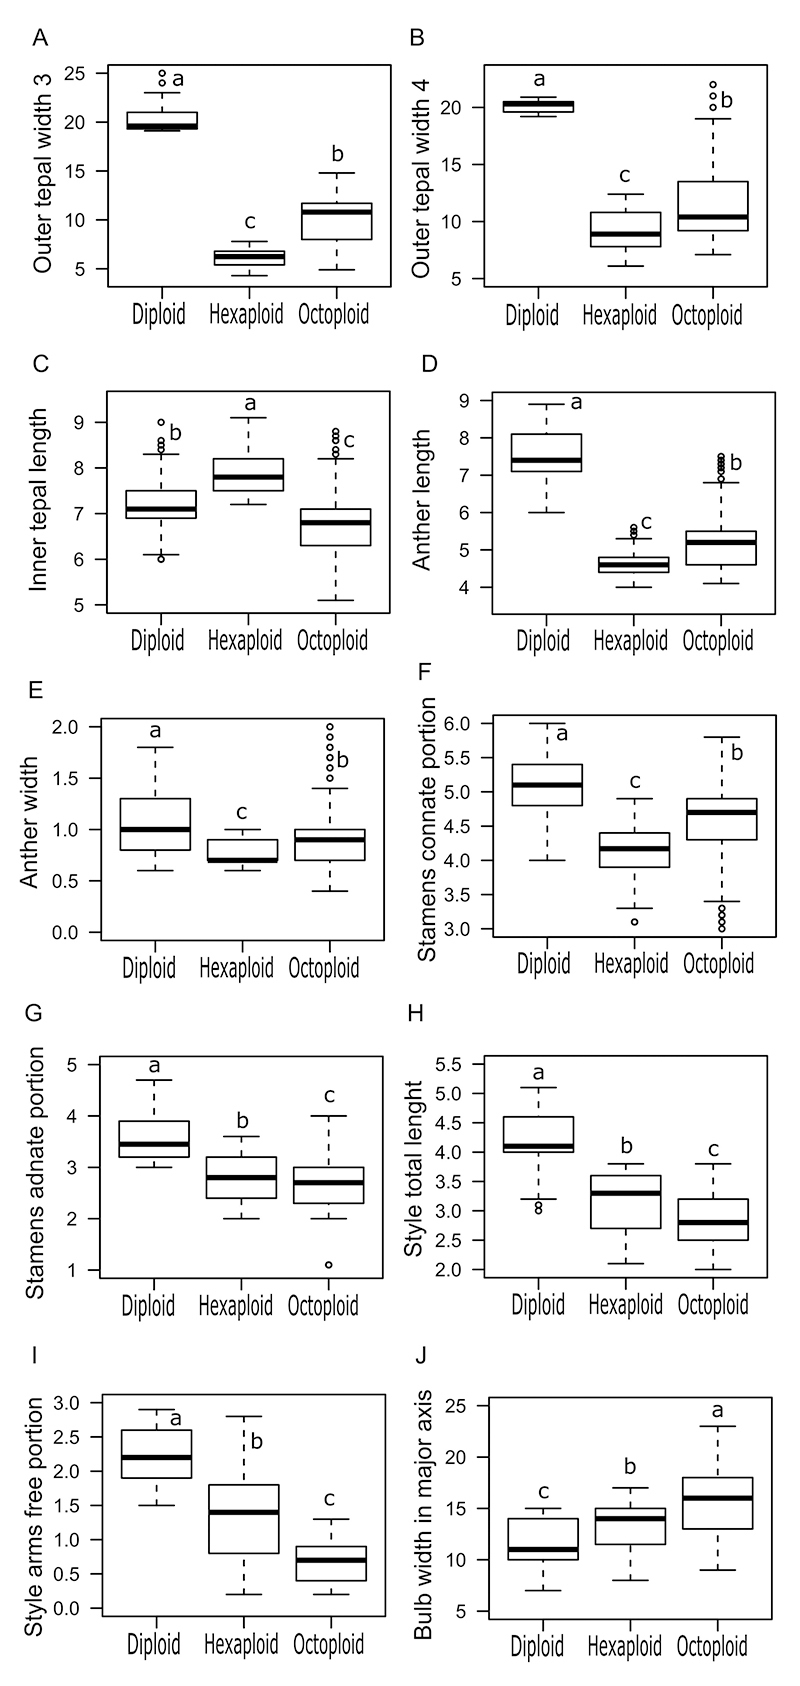
Polyploidy is often related with phenotypic variation, as observed in Herbertia lahue, a geophyte species. This study examined the H. lahue polyploid series and departure in cytogenetic, morphometric, and pollen data. Diploids (2n=2x=14) present bimodal karyotype with two long and five short chromosome pairs, while hexaploids (2n=6x=42) and octoploids (2n=8x=56) present a gradual decrease in chromosome size. All cytotypes have CMA+/DAPI- bands co-localized with 18S rDNA sites in the satellite region (no DAPI+ bands in any cytotype). Unlike diploids and octoploids, 5S rDNA interstitial sites in hexaploids are not in a syntenic position with 18S rDNA sites. Genome size is effective as an indirect predictor of the cytotypes since 2C-values increased according to ploidy level. The reduction in the number of the rDNA sites in polyploids associated with their lower 1Cx-values compared to diploids may suggest a genome downsizing process. Morphometric analysis revealed significant differences among cytotypes, and discriminant analysis identified three morphometric groupings corresponding to the cytotypes. The phenotypic variation observed in pollen grains, bulbs, and ovary characters suggested the gigas effect. Concluding, remarkable differentiation was observed at both genomic and phenotypic characters in all the cytotypes analyzed, suggesting a possible ongoing speciation process in H. lahue.
Conflict of interest statement
Figures


Similar articles
-
Does the evolution of micromorphology accompany chromosomal changes on dysploid and polyploid levels in the Barnardia japonica complex (Hyacinthaceae)?BMC Plant Biol. 2023 Oct 11;23(1):485. doi: 10.1186/s12870-023-04456-9. BMC Plant Biol. 2023. PMID: 37817118 Free PMC article.
-
Environmental differences are correlated with the distribution pattern of cytotypes in Veronica subsection Pentasepalae at a broad scale.Ann Bot. 2020 Mar 9;125(3):471-484. doi: 10.1093/aob/mcz182. Ann Bot. 2020. PMID: 31677387 Free PMC article.
-
Disentangling Crocus Series Verni and Its Polyploids.Biology (Basel). 2023 Feb 14;12(2):303. doi: 10.3390/biology12020303. Biology (Basel). 2023. PMID: 36829579 Free PMC article.
-
Distribution and habitat segregation on different spatial scales among diploid, tetraploid and hexaploid cytotypes of Senecio carniolicus (Asteraceae) in the Eastern Alps.Ann Bot. 2010 Dec;106(6):967-77. doi: 10.1093/aob/mcq192. Epub 2010 Sep 29. Ann Bot. 2010. PMID: 20880930 Free PMC article.
-
Chromosome Morphology and Heterochromatin Patterns in Paspalum notatum: Insights into Polyploid Genome Structure.Genes (Basel). 2025 Feb 20;16(3):242. doi: 10.3390/genes16030242. Genes (Basel). 2025. PMID: 40149394 Free PMC article.
References
-
- Abdoli M, Moieni A, Naghdi Badi H. Morphological, physiological, cytological and phytochemical studies in diploid and colchicine-induced tetraploid plants of Echinacea purpurea (L.) Acta Physiol Plant. 2013;35:2075–2083.
-
- Alexander MP. A versatile stain for pollen fungi, yeast and bacteria. Stain Technol. 1980;55:13–18. - PubMed
-
- Arroyo-Martínez HA, Arzate-Fernández AM, Barba-González R, Piña-Escutia JL. Karyotype analysis and physical mapping of the 5S and 45S rDNA genes in Tigridia pavonia var. Dulce (Iridaceae) Caryologia. 2018;71:1–6.
Internet Resources
-
- Plants of the World Online . Facilitated by the Royal Botanic Gardens, Kew. 2023. [30 August 2023]. Plants of the World Online (2023) Facilitated by the Royal Botanic Gardens, Kew, https://powo.science.kew.org/taxon/urn:lsid:ipni.org:names:120622-2#othe... .
-
- R Core Team . R: A language and environment for statistical computing. R Foundation for Statistical Computing, Vienna, Austria. 2021. [4 August 2021]. R Foundation for Statistical Computing, Vienna, Austria, https://www.R-project.org/
LinkOut - more resources
Full Text Sources
