. 2025 Feb;125(2):393-408.
doi: 10.1007/s00421-024-05606-z. Epub 2024 Sep 11.

Changes in hormonal profiles during competition preparation in physique athletes

Affiliations

Changes in hormonal profiles during competition preparation in physique athletes

Ville Isola et al. Eur J Appl Physiol. 2025 Feb.

Abstract

Purpose: Physique athletes engage in rigorous competition preparation involving intense energy restriction and physical training to enhance muscle definition. This study investigates hormonal changes and their physiological and performance impacts during such preparation.

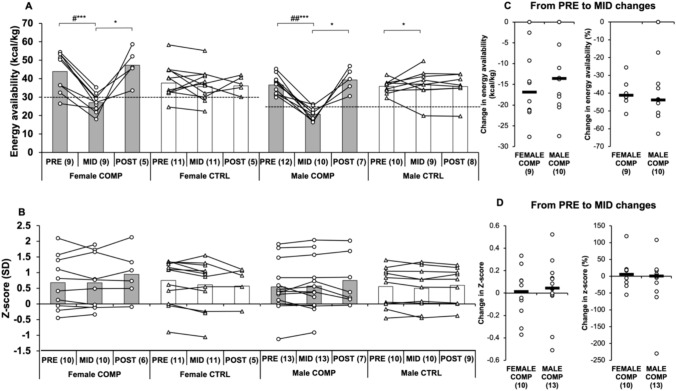
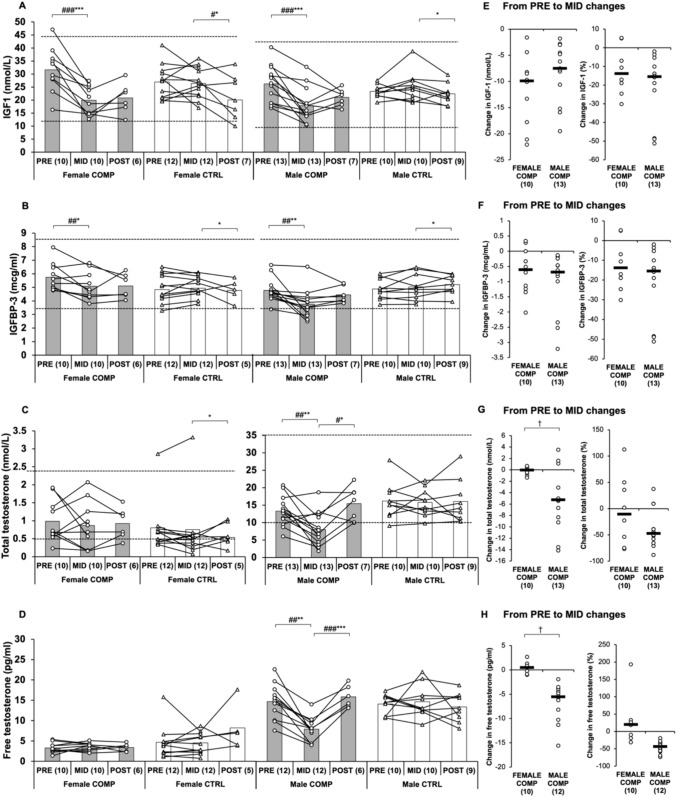
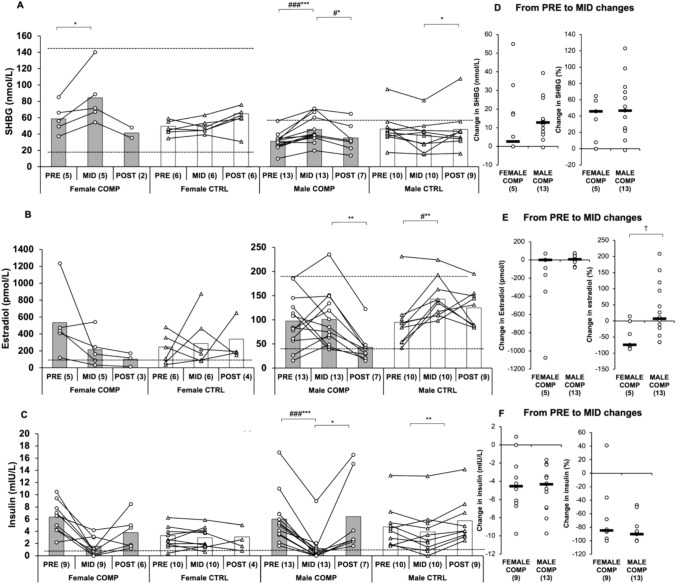
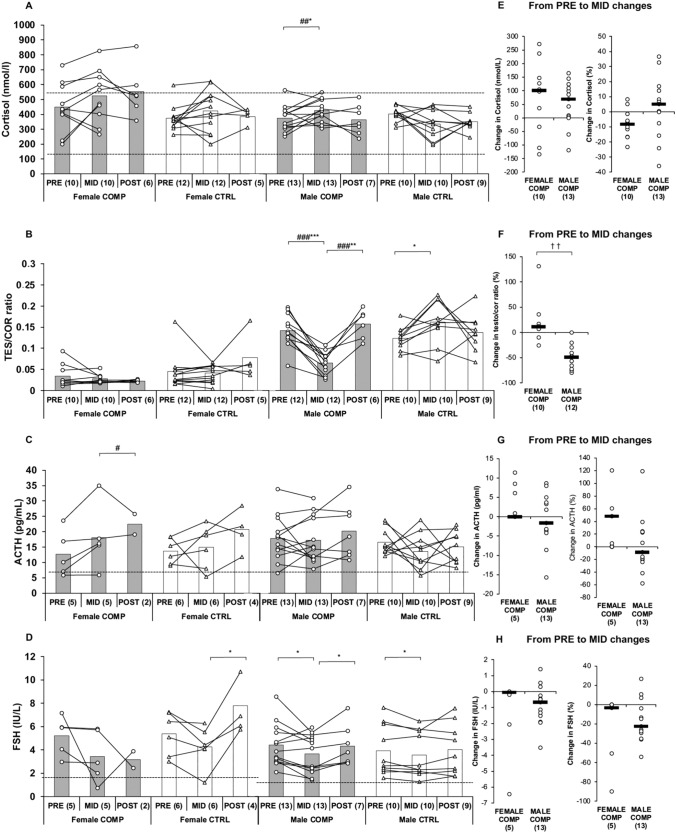
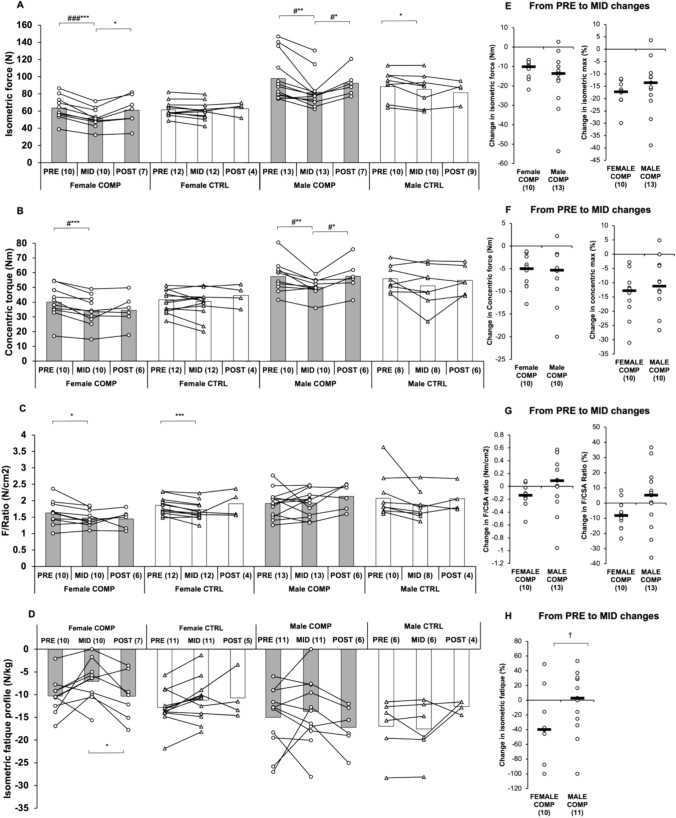
Methods: Participants included female (10 competing (COMP) and 10 non-dieting controls (CTRL)) and male (13 COMP and 10 CTRL) physique athletes. COMP participants were tested 23 weeks before (PRE), one week before (MID), and 23 weeks after the competition (POST). Non-dieting CTRL participants were tested at similar intervals. Measurements included body composition (DXA), muscle cross-sectional area (ultrasound), energy availability (EA) derived by subtracting exercise energy expenditure (EEE) from energy intake (EI) and dividing by fat-free mass (FFM), muscle strength, and various serum hormone concentrations (ACTH, cortisol, estradiol, FSH, IGF-1, IGFBP-3, insulin, and free and total testosterone and SHBG).

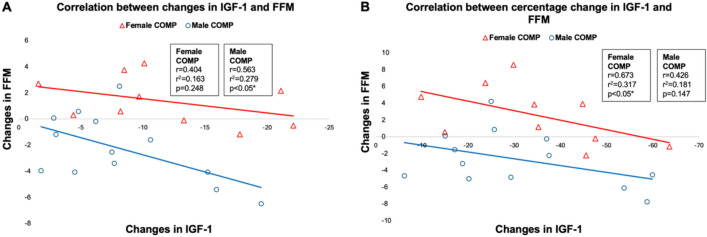
Results: During the diet, EA (p < 0.001), IGF-1 (p < 0.001), IGFBP-3 (p < 0.01), and absolute muscle strength (p < 0.01-0.001) decreased significantly in both sexes in COMP. Decreases in IGF-1 were also associated with higher loss in FFM. In males, testosterone (p < 0.01) and free testosterone (p < 0.05) decreased, while SHBG (p < 0.001) and cortisol (p < 0.05) increased. Insulin decreased significantly only in males (p < 0.001). Mood disturbances, particularly increased fatigue in males (p < 0.05), highlighted the psychological strain of competition preparation. All these changes were restored by increased EA during the post-competition recovery period.

Conclusion: Significant reductions in IGF-1 and IGFBP-3 during competition preparation may serve as biomarkers for monitoring physiological stress. This study offers valuable insights into hormonal changes, muscle strength, and mood state during energy-restricted intense training.

Keywords: Bodybuilding; Energy availability; IGF-1; POMS; REDs; Weight loss.


Conflict of interest statement

Declarations. Conflict of interest: V.I. works part-time as the Executive Manager of the Finnish Fitness Sports Association, which provided partial support for this research. Additionally, V.I. owns a business in the bodybuilding coaching education sector. The financial support from the Finnish Fitness Sports Association was specifically allocated to cover research-related costs, such as hotel accommodation for participants who traveled long distances and required lodging before the next day’s fasted measurements. The funders had no role in the study’s design, data collection, analysis, interpretation, manuscript writing, or the decision to publish the results. E.R. also owns a business in the bodybuilding education industry.

Figures

Fig. 1
Fig. 1
A, B Absolute changes in energy availability and bone mineral density in COMP and CTRL groups from PRE to MID and MID to POST. Baseline pre-test (PRE) was obtained before the dieting phase for the competition, MID one week before the competition, and POST after the recovery period. Numbers in parentheses indicate the number of participants. Circles and triangles indicate individual data for the COMP and CTRL groups, respectively, and bars indicate means. ∗ indicates a statistically significant change within the group. # indicates a statistically significant difference between the COMP and CTRL groups in the change. ∗ #, ∗ ∗ ##, and ∗∗∗ ### represent p-values ranging from < 0.05 to < 0.001. The dotted line represents the EA threshold. EA levels below 30 kcal/kg FFM per day are associated with significant disruptions in body systems, including hormonal alterations and bone health issues. C, D Absolute and percentage changes in female and male COMP groups from PRE to MID. Circles indicate individual data and black lines indicate the mean difference between sexes. Energy availability is expressed in kcal/kg, derived by subtracting EEE from EI and dividing by FFM. Z-score is used as an indicator of bone density
Fig. 2
Fig. 2
A–D Absolute changes in IGF-1, IGFBP-3, total testosterone, and free testosterone in COMP and CTRL groups from PRE to MID and MID to POST. Baseline pre-test (PRE) was obtained before the dieting phase for the competition, MID one week before the competition, and POST after the recovery period. Numbers in parentheses indicate the number of participants. Circles and triangles indicate individual data for the COMP and CTRL groups, respectively, and bars indicate means. ∗ indicates a statistically significant change within the group. # indicates a statistically significant difference between the COMP and CTRL groups in the change. ∗ #, *∗ ##, and ∗∗ ∗ ### represent p-values ranging from < 0.05 to < 0.001. The black dotted lines represent the reference values for a normal-weight person. E–H Absolute and percentage changes in female and male COMP groups from PRE to MID. Circles indicate individual data and black lines indicate the mean. † indicates a statistically significant (p < 0.05) difference between the sexes. IGF-1, insulin-like growth factor 1; IGFBP-3, insulin-like growth factor binding protein 3. Note: No reference values are provided for free testosterone because directly measured free testosterone levels can differ significantly from calculated values
Fig. 3
Fig. 3
These scatter plots illustrate the relationship between changes in IGF-1 and changes in FFM in female (A, C) and male (B, D) COMP from PRE to MID. Each point represents an individual participant. Scatter plots A and B depict absolute changes, while scatter plots C and D depict changes in percentages
Fig. 4
Fig. 4
A–C Absolute changes in SHBG, estradiol, and insulin in COMP and CTRL groups from PRE to MID and MID to POST. Baseline pre-test (PRE) was obtained before the dieting phase for the competition, MID one week before the competition, and POST after the recovery period. Numbers in parentheses indicate the number of participants. Circles and triangles indicate individual data for the COMP and CTRL groups, respectively, and bars indicate means. ∗ indicates a statistically significant change within the group. # indicates a statistically significant difference between the COMP and CTRL groups in the change. ∗ #, ∗∗ ##, and ∗∗∗ ### represent p-values ranging from < 0.05 to < 0.001. The black dotted lines represent the reference values or at least the lower reference value for a normal-weight person. D–F Absolute and percentage changes in female and male COMP groups from PRE to MID. Circles indicate individual data and black lines indicate the mean. † indicates a statistically significant (p < 0.05) difference between the sexes. SHBG sex hormone-binding globulin
Fig. 5
Fig. 5
A–D Absolute changes in cortisol, TES/COR ratio, ACTH, and FSH in COMP and CTRL groups from PRE to MID and MID to POST. Baseline pre-test (PRE) was obtained before the dieting phase for the competition, MID one week before the competition, and POST after the recovery period. Numbers in parentheses indicate the number of participants. Circles and triangles indicate individual data for the COMP and CTRL groups, respectively, and bars indicate means. ∗ indicates a statistically significant change within the group. # indicates a statistically significant difference between the COMP and CTRL groups in the change. ∗ #, ∗∗ ##, and ∗∗∗ ### represent p-values ranging from < 0.05 to < 0.001. The black dotted lines represent the reference values or at least the lower reference value for a normal-weight person. D–F Absolute and percentage changes in female and male COMP groups from PRE to MID. Circles indicate individual data and black lines indicate the mean. †† indicates a statistically significant (p < 0.01) difference between the sexes. TES/COR ratio, testosterone and cortisol ratio, ACTH adrenocorticotropic hormone, FSH follicle-stimulating hormone
Fig. 6
Fig. 6
A–D Absolute changes in lower body strength in COMP and CTRL groups from PRE to MID and MID to POST. Baseline pre-test (PRE) was obtained before the dieting phase for the competition, MID one week before the competition, and POST after the recovery period. Numbers in parentheses indicate the number of participants. Circles and triangles indicate individual data for the COMP and CTRL groups, respectively, and bars indicate means. ∗ indicates a statistically significant change within the group. # indicates a statistically significant difference between the COMP and CTRL groups in the change. ∗ #, ∗∗ ##, and ∗ ∗∗ ### represent p-values ranging from < 0.05 to < 0.001. The black dotted lines represent the reference values or at least the lower reference value for a normal-weight person. D–F Absolute and percentage changes in female and male COMP groups from PRE to MID. Circles indicate individual data and black lines indicate the mean. † indicates a statistically significant (p < 0.05) difference between the sexes. F/Ratio, the ratio of maximal isometric muscle force to CSA (F/CSA); Isometric fatigue profile, fatigue profile based on the performance from the first actual repetition to the last repetition

Similar articles

References

    1. Ahtiainen JP, Pakarinen A, Alen M, Kraemer WJ, Häkkinen K (2003) Muscle hypertrophy, hormonal adaptations and strength development during strength training in strength-trained and untrained men. Eur J Appl Physiol 89:555–563 - PubMed
    1. Ainsworth BE, Haskell WL, Whitt MC, Irwin ML, Swartz AM, Strath SJ, O’Brien WL, Bassett J, Schmitz KH, Emplaincourt PO, Jacobs J, Leon AS (2000) Compendium of physical activities: an update of activity codes and MET intensities. Med Sci Sports Exerc. 10.1097/00005768-200009001-00009 - PubMed
    1. Allen NE, Appleby PN, Davey GK, Key TJ (2002) Lifestyle and nutritional determinants of bioavailable androgens and related hormones in British men. Cancer Causes Control 13:353–363 - PubMed
    1. Angelidi AM, Stefanakis K, Chou SH, Valenzuela-Vallejo L, Dipla K, Boutari C, Ntoskas K, Tokmakidis P, Kokkinos A, Goulis DG, Papadaki HA, Mantzoros CS (2024) Relative energy deficiency in sport (REDs): endocrine manifestations, pathophysiology and treatments. Endocrine Rev. 10.1210/endrev/bnae011 - PubMed
    1. Areta JL, Taylor HL, Koehler K (2021) Low energy availability: history, definition and evidence of its endocrine, metabolic and physiological effects in prospective studies in females and males. Eur J Appl Physiol. 10.1007/s00421-020-04516-0 - PMC - PubMed

LinkOut - more resources