. 2024 Sep 11;15(1):7963.
doi: 10.1038/s41467-024-52214-8.

Factor XII signaling via uPAR-integrin β1 axis promotes tubular senescence in diabetic kidney disease

Affiliations

Factor XII signaling via uPAR-integrin β1 axis promotes tubular senescence in diabetic kidney disease

Ahmed Elwakiel et al. Nat Commun. .

Abstract

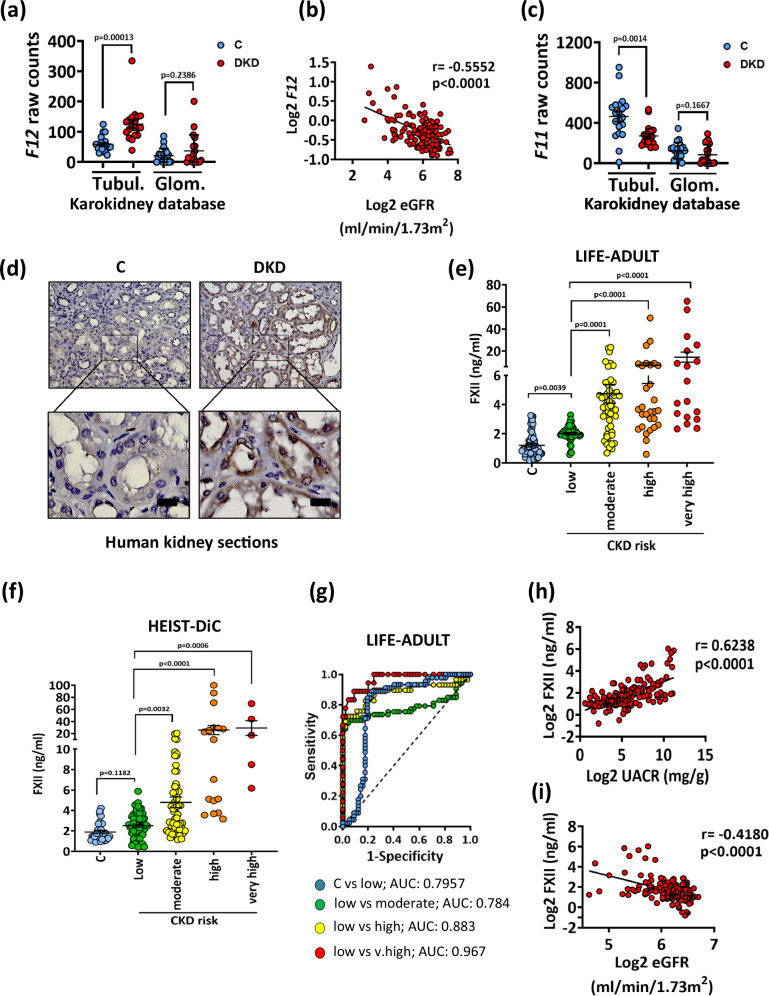
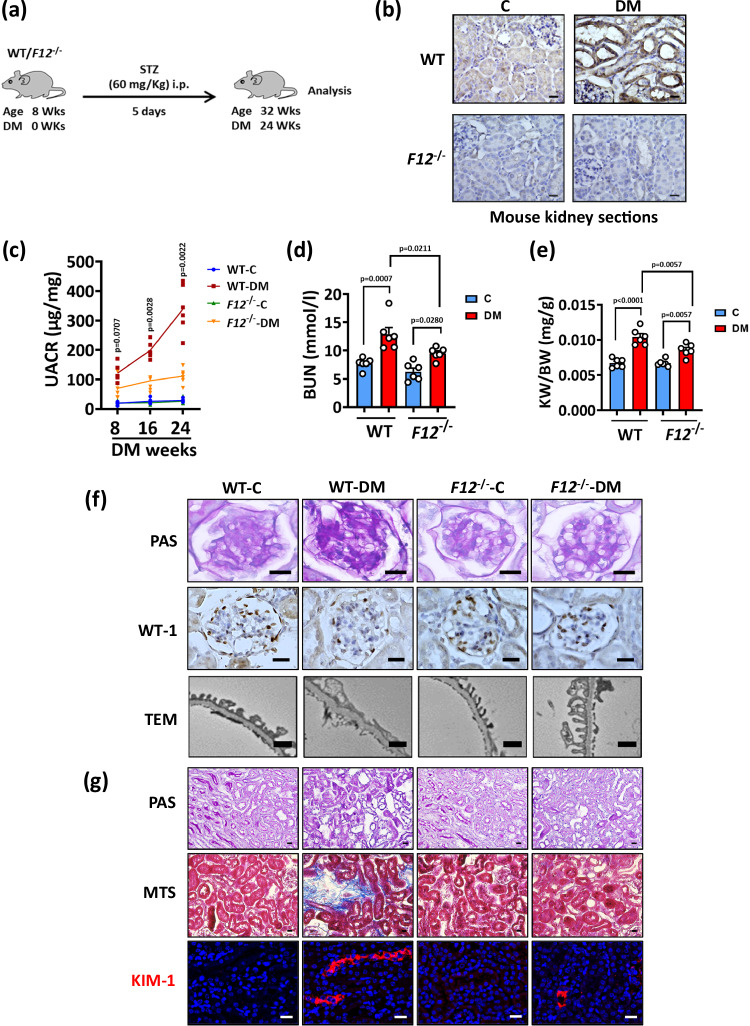
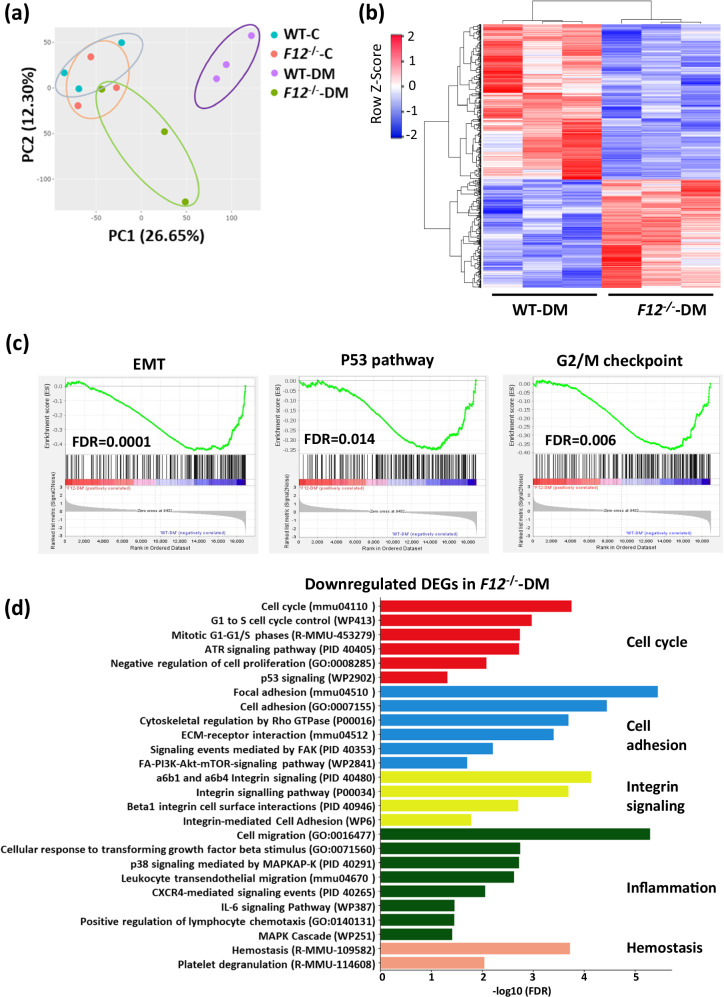
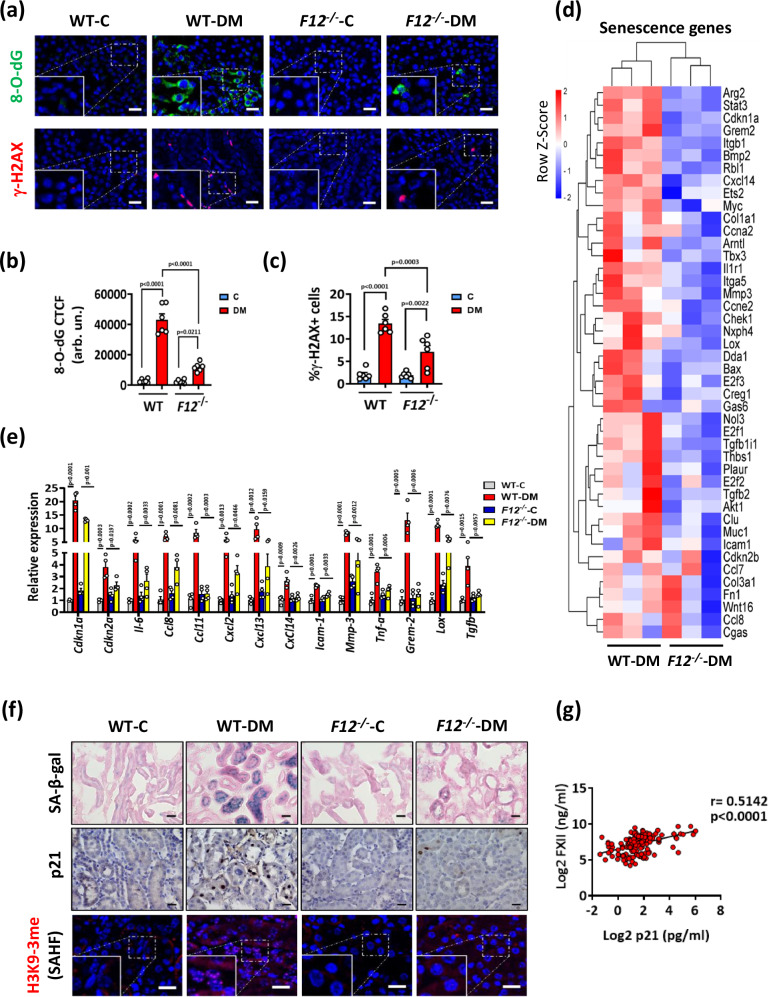
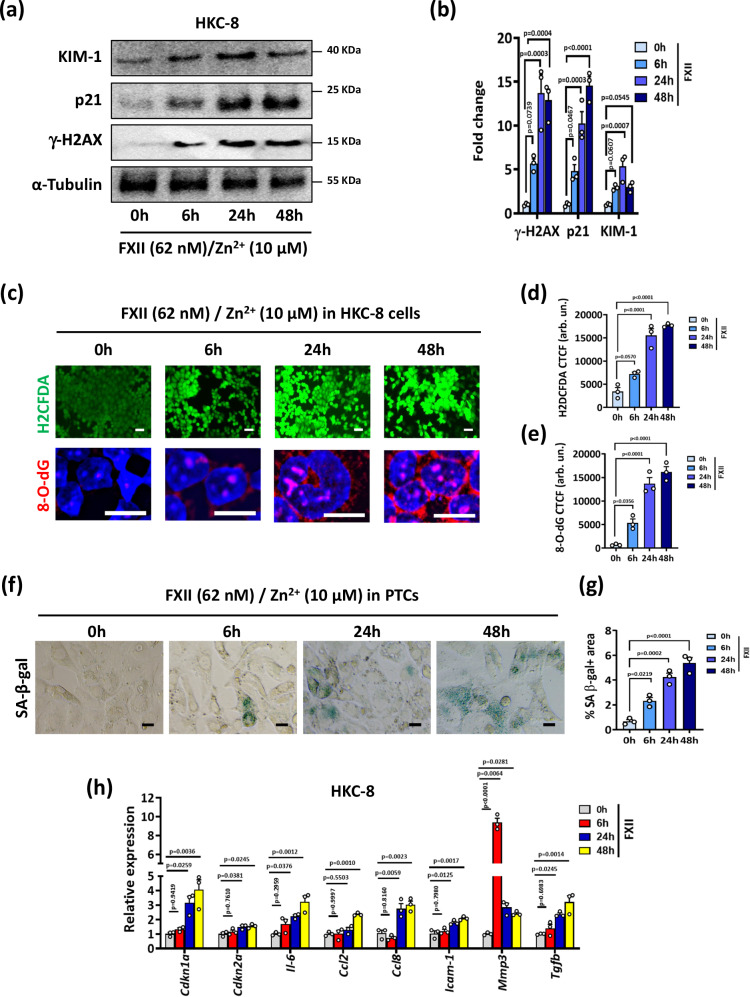
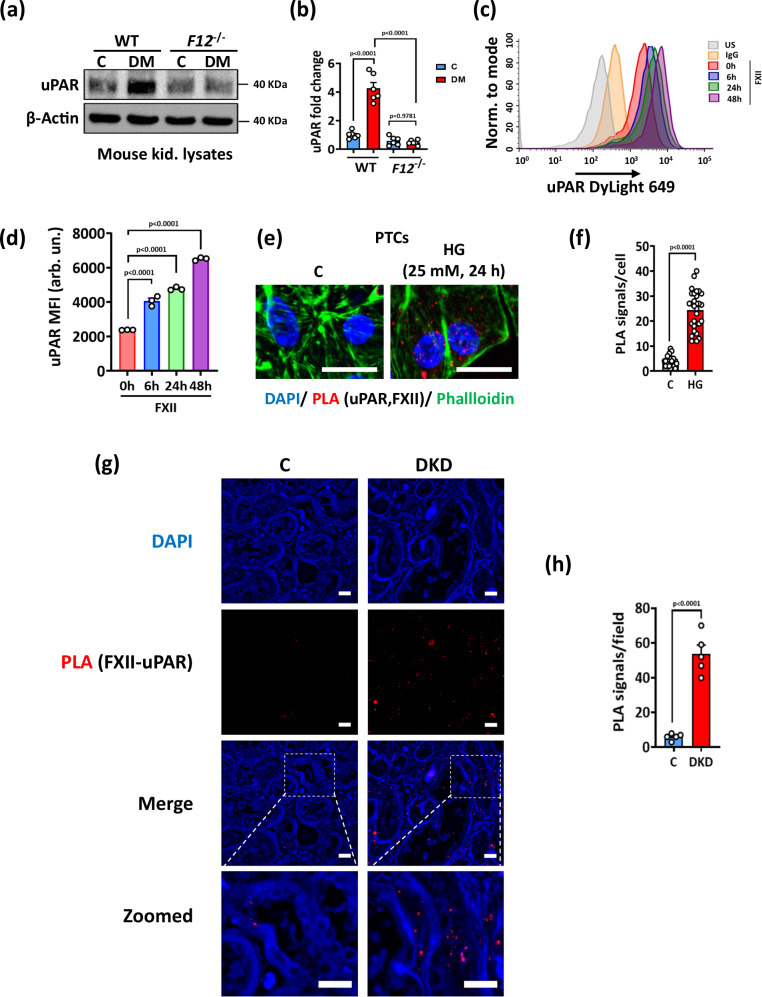
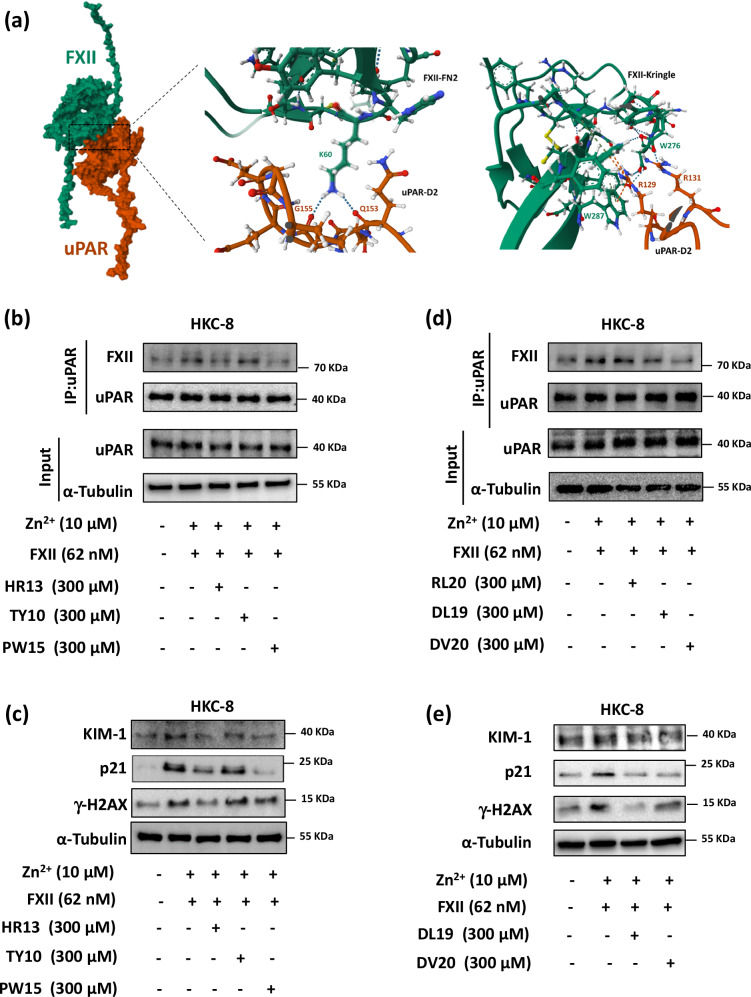
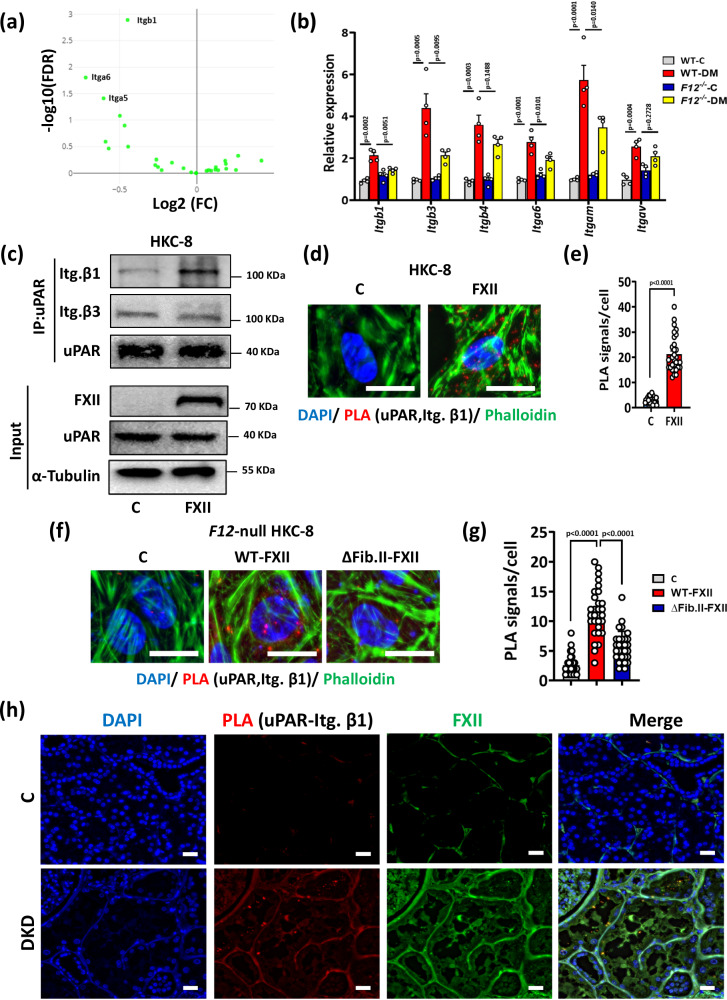
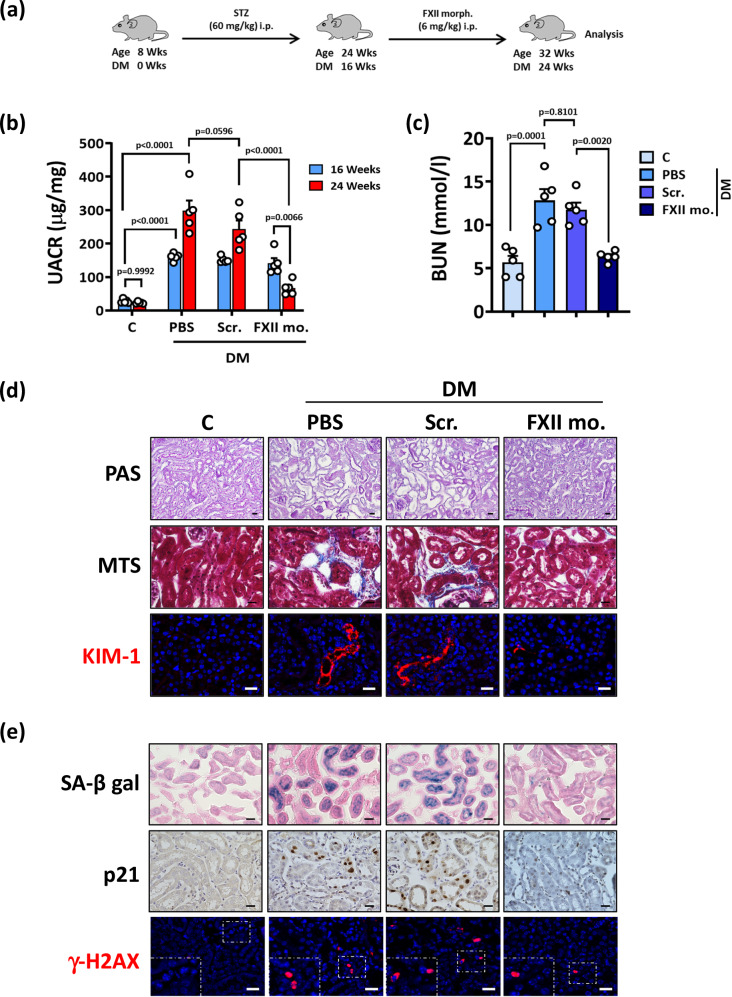
Coagulation factor XII (FXII) conveys various functions as an active protease that promotes thrombosis and inflammation, and as a zymogen via surface receptors like urokinase-type plasminogen activator receptor (uPAR). While plasma levels of FXII are increased in diabetes mellitus and diabetic kidney disease (DKD), a pathogenic role of FXII in DKD remains unknown. Here we show that FXII is locally expressed in kidney tubular cells and that urinary FXII correlates with kidney dysfunction in DKD patients. F12-deficient mice (F12-/-) are protected from hyperglycemia-induced kidney injury. Mechanistically, FXII interacts with uPAR on tubular cells promoting integrin β1-dependent signaling. This signaling axis induces oxidative stress, persistent DNA damage and senescence. Blocking uPAR or integrin β1 ameliorates FXII-induced tubular cell injury. Our findings demonstrate that FXII-uPAR-integrin β1 signaling on tubular cells drives senescence. These findings imply previously undescribed diagnostic and therapeutic approaches to detect or treat DKD and possibly other senescence-associated diseases.


Conflict of interest statement

The authors declare that they have no competing interests.

Figures

Fig. 1
Fig. 1. Upregulation of FXII correlates with impaired kidney function in human DKD.
a Dot-plot summarizing F12 expression in the tubulointerstitial and the glomerular compartments (Karokidney public RNA-sequencing database). Dot-plots reflecting mean ± SEM of 20 controls (C) and 19 DKD samples; two-tailed unpaired student’s t test. b Line-graph representing the negative correlation of F12 expression in the tubulointerstitium with the estimated glomerular filtration rate (eGFR) in CKD patients and in healthy living donors (n = 147) from the Ju CKD Tublnt Dataset of the Nephroseq® database. The confidence interval of r (Pearson coefficient) and P value (two-tailed) were calculated by linear regression. c Dot-plot summarizing F11 expression in the tubulointerstitial and the glomerular compartments (Karokidney public RNA-sequencing database). Dot-plots reflecting mean ± SEM of 20 controls (C) and 19 DKD samples; two-tailed unpaired student’s t test. d Exemplary histological images of human kidney sections stained for FXII (top) and magnified areas (bottom) obtained from nondiabetic controls (C; n = 6) or diabetic patients with DKD (DKD; n = 5). Scale bars represent 20 μm. e, f Dot-plots showing the distribution of the urinary levels of FXII (ng/ml; ELISA) in urine samples obtained from the LIFE-ADULT (e) and HEIST-DiC (f) cohorts (number of samples are provided in Supplementary Tables S2 and S3 respectively). Urinary FXII was measured in normoglycemic controls (C) and in diabetic individuals (CKD grade according to KDIGO criteria). Dot-plots reflecting mean ± SEM; Kruskal-Wallis test with Dunn’s multiple comparison test. g Receiver operating characteristic (ROC) analyses of urinary FXII (ng/ml; ELISA) in diabetic individuals with low risk of CKD compared to nondiabetic controls (blue) or in diabetic individuals with moderate risk of CKD (green), high risk (yellow), and very high risk (red) compared to low-risk patients in the LIFE-ADULT cohort. AUC: area under the curve. h, i Line graphs representing the positive correlation of urinary FXII (ng/ml) with urinary albumin creatinine ration (UACR; mg albumin/g creatinine; (h) n = 140) and the negative correlation with the estimated glomerular filtration rate (eGFR, ml/min/1.73 m²; (i) n = 138) in diabetic individuals from the LIFE-ADULT cohort. The confidence interval of r (Pearson coefficient) and P values (two-tailed) were calculated by linear regression. Source data are provided as a “Source Data” file.
Fig. 2
Fig. 2. F12-/- mice are protected from DKD.
a Experimental scheme of the DKD model. Wild type (WT) and F12-/- mice were age-matched, and persistent hyperglycemia was induced using streptozotocin (STZ) for 24 weeks. b Exemplary histological images of kidney sections stained for FXII comparing normoglycemic controls (C) and hyperglycemic (DM) WT and F12-/- mice. FXII is detected by HRP-DAB reaction (brown); hematoxylin nuclear counter stain (blue). Scale bars represent 20 μm. c Line graphs showing urinary albumin-creatinine ratio (UACR, μg albumin/mg creatinine) in experimental groups (as described in b) after 8, 16, or 24 weeks of persistent hyperglycemia. Line graphs reflecting mean ± SEM of 6 mice per group; two-way ANOVA with Tukeys’s multiple comparison test comparing hyperglycemic WT and F12-/- mice at the 3 time points. d, e Dot-plots summarizing blood urea nitrogen (BUN, mmol/l; (d) and adjusted kidney weight (KW/BW, mg kidney weight /g body weight; (e) in the experimental groups (as described in b). Dot-plots reflecting mean ± SEM of 6 mice per group; two-way ANOVA with Tukeys’s multiple comparison test. f Exemplary histological images of periodic acid Schiff staining (PAS) showing glomeruli (top panel), podocyte number reflected by Wilms tumor 1 immunostaining (WT-1, brown, hematoxylin nuclear counterstain, blue; middle panel), and transmission electron microscopy of podocytes (TEM; bottom panel) in experimental groups (as described in b); scale bars of top and middle panels represent 20 μm, while scale bars of bottom panel represent 1 μm. g Exemplary histological images of periodic acid Schiff staining (PAS) showing tubuli (top panel), interstitial fibrosis (middle panel, Masson’s trichrome stain, MTS), and kidney injury molecule-1 immunostaining (bottom panel, KIM-1, red; DAPI nuclear counterstain, blue) in experimental groups (as described in b); all scale bars represent 20 μm. Source data are provided as a “Source Data” file.
Fig. 3
Fig. 3. FXII deficiency induces differential gene expression in DKD.
a Principal component analysis (PCA) on gene sets of normoglycemic (C) and hyperglycemic (DM) WT and F12-/- mice kidneys. b Heatmap of the RNA-seq data showing the differentially expressed genes (DEGs) in WT-DM and F12-/--DM mice. Each column represents data from an individual mouse. Color intensity represents row Z-score. c Gene set enrichment analysis (GSEA) plots of the hallmark gene sets representing key negatively enriched pathways when comparing F12-/--DM to WT-DM kidneys. Significance is represented by the false discovery rate (FDR). d Bar graph representing the top enriched pathways based on the downregulated differentially expressed genes (DEGs) in F12-/--DM compared to WT-DM kidneys using KEGG (Kyoto Encyclopedia of Genes and Genomes), WikiPathways, Reactome, PID (Pathway Interaction Database), and GO (Gene Ontology: Biological processes) databases. The pathways were ranked by the false discovery rate (FDR). Source data are provided as a “Source Data” file.
Fig. 4
Fig. 4. F12-/- mice kidneys are less susceptible to DNA damage and associated senescence.
ac Exemplary images (a) and dot blots summarizing results (b, c) of 8-hydroxy-2’-deoxyguanosine (8-O-dG) and phosphorylated H2A histone X (γ-H2AX) staining comparing normoglycemic (control, C) and hyperglycemic (DM) wild type (WT) and F12-/- mice. 8-O-dG and γ-H2AX are immunofluorescently detected, green and red, respectively; DAPI nuclear counterstain, blue. Insets show higher magnification of the marked areas. Scale bars represent 20 μm. Dot-plots reflecting mean ± SEM of 6 mice per group; two-way ANOVA with Tukeys’s multiple comparison test. CTCF: corrected total cell fluorescence. Arb. un.: arbitrary units. d Heatmap of the RNA-seq data showing gene expression changes of senescence-associated genes in WT-DM and F12-/--DM mice. Each column represents data from an individual mouse. Color intensity represents row Z-score. e Bar graphs summarizing expression (qRT-PCR) of selected senescence-associated genes in experimental groups (as described in a). Bar graphs reflecting mean ± SEM of 4 mice per group; two-way ANOVA with Tukeys’s multiple comparison test. f Exemplary images of mouse kidney sections stained for senescence-associated β-galactosidase (top panel, SA-β-gal, blue; eosin counterstain), p21 (middle panel, detected by HRP-DAB reaction, brown; hematoxylin nuclear counter stain, blue), and senescence-associated heterochromatin foci of tri-methyl-histone H3 (Lys9) (bottom panel, H3K9-3me SAHF, immunofluorescently detected, red; DAPI nuclear counterstain, blue, insets show higher magnification of the marked areas) in experimental groups (as described in a). Scale bars represent 20 μm. g Line graph representing the positive correlation of urinary FXII (ng/ml) with urinary p21 (pg/ml) in diabetic individuals from the LIFE-ADULT cohort (n = 146). The confidence interval of r (Pearson coefficient) and P values (two-tailed) were calculated by linear regression. Source data are provided as a “Source Data” file.
Fig. 5
Fig. 5. FXII induces DNA damage and associated senescence in kidney tubular cells in vitro.
a, b Representative immunoblots (a loading control: α-Tubulin) and dot-plots summarizing results (b) for γ-H2AX, p21, and KIM-1 expression in HKC-8 cells exposed to purified human FXII (62 nM) in the presence of Zn2+ (10 µM) for 6, 24, and 48 h. Dot-plots reflecting mean ± SEM of 3 independent experiments; one-way ANOVA with Tukeys’s multiple comparison test. ce Exemplary images (c) and dot-plots summarizing results (d, e) of staining with the intracellular ROS detector 2’,7’-dichlorodihydrofluorescein diacetate (top panel, H2DCFDA, green) and 8-hydroxy-2’-deoxyguanosine (bottom panel, 8-O-dG, red; DAPI nuclear counterstain, blue) in experimental groups (as described in a). Scale bars represent 20 μm. Dot-plots reflecting mean ± SEM of 3 independent experiments; one-way ANOVA with Tukeys’s multiple comparison test. CTCF corrected total cell fluorescence. Arb. un.: arbitrary units. f, g Exemplary images of senescence-associated β-galactosidase (f, SA-β-gal, blue) and dot-plot summarizing quantification of SA-β-gal staining (g) in PTCs treated with recombinant mouse FXII (62 nM) in the presence of Zn2+ (10 µM) for 6, 24, and 48 h. Dot-plots reflecting mean ± SEM of 3 independent experiments; one-way ANOVA with Tukeys’s multiple comparison test. h Bar graphs summarizing expression (qRT-PCR) of selected senescence-associated genes in experimental groups (as described in a). Bar graphs reflecting mean ± SEM of 3 independent experiments; one-way ANOVA with Tukeys’s multiple comparison test. Source data are provided as a “Source Data” file.
Fig. 6
Fig. 6. FXII interacts with uPAR to signal on tubular cell surface.
a, b Representative immunoblots (a loading control: β-Actin) and dot-plot summarizing results (b) for uPAR expression in kidney lysates of normoglycemic controls (C) and hyperglycemic (DM) wild type (WT) and F12-/- mice. Dot-plot reflecting mean ± SEM of 6 mice per group; two-way ANOVA with Tukeys’s multiple comparison test. c, d Representative histogram (c) and dot-plot summarizing the results (d) of uPAR surface staining determined by flow cytometry (mean fluorescence intensity, MFI) in HKC-8 cells exposed to purified human FXII (62 nM) in the presence of Zn2+ (10 µM) for 6, 24, and 48 h. Dot-plot reflecting mean ± SEM of 3 independent experiments; one-way ANOVA with Tukeys’s multiple comparison test. e, f Representative images of proximity ligation assay (PLA, e) and dot-plot summarizing results (f) in PTCs exposed to normal (5 mM) or high (25 mM) glucose for 24 h. PLA signals representing FXII and uPAR interaction are immunofluorescently detected, red; DAPI nuclear counterstain, blue; phalloidin for cytoskeleton, green. Scale bars represent 20 μm. Dot-plot reflecting mean ± SEM of 3 independent experiments quantifying 30 cells from each condition with each dot representing the number of PLA signals/cell; two-tailed unpaired student’s t test. g, h Representative histological images of proximity ligation assay (g, PLA, red dots representing FXII and uPAR interaction) and dot-plot summarizing results (h) in human kidney sections of nondiabetic controls (C) or diabetic patients with DKD (DKD); DAPI nuclear counterstain (blue). Scale bars represent 20 μm. Dot-plot reflecting mean ± SEM of 5 samples per group with each dot representing the mean of PLA signals/field for one sample; two-tailed unpaired student’s t test. Source data are provided as a “Source Data” file.
Fig. 7
Fig. 7. FXII interacts with uPAR through its FN2 and kringle domains.
a Computational model of the FXII-uPAR complex with magnified areas depicting the interaction of FXII’s fibronectin type II (FN2) and Kringle domains with uPAR domain 2 at multiple sites. b Representative immunoblots for FXII and uPAR from uPAR coimmunoprecipitation (IP, top) and immunoblots for uPAR, and α-Tubulin from the input (input, bottom) of HKC-8 cells exposed to purified human FXII (62 nM) in the presence of Zn2+ (10 µM) for 24 h with and without pretreatment with FXII sequential peptides (HR13, TY10 and PW15; 300 µM) for 1 h compared to control non-treated cells (C). Input serves as a loading control. Immunoblots represent 3 independent experiments. c Representative immunoblots (loading control: α-Tubulin) for γ-H2AX, p21, and KIM-1 expression in experimental groups (as described in b). Immunoblots represent 3 independent experiments. d Representative immunoblots for FXII and uPAR from uPAR coimmunoprecipitation (IP, top) and immunoblots for uPAR, and α-Tubulin from the input (input, bottom) of HKC-8 cells exposed to purified human FXII (62 nM) in the presence of Zn2+ (10 µM) for 24 h with and without pretreatment with uPAR based peptides (RL20, DL19, and DV20; 300 µM) for 1 h compared to control non-treated cells. Input serves as a loading control. Immunoblots represent 3 independent experiments. e Representative immunoblots (loading control: α-Tubulin) for γ-H2AX, p21, and KIM-1 expression in experimental groups (as described in d). Immunoblots represent 3 independent experiments.
Fig. 8
Fig. 8. Integrin β1 is required for FXII-uPAR signaling on tubular cells.
a Volcano plot comparing hyperglycemic F12-/- mice to hyperglycemic WT mice based on Log fold change (FC) values and the false discovery rate (FDR); integrins are shown in green. Integrin β1 (Itgb1) is the most downregulated integrin in hyperglycemic F12-/- mice kidneys by FDR. b Bar graphs summarizing the expression (qRT-PCR) of selected integrin genes comparing normoglycemic controls and hyperglycemic WT and F12-/- mice. Bar graphs reflecting mean ± SEM of 4 mice per group; two-way ANOVA with Tukeys’s multiple comparison test. c Representative immunoblots for active integrin β1, active integrin β3, and uPAR from uPAR coimmunoprecipitation (IP, top) and immunoblots for FXII, uPAR, and α-Tubulin from the input (input, bottom,) of HKC-8 cells exposed to purified human FXII (62 nM) in the presence of Zn2+ (10 µM) for 24 h (FXII) compared to control non-treated cells (C). Input serves as a loading control. Immunoblots represent 3 independent experiments. d, e Representative images of proximity ligation assay (PLA, d; red, uPAR and active integrin β1 interaction) and dot-plot summarizing results (e) in experimental groups (as described in c); DAPI nuclear counterstain, blue; phalloidin for cytoskeleton, green. Scale bars represent 20 μm. Dot-plot reflecting mean ± SEM of 3 independent experiments quantifying 30 cells from each condition with each dot representing the number of PLA signals/cell; two-tailed unpaired student’s t test. f, g Representative images of proximity ligation assay (PLA, f; red dots representing uPAR and active integrin β1 interaction) and dot-plot summarizing results (g) in F12-null HKC-8 cells transfected with wild type FXII (WT-FXII) or a FXII deletion mutant lacking fibronectin type II domain (∆Fib-II-FXII) compared to empty-vector transfected cells (C, controls); DAPI nuclear counterstain, blue; and phalloidin for cytoskeleton, green. Scale bars represent 20 μm. Dot-plot reflecting mean ± SEM of 3 independent experiments quantifying 30 cells from each condition with each dot representing the number of PLA signals/cell; one-way ANOVA with Tukeys’s multiple comparison test. h Representative images of proximity ligation assay (PLA, f; red dots representing uPAR and active integrin β1 interaction) in human kidney sections of nondiabetic controls (C) or diabetic patients with DKD (DKD); DAPI nuclear counterstain, blue; and FXII, green. Scale bars represent 20 μm. Source data are provided as a “Source Data” file.
Fig. 9
Fig. 9. Targeting FXII ameliorates established DKD.
a Experimental scheme of the DKD model with interventions. WT mice were age-matched, and persistent hyperglycemia was induced using streptozotocin (STZ) and maintained for 16 weeks. Subgroups of mice were treated with PBS, mismatch morpholino, or FXII translational blocking morpholino (FXII morph.) starting from 16 weeks of hyperglycemia for a further 6 weeks. Wks: weeks. b Dot-plot showing average urinary albumin-creatinine ratio (UACR, μg albumin/mg creatinine) in experimental groups (as described in a) after 16 or 24 weeks of persistent hyperglycemia. Dot-plot reflecting mean ± SEM of 5 mice per group; two-way ANOVA with Tukeys’s multiple comparison test. c Dot-plot summarizing blood urea nitrogen (BUN, mmol/l) in experimental groups (as described in a). Dot-plot reflecting mean ± SEM of 5 mice per group; one-way ANOVA with Tukeys’s multiple comparison test. d Exemplary histological images of periodic acid Schiff staining (top panel, PAS), interstitial fibrosis (middle panel, Masson’s trichrome stain, MTS), and kidney injury molecule-1 immunostaining (bottom panel, KIM-1, red; DAPI nuclear counterstain, blue) in experimental groups (as described in a); scale bars represent 20 μm. e Exemplary histological images of senescence-associated β-galactosidase (top panel, SA-β-gal, blue; eosin counterstain), p21 immunostaining (middle panel, detected by HRP-DAB reaction, brown; hematoxylin nuclear counter stain, blue), and phosphorylated H2A histone X (bottom panel, γ-H2AX, immunofluorescently detected, red; DAPI nuclear counterstain, blue, insets show higher magnification of the marked areas) in experimental groups (as described in a); scale bars represent 20 μm. Source data are provided as a “Source Data” file.

References

    1. Maas, C. & Renne, T. Coagulation factor XII in thrombosis and inflammation. Blood131, 1903–1909 (2018). 10.1182/blood-2017-04-569111 - DOI - PubMed
    1. Mahdi, F., Madar, Z. S., Figueroa, C. D. & Schmaier, A. H. Factor XII interacts with the multiprotein assembly of urokinase plasminogen activator receptor, gC1qR, and cytokeratin 1 on endothelial cell membranes. Blood99, 3585–3596 (2002). 10.1182/blood.V99.10.3585 - DOI - PubMed
    1. LaRusch, G. A. et al. Factor XII stimulates ERK1/2 and Akt through uPAR, integrins, and the EGFR to initiate angiogenesis. Blood115, 5111–5120 (2010). 10.1182/blood-2009-08-236430 - DOI - PMC - PubMed
    1. Stavrou, E. X. et al. Factor XII and uPAR upregulate neutrophil functions to influence wound healing. J. Clin. Investig.128, 944–959 (2018). 10.1172/JCI92880 - DOI - PMC - PubMed
    1. Vorlova, S. et al. Coagulation factor XII induces pro-inflammatory cytokine responses in macrophages and promotes atherosclerosis in mice. Thromb. Haemost.117, 176–187 (2017). 10.1160/TH16-06-0466 - DOI - PubMed

Publication types

MeSH terms

Associated data

LinkOut - more resources